

cemagraphics
Written by Nick Ackerman, co-produced by Stanford Chemist. This article was originally published to members of the CEF/ETF Income Laboratory on October 18th, 2022.
First Trust High Yield Opportunities 2027 Term Fund (NYSE:FTHY) invests in a portfolio primarily composed of high-yield bonds. However, the fund also has exposure to senior loan investments too. These are also a higher risk as they are issued by “junk” rated companies. On the other hand, they are higher up in the capital stack and generally feature floating rates. Floating rates can be important in a period of time when the Fed is raising interest rates.
Since this fund’s launch, it has been under significant pressure. Exactly due to the interest rates being raised so aggressively. With an expectation for a recession – mild or otherwise – discounts on their underlying holdings have also appeared. If we hit an economic downturn, below-investment-grade rated bonds and loans will be the first to feel their defaults and bankruptcies tick higher.
These pressures on the fund have meant even deeper losses since we last covered the fund. On a total return basis, it has even underperformed the S&P 500 to provide some context. However, it was primarily due to discount widening, or it would have held up relatively better.
FTHY Performance Since Previous Update (Seeking Alpha)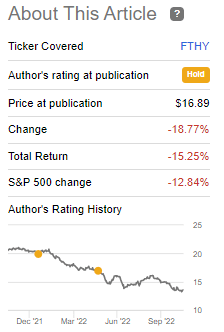
At the same time, the discount on the underlying portfolio is quite hefty at a weighted average price of $86.64. Combined with the 14%+ discount for FTHY, it presents an opportunity where a large portion of this should already be priced.
On top of this, the fund is a term fund that is anticipated to be liquidated in August 2027. That’s still quite a ways off, but as we get closer in the last year or two, it could present a kicker as the discount could be realized. Of course, that can be achieved either by the share price rising to meet the NAV; or by the NAV falling to meet the share price.
The Basics
- 1-Year Z-score: -1.52
- Discount: 13.44%
- Distribution Yield: 11.25%
- Expense Ratio: 2.02%
- Leverage: 21.56%
- Managed Assets: $732.9 million
- Structure: Term (anticipated liquidation around August 1st, 2027)
FTHY’s investment objective is “to provide current income.” They intend to do this by “investing at least 80% of its Managed Assets in high yield debt securities of any maturity that are rated below investment grade at the time of purchase or unrated securities determined by the Advisor to be of comparable quality. High-yield debt securities include the U.S. and non-U.S. corporate debt obligations and senior, secured floating-rate loans (“Senior Loans”).”
The fund’s expense ratio continues to swell. Now it is above the 2% level. When including the leverage costs of the fund, it comes up to 2.41%. I noted this as a negative previously, and it seems to be getting worse.
The leverage expenses will continue to rise as interest rates rise. The borrowings are based on 1-month LIBOR plus 0.85%.
They have chosen not to hedge the costs at this time through any interest-rate swaps or fixed-rate financing. However, one could argue that the underlying floating rate portion of their portfolio would be seen as a natural hedge. Additionally, they’ve slashed their leverage significantly since the last update.
They’ve taken it to $158 million in borrowings, reducing the leverage ratio to 21.56%. They had borrowings of $306 million previously. This can be viewed as a positive; as the market continues to sink, it would have reduced the pace of losses – relative to if it had been highly leveraged. This is even more beneficial if they put more capital to work at lower prices and can time a recovery.
FTHY Borrowings (First Trust)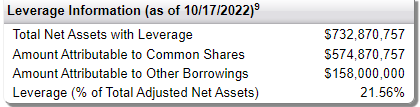
However, a big negative here is that they weren’t covering their distribution previously, and now this will only impact it even further. We’ll touch more on that in the distribution section.
FTHY Performance – Discount Widening
FTHY has been getting hit along with the rest of the market. Below we can see the comparison between FTHY with (BKLN) and (HYG). BKLN is a senior loan-focused ETF, and HYG is the BlackRock high-yield corporate bond ETF.
For the most part, FTHY is coming in about where we should expect on a total NAV return basis. The fund has a heavier tilt towards high-yield bonds, so it will naturally follow along with HYG closer. We then add on a layer of leverage – significant leverage heading into the year that has now been reduced.
Ycharts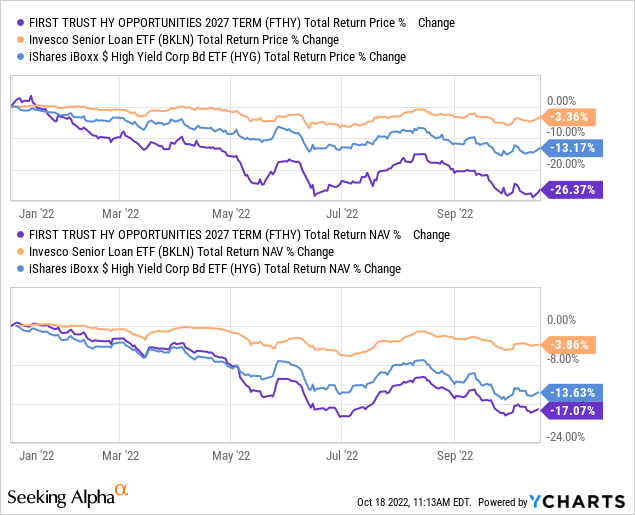
Clearly, the performance isn’t anything to brag about, but we can at least explain why we see the results we are seeing. The main potential opportunity really comes from the fund’s discount. We are now very nearly at the all-time low discount that the fund has reached. While that doesn’t guarantee better results going forward, it can help when things turn around.
Ycharts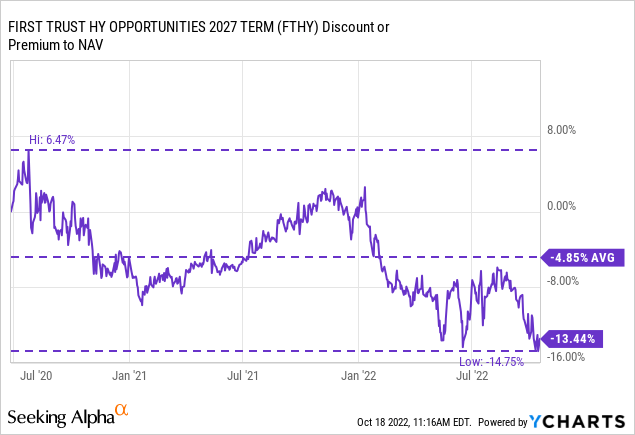
Distribution – Reduced Leverage, Reduced Coverage
FTHY’s distribution rate comes to 11.25%, with a NAV rate of 9.74%. The underlying portfolio has a weighted average coupon of 6.01%, and the ratio of net investment income to average net assets comes to 5.81%. Unfortunately, even including leverage this doesn’t add up to be covered. That’s why we’ve seen a couple of distribution cuts.
FTHY Distribution History (CEFConnect)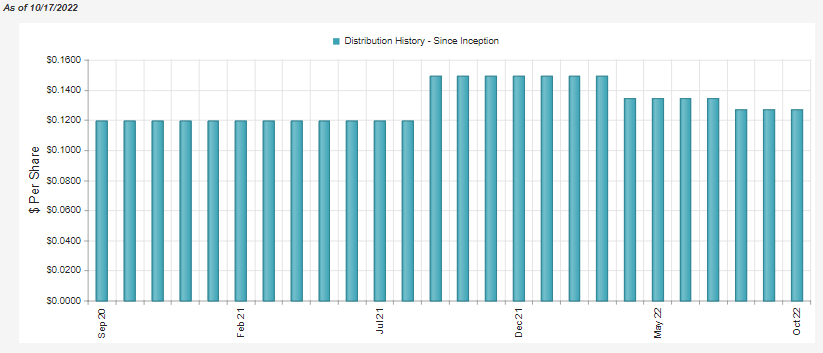
Interestingly, the fund is still paying out a higher amount now than it initially started after its inception. Unfortunately, though, is that the distribution coverage remains weak still. Further cuts are certainly on the table in our opinion.
We noted that NII was heading a bit higher previously, but it still doesn’t seem like enough to cover the current distribution. Which is something we noted previously, too.
FTHY Annual Report (First Trust)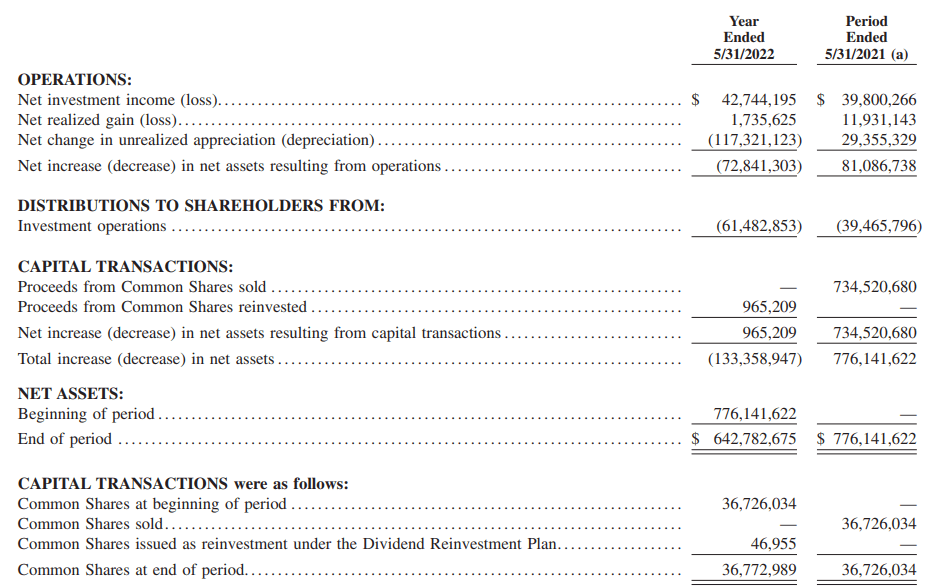
The per-share NII went from $1.08 to $1.16. However, the current distribution would annualize out to $1.5228. Based on the last known share count in this report, that would be roughly $55.998 million in distributions for a 12-month period. NII came in at $42.744 million, which results in coverage of only around 76.3%.
With a fixed-income fund, we want to see this number over 100%. Even with the senior loan exposure in the portfolio, the lack of coverage seems as though it will remain. As leverage has been reduced, we could see NII fall in the next semi-annual report.
FTHY’s Portfolio
FTHY’s portfolio has taken a significant hit. Of course, we can see that in the NAV – which we’ve seen declines across both stocks and bonds for 2022. Again, this is where another strong potential opportunity can get better-the discount of the underlying portfolio on the discount of the underlying fund.
FTHY Portfolio Stats (First Trust)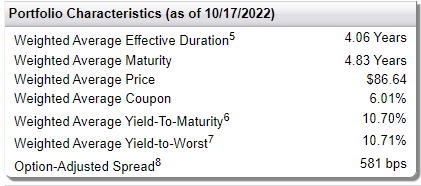
The effective duration of 4.06 years is certainly lower than funds that invest in higher-quality debt. However, it actually comes in relatively close to HYG’s effective duration of 4.16 years. HYG is invested entirely in high-yield bonds. That means that FTHY’s portfolio doesn’t seem to be gaining a meaningful defensive position from higher interest rates despite the senior loan exposure.
FTHY Asset Allocation (First Trust)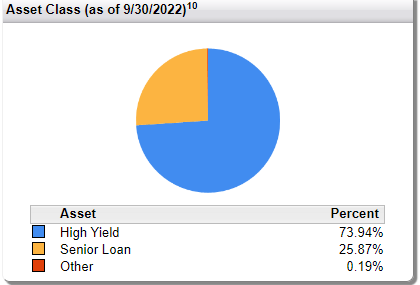
This latest duration comes down a bit from the 4.23 years it showed earlier this year. It is still above the 2.98 years it had reflected at the end of 2021. Since the end of 2021, they have reduced the senior loan exposure from the nearly 35% it had stood at.
Admittedly, it seems strange that they kept getting away from the senior loan weighting in their portfolio. I initially thought this would have been their way to position the fund more appropriately for higher interest rates. Here’s what I mentioned in that previous piece at the end of 2021;
I believe the largest strength of FTHY is its unique holdings to senior loans and high yield. As I touched on, it should mean less interest rate sensitivity. The fund is flexible to invest in each sleeve freely. However, they have been sticking around a 65/35 split between high yield and senior loans. This is once again what we are seeing at the end of November.
Unfortunately, they didn’t lean into that strength. That being said, it is easy to see the results of what they should have done with the power of hindsight. Presumably, they thought they must have been getting better deals in the high-yield bond market after the initial drops.
Looking at the broader portfolio, we see that single B makes up the largest fund allocation. However, there is some meaningful triple C exposure too. This is the most sensitive area to economic downturns because these issuers are one rainy day away from default (i.e., they need just about everything to go right to continue meeting their financial obligations on debt.)
FTHY Portfolio Credit Rating (First Trust)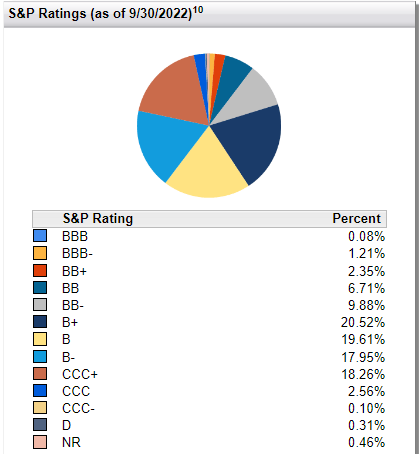
According to CEFConnect, the portfolio is spread across 210 positions. While it isn’t the most aggressive in the number of holdings relative to some other fixed-income funds, this is still a large number. This can be important because it helps diversify their portfolio across many industries.
FTHY Industry Exposure (First Trust)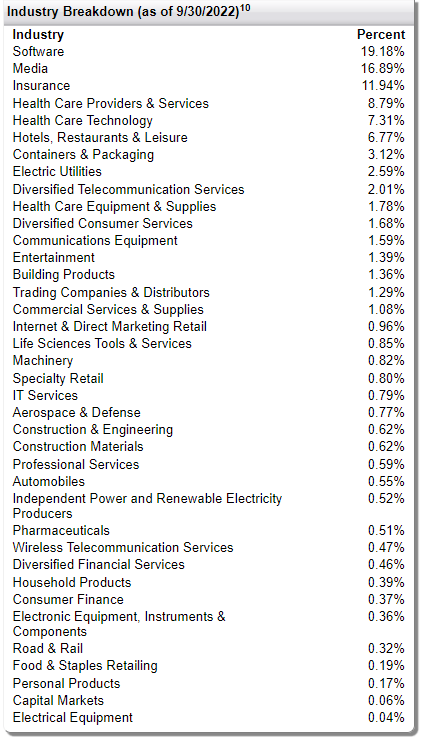
Some industries can better withstand certain shocks in the system than others, spreading out the risk amongst many industries and issuers that all operate differently.
Diversification can also help mitigate the risk of just a handful of companies defaulting and significantly hurting the fund. So even if a certain industry gets hit harder than another, one company’s performance may still navigate more successfully.
Conclusion
FTHY’s performance hasn’t been particularly attractive. The high leverage the fund started this year with certainly made the results worse. The fund’s high expense ratio also isn’t going to help things. I’m also fairly disappointed that they hadn’t taken advantage of investing more in senior loans earlier this year.
Where the fund’s opportunity lies is the underlying portfolio is heavily discounted. Combined with the fund’s own discount, it makes it particularly interesting now.
Be the first to comment