

narvikk
The Innovator IBD 50 ETF (NYSEARCA:FFTY) is an equity-focused investment vehicle adhering to the tenets of the CAN SLIM Investing System. FFTY’s approach is what I would prefer to call a ‘quasi-passive’ one, for it has elevated turnover, with the portfolio frequently rebuilt almost completely, with shifts in exposure being nothing short of tectonic.
The last time I covered this ETF was in August, with a Hold rating, and there are a few reasons why FFTY is worth taking a closer look at today.
First, the portfolio has seen a profound recalibration since then, with holdings present in the August version having just 27% weight in the current (November 17). That is to say, we need to have an understanding of how this equity basket has evolved, and what factors are now at play.
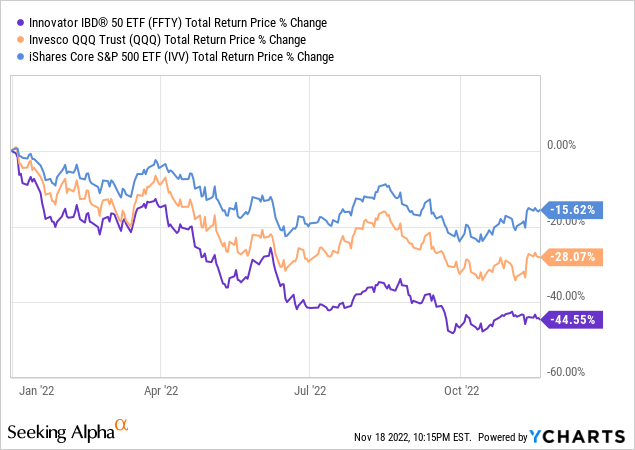
Second, FFTY has dramatically underperformed the S&P 500, falling 10.9% vs. 3.6%. In fairness, I did not expect such a steep decline, even though I warned that high expenses and spotty past performance were not supportive of a bullish thesis.
Overall, we see FFTY’s price is down around 44% YTD, dwarfing the declines of both the Invesco QQQ ETF (QQQ) and the iShares Core S&P 500 ETF (IVV), and such a remarkable underperformance welcomes buy-the-dip thoughts. In this regard, we should review the portfolio to examine whether a buying opportunity has emerged.
As a reminder, FFTY brings together fundamental and technical analysis leveraging the CAN SLIM model in its portfolio calibration process. The constituents of the IBD 50 Index are selected scrupulously from an around 7,000-strong universe encompassing U.S. and international stocks. The index is reconstituted weekly, so FFTY’s astounding turnover of 1,133% (as of the prospectus) is no surprise.
In short, the eleven factors considered are principally related to quality and growth, e.g., amongst metrics assessed are EPS, relative price strength, sales margin return on equity, accumulation distribution, as well as industry group relative strength ratings; the EPS and sales growth rates are also amongst parameters reviewed. More details on the complicated rules could be found in the prospectus on the fund’s website.
Another way of saying, this is a high-conviction growth/momentum-leaning concentrated equity basket. Yet it does not deliver.
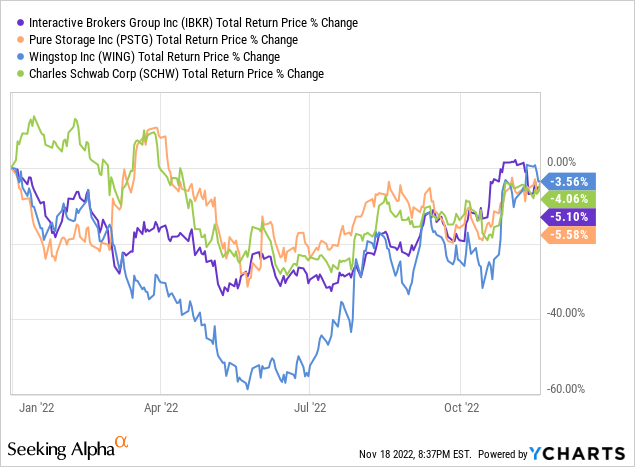
Let us look at the current version of the portfolio. First, momentum is what deserves attention. As of November 17, just four of fifty FFTY’s holdings had delivered negative returns in 2022 to date, namely Wingstop (WING), Interactive Brokers (IBKR), Pure Storage (PSTG), and Charles Schwab (SCHW). As can be seen, they have declined only modestly, outperforming IVV.
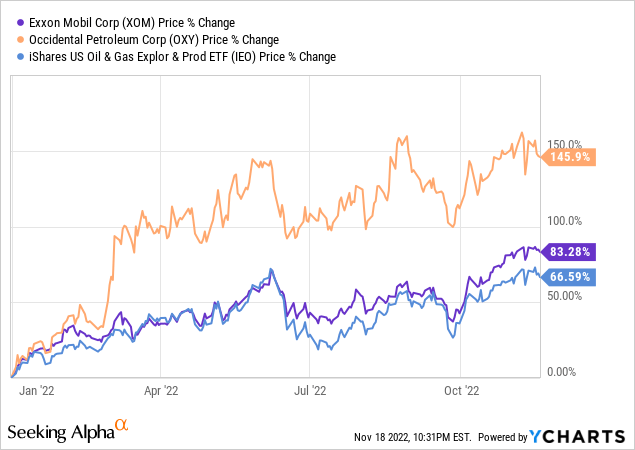
Other stocks in the basket have a median YTD return of a staggering 46.6%. However, the issue here is that it is crystal clear that most have not contributed to FFTY’s performance this year. As I said above, just 27% (ten stocks, mostly from the energy sector like Occidental Petroleum (OXY) and Matador Resources (MTDR)) of the current basket were among the holdings in August.
Turning to the sector mix, its portfolio is now grossly overweight energy, with ~55.8% of the net assets allocated, a 4.5x increase since August. Healthcare, the top sector with over 29% weight as of my previous article, now has just around 15%.
It could be explained easily why exposure to energy has changed so markedly. Oil & gas prices have been on a tear, contributing to energy stocks’ momentum while also bolstering their growth outlook. To corroborate, the median forward revenue growth rate for FFTY’s energy investments is an astounding 32.3%, with the same rate for all 50 holdings at around 31%; a weighted average is a phenomenal 41.3%. The median forward EBITDA median growth rate (excluding three stocks with no data) is ~48.7%, as per my calculations.
Yet when the energy stocks (primarily those most leveraged to the petroleum prices, namely exploration & production and OFSE) were soaring, for instance, in March, as we know from the investor guide, FFTY was overweight IT (26.24%), perhaps the most embattled GICS sector this year owing to rich growth premia inherent to tech names. It also had more than 20% allocation to the tech sector as of August 3.
And this is a nuance investors should review carefully. Even despite a multi-step, convoluted strategy, FFTY is frequently late to the party. Another way of saying, it has missed the energy rally this year, yet bore the brunt of the tech sell-off.
Next, I believe making a few remarks on valuation would be pertinent. For example, since we have net earnings (or loss) data for all the holdings, we can arrive at the portfolio’s earnings yield by dividing the sum of net profits by the sum of market capitalizations. The result here is around 8.3% or a P/E ratio of 12x; the S&P 500 ETF’s website shows a 19.1x figure.
Both cash flow and debt-adjusted earnings yields are less of an option as there are three financial companies in this mix, however, we can exclude them. With them removed, the DA earnings yield is approximately 13.4%; the cash flow yield stands at 12.4%. This is a solid level I consider value territory. Besides, this chimes well with ~39.5% of the portfolio having at least a B- Quant Valuation grade, about 2% higher than in August.
Yet please do not expect me to upgrade FFTY to a Buy on the account of this alone due to one prosaic reason. Unfortunately, since FFTY does not pursue homogeneity and stability, instead trying to catch up with the momentum (not always successfully, though), the results of this analysis could totally lose relevance in a week in case the portfolio sees deep recalibration once again. Moreover, the seemingly rich yields are the likely consequence of the fund rotating to energy stocks, those with traditionally modest valuations. For instance, even after a wild one-year run with a price return of over 79%, Exxon Mobil (XOM), the supermajor and FFTY’s holding with a ~3% weight, is trading with the DA earnings yield of about 16.7% and with the forward figure at 22.6%.
Conclusion
FFTY is an extremely high-turnover, expensive ETF with poor risk dispersion owing to the high-conviction strategy with holdings limited to just 50 names. It has grossly underperformed IVV and QQQ this year, with other periods also being barely supportive of a bullish view. Interestingly, as I have already touched upon in the previous article, FFTY was strangely incapable of beating the market and the tech bellwethers of QQQ in 2020, when the zeitgeist favoring high-growth momentum plays was almost perfect. And amid prolonged volatility and shifting tides of investor sentiment in 2022, its strategy has also been incapable of capturing winners and steering clear of losers when necessary. Overall, its CAGR delivered during the May 2015 – October 2022 period is 1.36% vs. IVV’s 10.63%.
Its strategy is labyrinthine and rich with nuances, yet underdelivering. What I appreciate is that FFTY mixes the profitability factor (i.e., via Return on Equity) with growth, an alluring combination, yet again this does not translate into steady, consistent alpha.
At 80 bps, fees are on the expensive side even with the contractual fee waiver taken into account. This is totally justified for a fund with such a high turnover and nuanced methodology, though the past performance shows investors were not consistently rewarded with alpha despite such a hefty fee. All in all, I would not say FFTY deserves an upgrade today, so the conservative Hold rating is maintained.
Be the first to comment