

JimVallee
The market is living and dying by the Fed’s words and actions right now. Late September is an interesting period as it lies in an awkward stretch after important August economic data point releases and before crucial corporate profit numbers begin to roll in starting with JPMorgan Chase (JPM) on Oct. 14.
Historically, this quiet time data-wise has been a chance for the bears to really roar.
According to data from Bank of America Global Research, the final 10 trading days of September are just about the worst days on the calendar to be long U.S. large-cap stocks.
In aggregate since 1928, the S&P 500 has been positive just 40% of the time with an average return of –1.04% in this stretch. The range of outcomes is wide from –17.9% to +7.2%. This past Monday was 2022’s first day of that dangerous period.
Fasten Your Seatbelts: A Turbulent 10 Days
BofA Global Research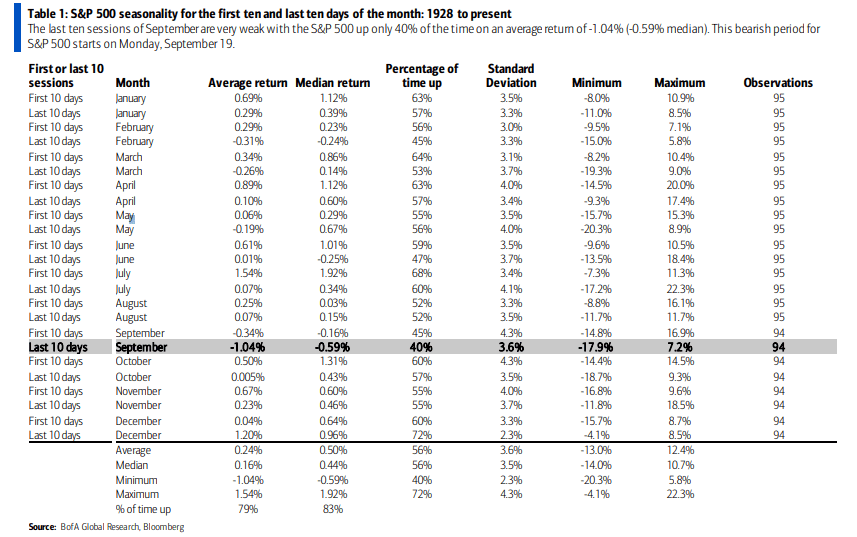
Meanwhile, price action continues to be weak.
The iShares Russell 1000 ETF (NYSEARCA:IWB) printed a bullish engulfing candlestick pattern to kick off the week, but that came on the heels of a bearish weekly engulfing candle. Technicians generally believe that weekly moves have more weight than daily gyrations.
The broad gauge of the large-cap domestic equity market remains more than 8% below its falling 200-day moving average after an 11% drubbing from its mid-August peak.
IWB: Stocks Continue To Trend Lower, Eyeing June’s Low?
Stockcharts.com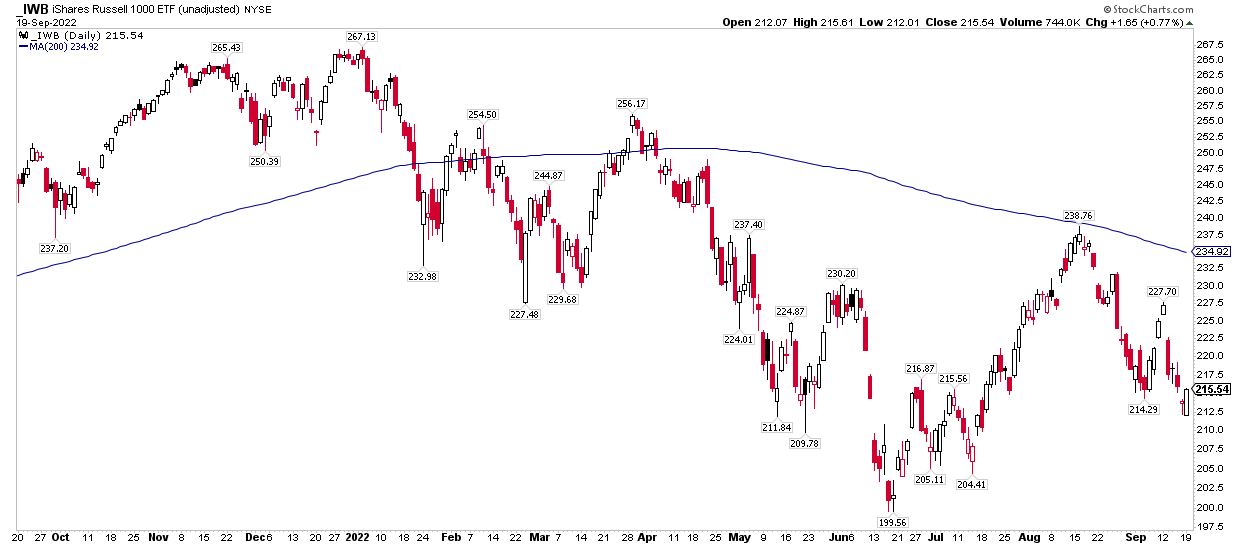
With a poor part of the calendar underway, a retest of the June lows is definitely on the table. Watch the $200 to $205 range on IWB for support. If we break below that, then I see next support in the $178 to $188 area.
Finding the Next Layer of Support
Stockcharts.com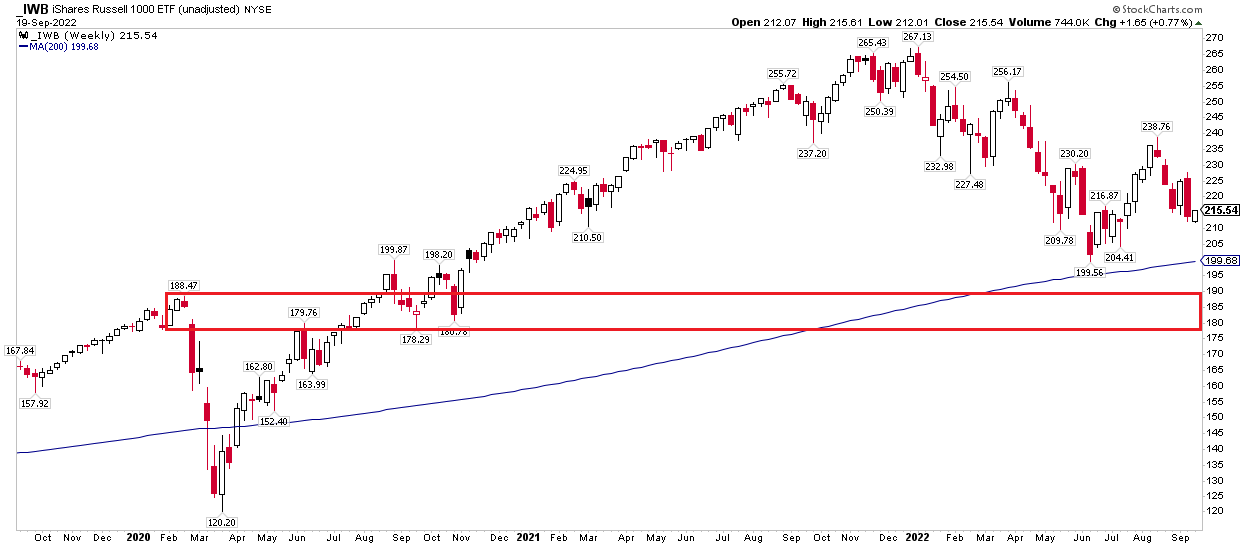
With bearish-tinted glasses donned, traders now turn their eyes to the Fed. Wednesday’s FOMC announcement is now widely expected to feature a 0.75 percentage point interest rate increase – a third consecutive hike of that amount. We cannot rule out a full 1% upward move, but traders have priced in just an 18% chance of that happening.
A Three-Quarter Point Rate Increase Anticipated
CME Group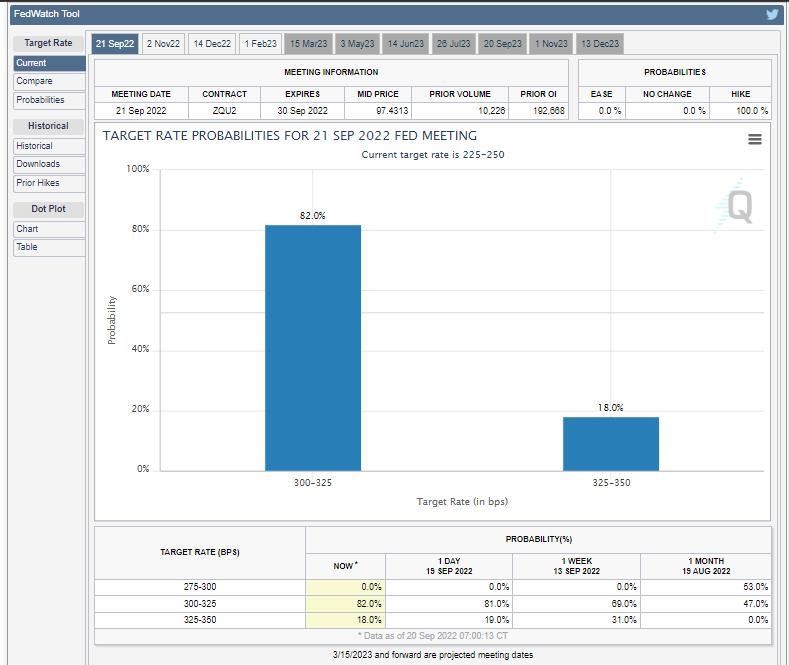
I assert that it’s not so much the policy rate change announced Wednesday at 2 pm ET, but rather where the market sees the Fed’s terminal rate going.
Consider that there have been seismic moves in the March 2023 Implied Fed Funds rate futures. Back in late July, the market had discounted a paltry 3.2% high in the Fed’s policy rate for early next year. Following hot July and August employment reports and a shocking August core CPI print, though, the terminal rate has surged to 4.5%, according to Bloomberg.
The Terminal Rate Seen Spiking to 4.5% in the First Half of 2022
Bloomberg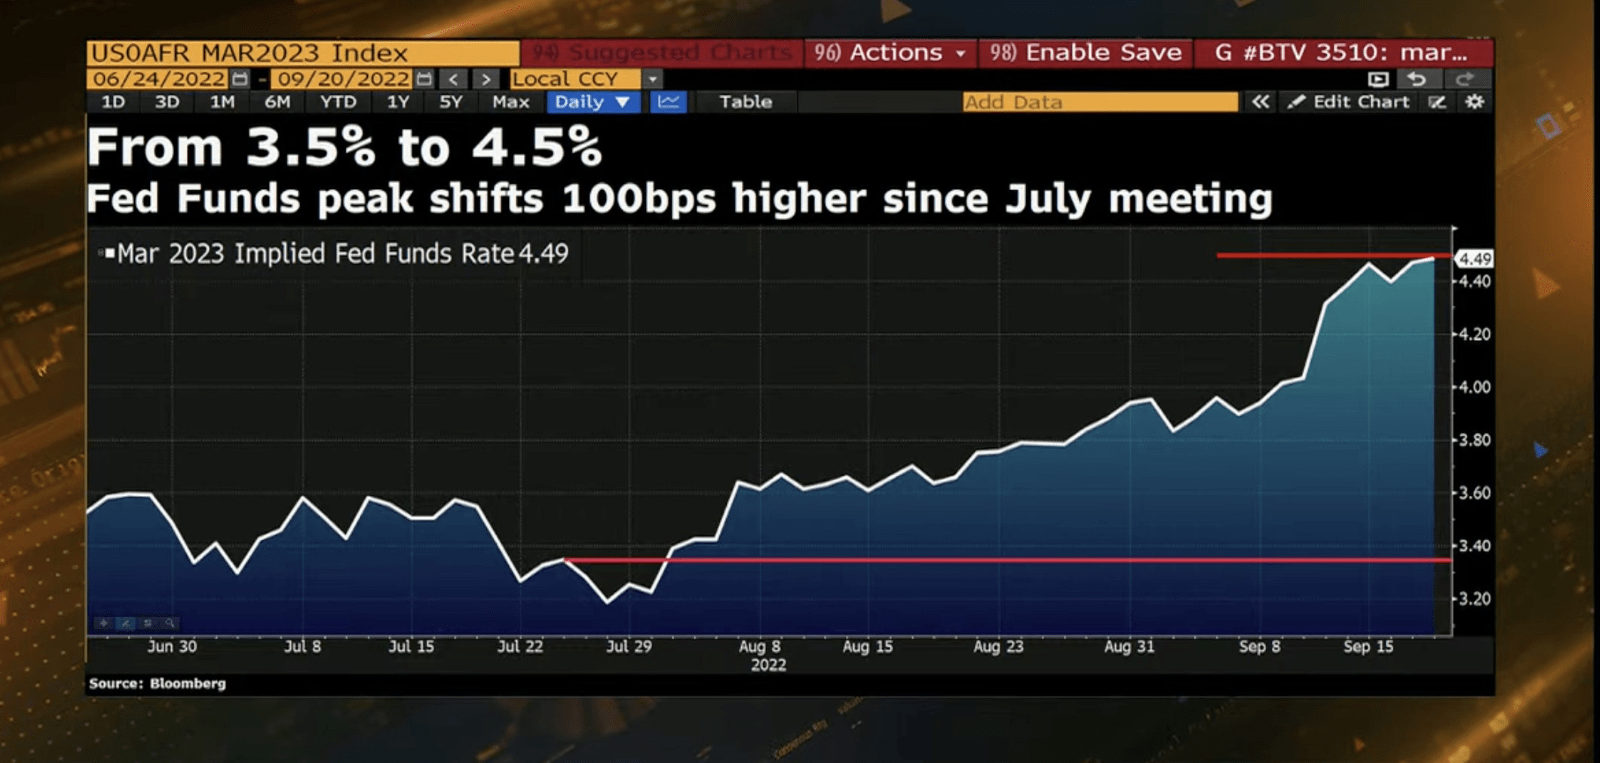
So the market has done much of the Fed’s dirty work for them already by way of higher short-term rates.
If you have stepped foot into finance-Twitter over the last few days, there’s no doubt you have seen post after post about how high the 1-year Treasury rate is. At 4%+, it is indeed the highest since Oct. 2007.
One-Year Treasury Rate Surges
Macro Charts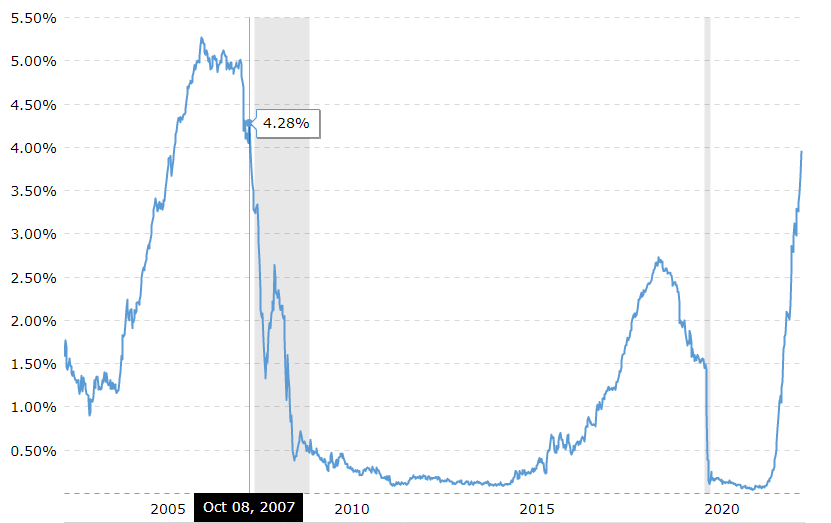
Chair Powell loves to see this kind of selling in the Treasury market.
It shows that investors are finally accepting his ‘painful’ message. Perhaps the biggest punch in the face is to first-time homebuyers. With mortgage rates soaring to fresh 14-year highs above 6.4% for a conventional 30-year fixed rate loan, housing affordability is dreadful.
Consider that the typical monthly mortgage payment is now above $2,000, on average, across the U.S. That’s more than triple the low from late 2012, according to Bloomberg.
The Cost to Own a Home Skyrockets
Bloomberg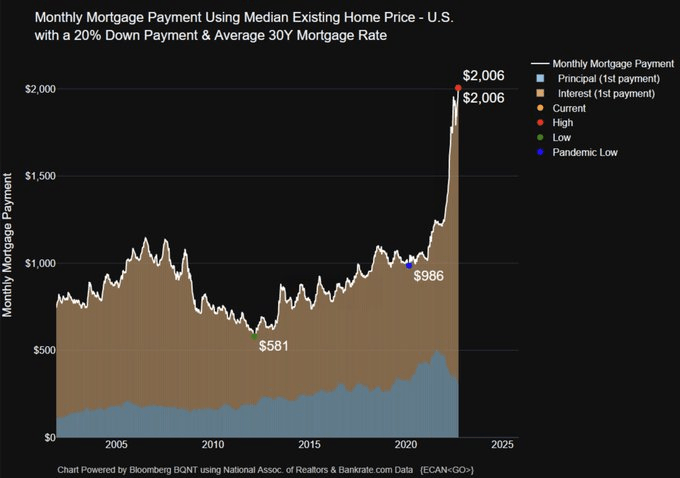
More broadly, financial conditions have indeed tightened.
The four primary measures of the Financial Conditions Index are the U.S. dollar, corporate bond yields, stock market performance, and interest rates. According to Goldman Sachs, the gauge of how tight markets are has risen above the June highs – much to the delight of the FOMC.
Financial Conditions Tighten Further
Goldman Sachs Investment Research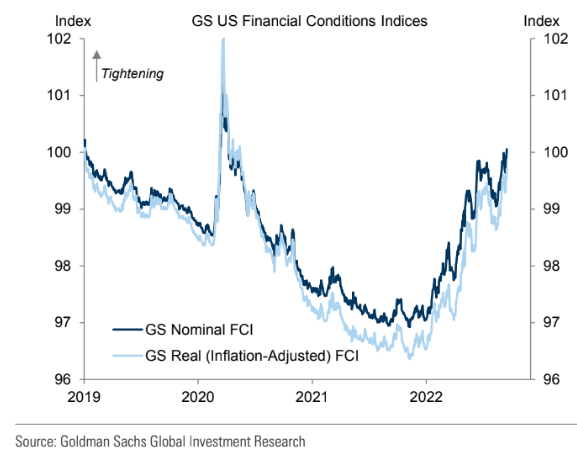
The Bottom Line
I expect a 75 bp rate hike Wednesday afternoon, like most other market-watchers and traders.
Large-cap U.S. stocks have trended lower over the last five weeks as hope for a soft landing gave way to the reality of interest rates that will be ‘higher for longer.’
A retest of the June lows could be in-play ahead of what is often a rocky stretch from late September through parts of October during midterm election years. Be ready to dip your toes into the uncertain equity market waters, though. The fourth quarter of a midterm year is one of the best times to get long.
Be the first to comment