

unculturedswine/iStock via Getty Images
It’s been just over a month since I sold my Union Pacific Corporation (NYSE:UNP) shares, and in that time, the stock is down about 8.85% against a loss of 7.77% for the S&P 500. Now, I don’t want to brag, but if you review my calls on this name in the article cited above, you’ll see a little green dot where I became bullish in mid June, rode the stock higher for two months, then put out a cautionary note in mid August. The shares are now down nicely in price. I want to just take a moment to mull that performance over, as I try to drive that pesky little voice in my head that’s yammering something or other about “pride goeth before the fall” or whatever. Anyway, I obviously like this business at the right price, so it’s time to determine whether or not the price is right enough to buy shares again. I’ll make that determination by looking at the relationship between traffic and the stock valuation. If the market is currently acknowledging the fact that traffic remains at pre-pandemic levels via reduced valuations, I’ll buy. Finally, I wrote some puts that expired in August, and I’m absolutely champing at the bit to write about those.
Welcome to the “thesis statement” paragraph. I put this paragraph together in each of my articles for those people who want a bit more than the title and the bullet points, but far less “Doyle mojo.” I’ve already bragged once in this article, and I can understand how tiresome it is to read such things, so I create a thesis statement to insulate you against such nonsense. I am secure in the knowledge that my legions of fans are grateful for my rhetorical largesse. I’m of the view that Union Pacific is not yet in the “buy zone.” The valuation today is identical to what it was exactly two years ago, when traffic was higher. Although the gap between 2019 and 2022 is narrowing, a long position in this stock right now would be a bet on continued relative improvement in traffic, and I think that’s a heavy lift given the current state of the global economy. I’ve done well with short puts here, and I think they represent the best risk adjusted returns. Specifically, I’ll be selling the January 2023 puts with a strike of $190, as I consider these to be a “win-win” trade. Thus ends my thesis statement, and if you read on from here, that’s on you. Any nausea you experience from reading my subtle or overt self congratulation is entirely your fault.
Traffic Update
Much has recently been made of the fact that FedEx (FDX) traffic has cratered recently. One of the implications of this is that it may very well be that the global economy is much weaker than what many suppose. I hope I don’t come off as too churlish, but I’ve been writing about falling traffic at the Class 1 rails for a while now. That’s a lie. I actually don’t care if I come off as churlish or not. Anyway, I thought it’d be interesting to revisit Union Pacific’s traffic patterns and compare those to the current valuation. I want to explore the interplay between recent traffic patterns and valuations. In particular, I want to try to understand if the market is paying more or less for a network that is moving more or less traffic than it had in the past.
I’ve recreated the most recent AAR traffic report for your enjoyment and edification, below, and I think it reveals some interesting things, some of which you can pull out to enliven the conversation at your next cocktail party.
Highlights of the Comparison
-
Motor vehicles have recovered well from last year, but still remain ~18% below the pre-pandemic period.
-
Intermodal traffic is lower now than it was in last year and the pre-pandemic period.
-
The network has transported fewer petroleum carloads so far in 2022 when compared to both 2021 and 2019.
-
Overall, there were about 1.7% more carloads on the system in 2022 as compared to 2021, but the network has not yet recovered to 2019 levels. Specifically, there were 2.7% fewer carloads moved on the system as of Week 37, 2022 as compared to 2019.
-
To be fair, things look better now than they did when I last reviewed this story way back in Week 32. Specifically, Week 32 traffic was fully 6.4% lower than it was in 2019.
If none of those talking points will make you the life of the party, then I don’t know what kind of people you’re hanging out with. Anyway, in my view, the general conclusion is pretty clear, namely that traffic has recovered nicely from 2021, but is still not back to pre-pandemic levels. I’d need to see this reality reflected in the stock price before I get too excited about buying back in.
Union Pacific Traffic to Week 37 (Union Pacific investor relations)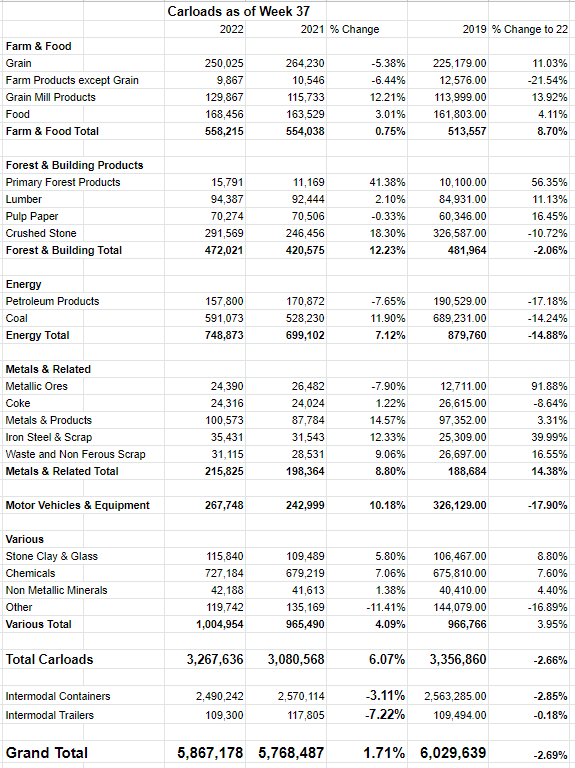
The Stock
If you read my stuff regularly you know what time it is. It’s the time where I turn into a bit of a financial “mall cop”, where I remind everyone that a company is distinct from its stock. The company buys inputs like fuel, hopefully happy labor, adds value to those, and then sells transportation services at a profit. The stock, on the other hand, is a piece of paper that gets traded around in a public market and is influenced by a great many factors, many of which are only peripherally related to the underlying business. For instance, the stock price is certainly impacted by the company’s recent financial performance. It’s also impacted by the crowd’s ever-changing views about the company’s future financial performance. It may be influenced by a number of investors who insist on hanging on to this stock in particular at any valuation because of the gargantuan moat. It’s also potentially impacted by the changing moods of an influential analyst. Finally, the stock is influenced by the crowd’s ever-changing perspectives on the relative merits of “stocks” as an asset class. To use this stock as an example, the S&P 500, which is admittedly a very concentrated index, lost 7.77% of its value during the time the stock lost 8.85% of its value. It’s impossible to prove this definitively, but I think it’s reasonable to suggest that part of the loss Union Pacific shareholders have suffered in such a short time is a function of the softness in the overall market. For all of these reasons, the stock is a much more volatile thing than the underlying business. While this is tiresome, it is potentially profitable. If we can spot the discrepancies between the crowd’s take on a given business, and the assumptions embedded in the price, we can earn a profit. Not to go on about it too much, but I’ve used this approach to successfully trade this name among others.
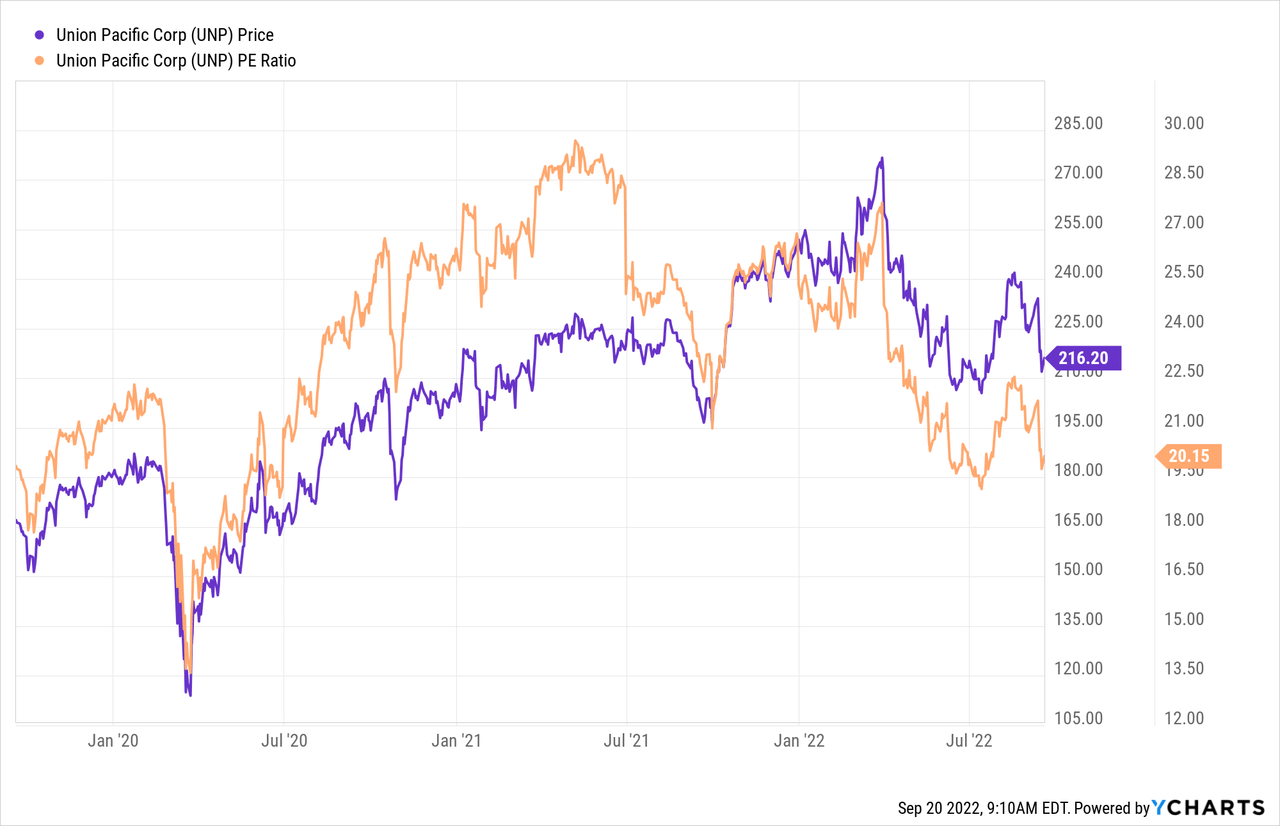
I’ll relieve you of my sermonizing by making one final point. I’ve found that cheaper stocks offer a higher risk-adjusted return, so I like to buy shares when I consider them to be cheap and eschew them when they get expensive. If you’re one of my regular reader/victims you know that I measure the cheapness (or not) of a stock in a few ways, ranging from the simple to the more complex. On the simple side, I look at the ratio of price to some measure of economic value like sales, earnings, free cash flow, and the like. Ideally, I want to see a stock trading at a discount to both its own history and the overall market. In this case I want to compare the current valuation with what it was back in 2019. After all, if the market is paying more for less traffic, that’s potentially troublesome in my view. In my previous missive, I took profits because the price to earnings ratio hit 22.5. Note that I got excited this past June when the shares hit a PE of 20. Fast forward to the present, and the chart below shows the state of the world. Coincidentally enough, the valuation is virtually identical today to what it was in 2019. Traffic was higher in week 37 of 2019 as we’ve already seen. So, to my way of thinking the valuation is slightly worse now than it was then. Admittedly, traffic is improving and the gap between 2019 and 2022 is narrowing, but to my mind, buying today is a bet on the continuation of that trend. That may be a stretch given some of the signs of economic weakness.
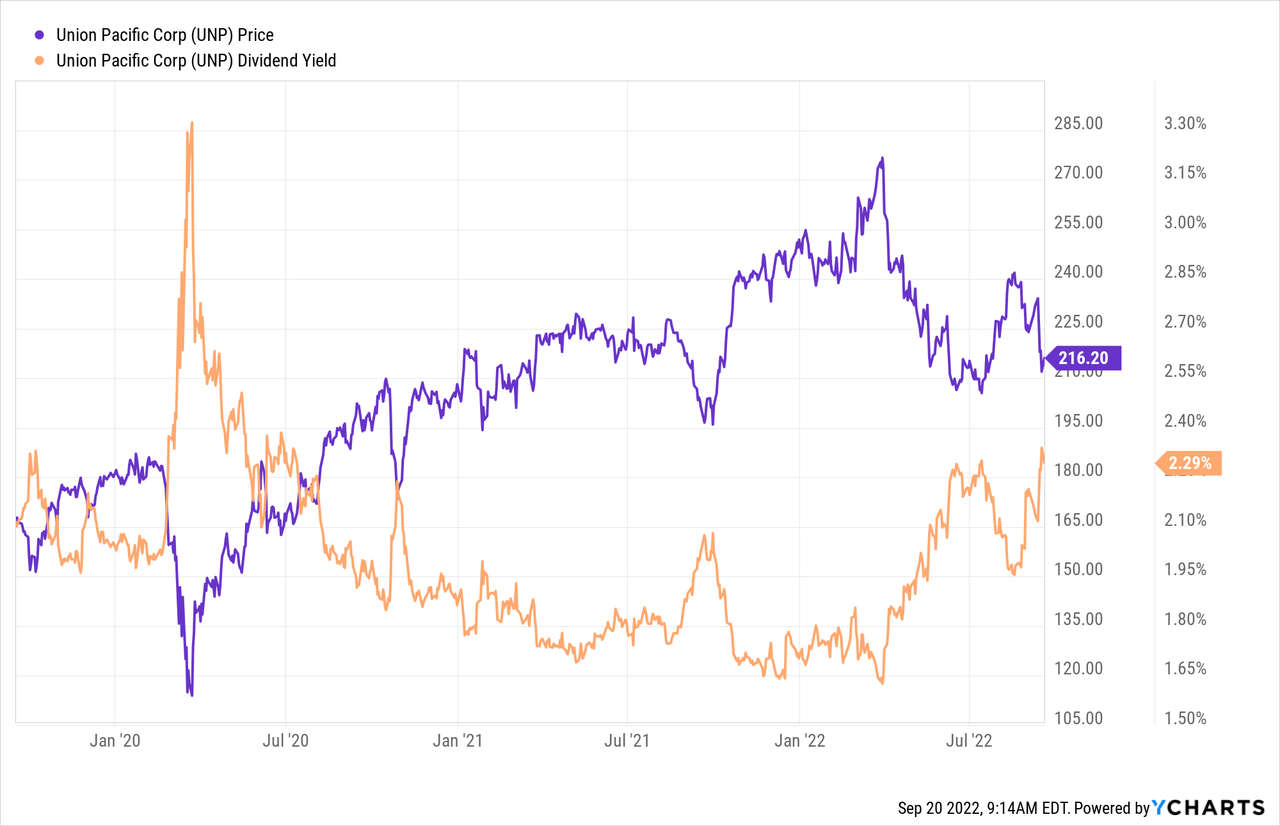
Admittedly, investors are collecting a slightly higher dividend yield than they were exactly two years ago. It’s not particularly rich in my estimation, but it’s something.
Options Update
In my previous article on Union Pacific, I made much of the fact that the August Union Pacific puts were about to expire worthless. Additionally, the January 2023 puts with a strike of $175 which I had sold for $5.85 were at the time trading for $1.55-$1.70. Since the stock has dropped in price, these are now priced $2.90-$3.90. I’m still short an irresponsible number of these because I’d be very happy to buy this name at $175. This trade, among many others, reveals the risk reducing, yield enhancing potential of these wonderful instruments. With that in mind, I recommend selling some more puts today. In particular, I’m a fan of the January 2023 Union Pacific puts with a strike of $190 which are currently bid at $5.40. I like these because I’m a fan of making a 2.84% yield four months. If the shares remain above that price, the investor will simply claim the premia, which isn’t a hardship. If the shares fall below $190, the investor will be obliged to buy at a net price of ~$184.60. Holding all else constant, this lines up with a dividend yield of 2.68% and a PE of 17.2. That is an excellent entry point, and I’d be happy to be “forced” to buy at that price. This is why I characterize these short puts as “win-win” trades. The outcome is positive no matter what happens.
It’s time, once again, to write about risk. It’s all well and good for a stranger on the internet to write about “win-win” trades, but if you’re going to trade these, you need to be made aware of the fact that this investment, like all investments, comes with risk. I consider the risks associated with these instruments to fall into two broad categories: the economic and the emotional.
Starting with the economic risks, I’d say that the short puts I advocate are a small subset of the total number of put options out there. I’m only ever willing to sell puts on companies I’d be willing to buy, and at prices I’d be willing to pay. So, I would never advocate that people simply sell puts either “willy” or “nilly” with the highest premia. In my view, that strategy would lead to disastrous results. So my first bit of advice is to only ever sell puts on companies you want to own at (strike) prices you’d be willing to pay. Take my word on this one, as it’s informed by painful history.
The two other risks associated with my short puts strategy are both emotional in nature. The first involves the emotional pain some people feel from missing out on upside. To use this trade as an example, let’s assume that Union Pacific stock price goes parabolic and hits $250 per share between now and the third Friday of next January. Obviously my puts will expire worthless, which is a great outcome in some ways. I will not catch any of the upside in the stock price, though. So, short put returns are capped by the premium received. This may be emotionally painful, but my attitude is that if the shares are too expensive at $215, they’d likely be destined for a fall at $250, so no harm, no foul.
Secondly, it can be emotionally painful when the shares crash below your strike price. So far, whenever this has happened to me, things have worked out well over the long term, because I insist on only ever writing puts at “screaming buy” strike prices. That said, it has been emotionally stressful in the short term on occasion. If you’re going to sell puts, please be aware of this phenomenon.
If you understand these risks, and can tolerate them, I would recommend that you sell puts. For my part, I’m going to replace the puts that expired last month with this new crop of $190s, while I remain short the $175s. If you’re comfortable with selling puts, I think they offer the best risk adjusted returns at this point.
Be the first to comment