

We Are
Author’s note: This article was released to CEF/ETF Income Laboratory members on August 17th, 2022.
Looking through a screener of the best-performing ETFs of the year, the First Trust Morningstar Dividend Leaders Index ETF (NYSEARCA:FDL) caught my eye. FDL is up almost 2% YTD, versus losses of around 17% for the S&P 500, and losses of more than 25% for the Nasdaq-100. It is one of the best-performing ETFs in the market today, and the best-performing dividend ETF in the same. FDL also yields 3.4%, an above-average, if not fantastic, yield. FDL seemed like a worthwhile investment opportunity, so thought to have a closer look at the fund.
FDL is a U.S. dividend equity index ETF, with an overweight energy position. Said position has led to significant outperformance during the past twelve months, but slightly underperformance since inception. FDL’s recent outperformance and above-average yield are important positives, but the long-term performance track-record is about average, at best, and there are several small issues with the fund’s underlying index. These are not significant negatives, but they do contextualize the fund’s recent outstanding performance. FDL is one of the best performing ETFs of the year, but only a reasonable investment opportunity, and nothing special.
FDL – Basics
- Investment Manager: First Trust
- Dividend Yield: 3.41%
- Expense Ratio: 0.45%
- Total Returns CAGR (Inception): 7.58%
FDL – Overview
FDL is a U.S. dividend equity index ETF. It tracks the Morningstar Dividend Leaders Index, which includes the 100 highest-yielding U.S. equities with a history of consistent dividend payments. Companies with negative expected earnings growth, or with unsustainable / uncovered dividends are explicitly excluded from the index. Some specific index rules are proprietary, which somewhat complicates analyzing the fund.
Weights are based upon the dollar value of expected dividend payments, a broadly inappropriate weighting scheme, in my opinion at least. Said weighting scheme privileges companies with large share prices / small number of shares outstanding, and vice versa. Share prices are, by themselves, indicative of very little, and strongly influenced by factors which do not materially impact a stock’s expected returns, risks, and other characteristics. If Berkshire Hathaway (BRK.A) ever decides to pay a dividend, it would be the index’s largest holding, because BRK.A trades at a $439,528 per share, and Buffett is too stubborn to do a split. This is not a reasonable weighting scheme, in my opinion at least. As with many indexes, there are security caps meant to ensure a modicum of diversification, so a dividend-paying Berkshire would not swallow up the entire fund.
In general terms, FDL’s underlying index is slightly inferior to that of the average dividend-focused U.S. equity ETF. Most of FDL’s peers have more appropriate weighting rules, and are completely transparent about their index. These are relatively small issues, but still somewhat negative for FDL.
FDL is a reasonably well-diversified fund, with exposure to 100 U.S. equities from all relevant industry segments. As most dividend-focused ETFs, the fund is overweight old-economy industries, including energy, financials, and consumer staples. Companies in these industries are generally old enough to have a history of consistent dividend payments, and generate sufficient cash-flow to pay above-average dividend yields. On the flipside, FDL is somewhat underweight tech, as said industry is not well-known for strong yields or consistent dividend payments.
FDL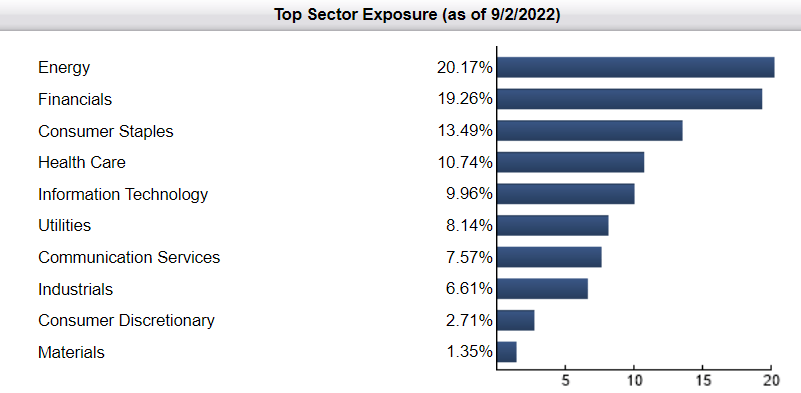
FDL’s energy exposure is quite a bit larger than that of its peers, with a 20% allocation. It is unclear to me why the fund is so overweight said industry, as none of the index inclusion / weight criteria seems to fit. It could be the intersection of several criteria, or due to the proprietary index criteria. In any case, the fund’s significant energy exposure is notable.
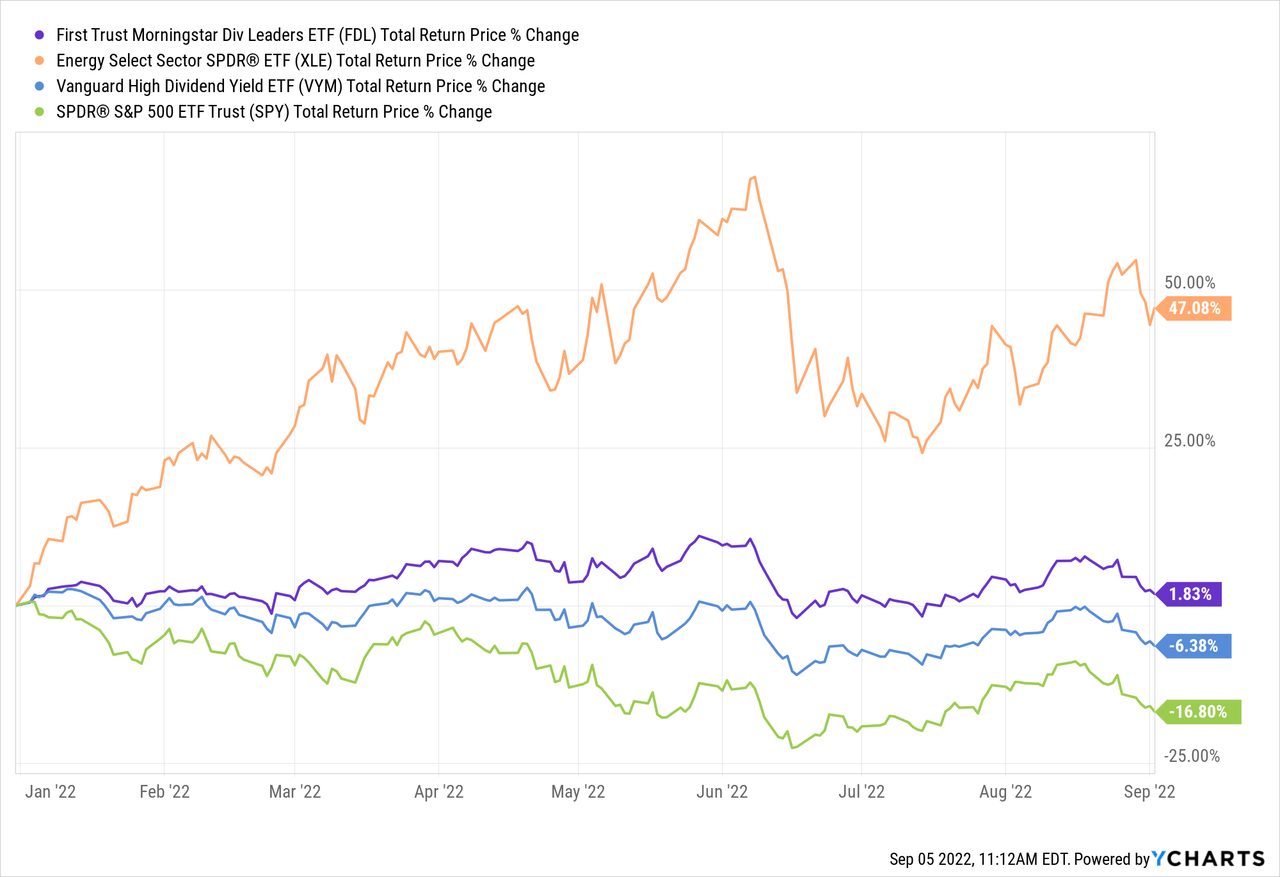
FDL should outperform broad-based equity index funds and other dividend-focused funds when energy outperforms, as has been the case YTD.
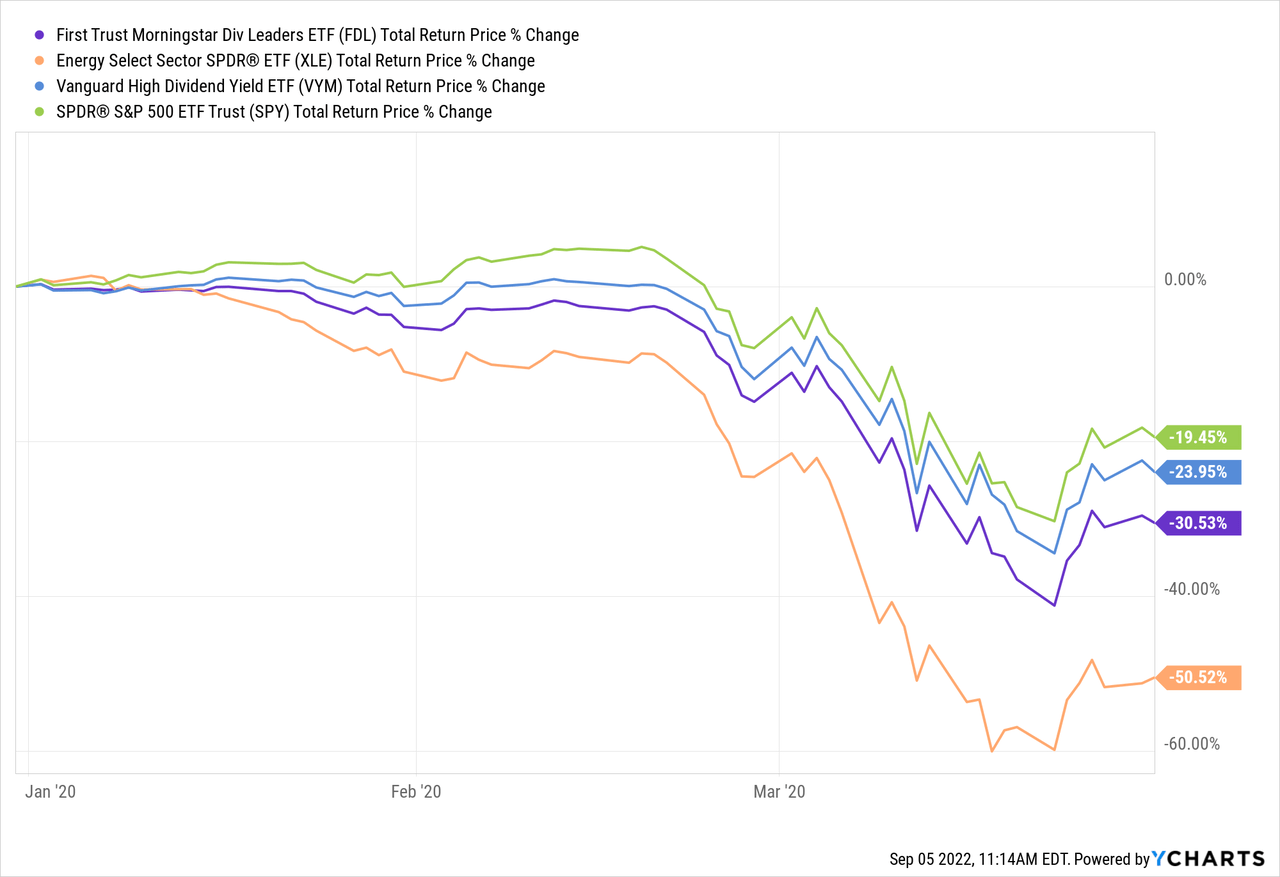
On the flipside, the fund should underperform when energy underperforms, as was the case during 1Q2020, the onset of the coronavirus pandemic.
In my opinion, FDL’s overweight energy position is currently a positive, as said industry is seeing strong earnings growth and trades with a comparatively cheap valuation. Energy is poised to outperform, in my opinion at least. Energy bears, or investors wishing to minimize their energy exposure, might wish to avoid FDL, however.
FDL’s larger holdings tend to be large-cap U.S. equities with sizable dividend payments, common for dividend-focused funds. FDL’s larger holdings include Exxon (XOM), AbbVie (ABBV), Verizon (VZ), and Philip Morris (PM), all well-known companies, and dividend investor favorites. In my opinion, FDL’s holdings are perfect for dividend investors, with the caveat that these are (mostly) not particularly high-yielding stocks. Dividends are good, but not fantastic.
FDL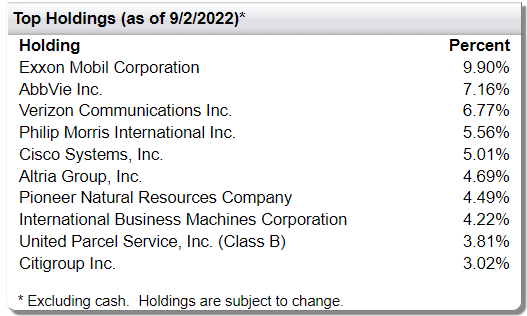
FDL – Dividend Analysis
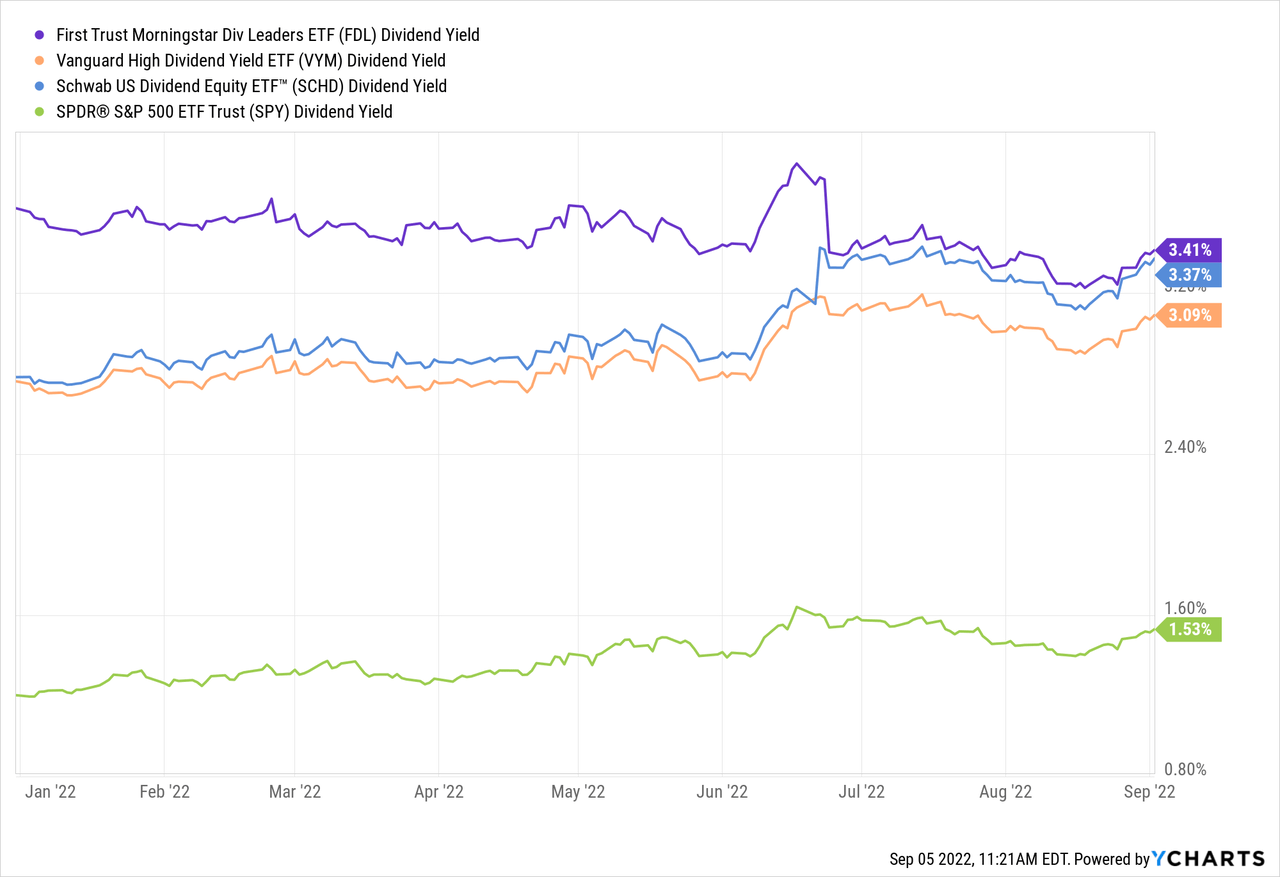
FDL focuses on stocks with above-average yields, boosting the fund’s dividend yield to 3.4%. It is a reasonably good yield, moderately higher than the equity average, and a tiny bit higher than average for a dividend-focused ETF.
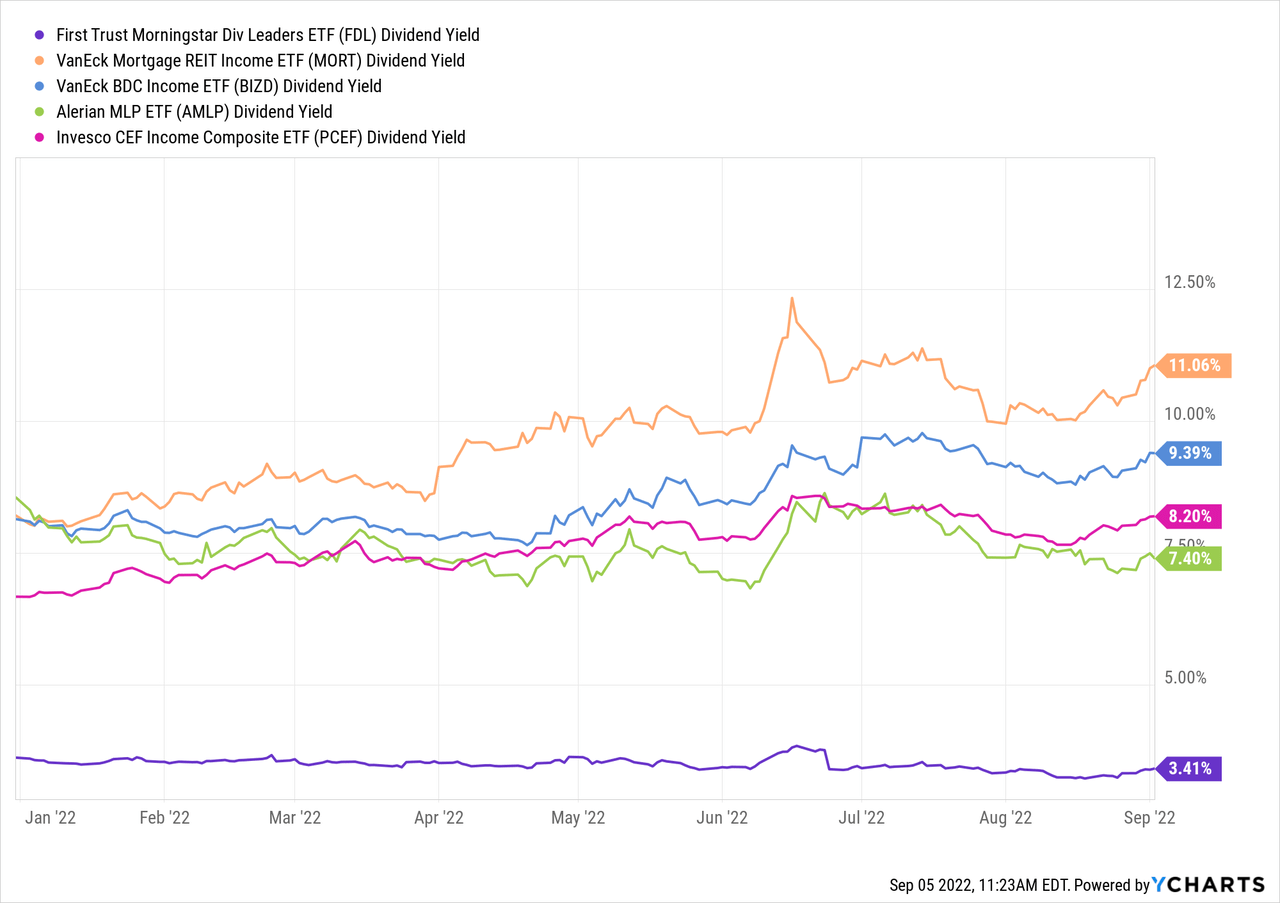
On a more negative note, FDL’s yield is not particularly high on an absolute basis, and it is significantly lower than that of the highest yielding asset classes, including mREITs, BDCs, MLPs, and CEFs. As such, investors looking for the highest yields should probably consider other funds.
FDL’s dividends have seen strong growth since inception, with one caveat. The fund’s 4Q2021 was abnormally large, while the two most recent dividend payments have been moderately lower than average, resulting in negative dividend growth for the past year. ETF dividends are quite volatile, so situations like this are somewhat common, and usually simply the result of volatility. I do not consider the fund’s recent negative dividend growth to be an actual dividend cut, just volatility. Still, investors do need to be aware that fund dividends are volatile, and something of a negative.
SeekingAlpha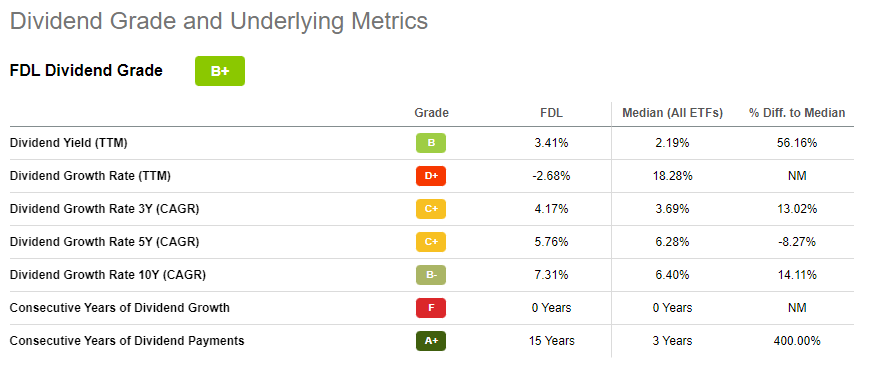
FDL – Performance Analysis
FDL’s performance track-record is average, at best. The fund has slightly underperformed since inception, due to consistent, long-term energy underperformance. The fund has significantly outperformed during the past year, due to significant energy outperformance. FDL’s overweight energy position is the fund’s key differentiator, and responsible for most of the fund’s over-performance and underperformance.
ETF.com – Chart by Author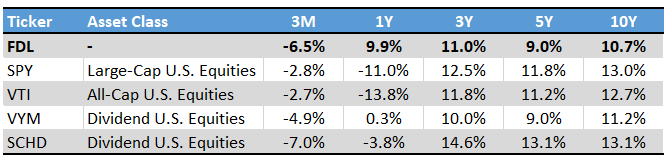
FDL – Valuation Analysis
FDL focuses on old-economy industries and companies, most of which trade with discount valuations relative to broader equity indexes. FDL itself sports a PE ratio of 12.4x and a PB ratio of 2.2x. Both figures are moderately lower than average for an equity fund, but only slightly lower than other dividend-focused funds.
Fund Filings – Chart by Author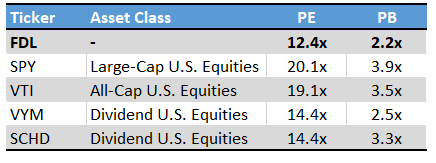
FDL’s comparatively cheap valuation is a benefit for the fund and its shareholders.
Conclusion
FDL is a U.S. dividend equity index ETF with an overweight energy position. The fund is a reasonable investment opportunity, but does materially differ from its dividend-focused peers in most metrics, besides the aforementioned energy position. It is a reasonable investment opportunity, but investors could duplicate the fund’s advantages by boosting energy fund allocations in their own portfolios.
Be the first to comment