

Editor’s note: Seeking Alpha is proud to welcome ZH Advisors as a new contributor. It’s easy to become a Seeking Alpha contributor and earn money for your best investment ideas. Active contributors also get free access to SA Premium. Click here to find out more »

naphtalina/iStock via Getty Images
Investment Thesis
FactSet Research Systems Inc.’s (NYSE:FDS) key business segments are well-positioned to achieve consistent organic growth due to fundamental secular drivers. Growth in private capital, wealth management, corporate investment, as well as the demand for financial analytics (as market volatility increases) are all upside catalysts supporting FDS’s revenue outlook. Furthermore, FDS can expand its operating margin by adopting a hybrid work arrangement, effectively managing third-party data cost, and successfully integrating Cusip Global Services (CGS) into its existing product offerings. FDS’s operating performance has shown resilience through both the 2008 and 2020 market downturns. Because the company has a healthy credit profile, and increased volatility benefits spending on trading & portfolio analytics, FDS will be less affected by a potential recessionary environment. Following Q3 2022 earnings surprise, we updated our FDS model and arrived at a $405.04 intrinsic value, slightly above the current stock price of $392.5. We assign a moderate buy (which is the equivalent of a Hold per Seeking Alpha’s rating nomenclature) for FDS.
|
Implied Share Price |
$405.04 |
|
Implied 1Yr Target Price |
$431.50 |
Revenue Growth Analysis by Business Segments
FDS is one of the largest global financial data and analytics providers. The three main workflow solutions are 1. Research & Advisory, which enables both buy and sell side clients to management research content, 2. Trading & Analytics, which provide portfolio management, analytics, and trade executions to institutional asset managers, 3. Content & Technology Services, which sells fundamental and alternative data via APIs and other infrastructures. We project a 9% revenue compounded annual growth rate (CAGR) reaching $3B revenue at 2027 exit. To support our growth projection, we analyze each client type and product segment in detail.
Client Types
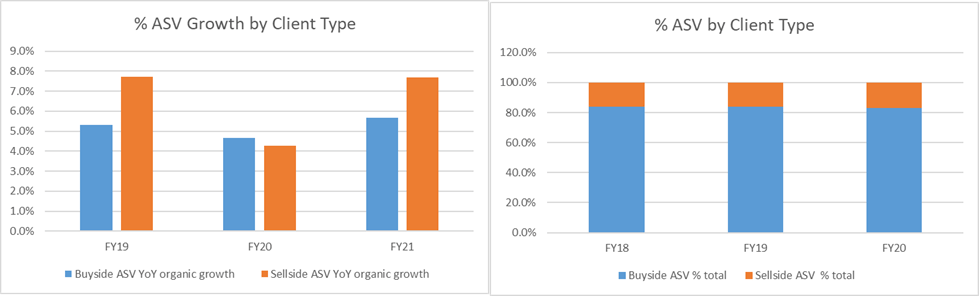
Buyside (84% of Annual Subscription Revenue (ASV) active fund flow typically benefits from increased volatility relative to passive strategies. With inflation at 8.6% and 5yr breakeven inflation at ~3%, we see considerable turmoil in the market going forward. This is an opportunity for FDS to onboard new active asset management clients. Due to the increased buyside activity driven by COVID related volatility, for instance, client count grew 21% and workstations grew 10% from 2020 to 2021, compared to 8% and 9% pre-pandemic. These numbers are even more notable considering that FDS has historically shown extremely high client retention (90% by count, improving to 92% 2022Q3, 95% by ASV). The implication is that, after market volatility drives client/workstation growth, the newly onboarded clients tend to stay on and continue to generate revenue.
A more granular approach to analyzing growth by revenue suggests that private markets, wealth, and corporate clients all have the potential to achieve mid-double-digit growth. FDS is an industry leader in offering portfolio analytics & reporting to traditional buyside customers (asset managers, hedge funds). We expect growth to be high single digit for those clients, slightly above the forecasted long-term trend of 5% for the industry. For private equity/credit and venture, the October 2021 Cobalt acquisition enables additional product offering and cross-selling opportunity. Overall, private capital has been growing at 14% CAGR from 2015 to 2021 and is expected to grow 15% until 2026. Driven by strong industry tailwind, we expect private market clients to provide 15% ASV growth for FDS from 2022 to 2027. Combined with traditional asset managers, buyside ASV should grow ~10%.
Although Sell-side (16% of ASV) revenue growth might be pressured due to the decrease in deal volume, we have not observed such slowdown even as 2022 YTD deal activities slowed. Sell-side ASV YoY grew at 13% as of Q3 2022 despite a -44% decrease in investment banking activity compared to previous year’s Investment Banking Scorecard. Nevertheless, an extended period of lower deal activity means less new clients, less recruiting, and lower growth in the segment. It remains to see how resilient FDS’s sell side revenue is, and we conservatively assumed that the segment would grow at a compounded 7% per annum. One mitigating factor to the potential slowdown is that sell side ASV is only a small portion of the overall value.
Company Filing, ZH Advisors
Products/Workflows
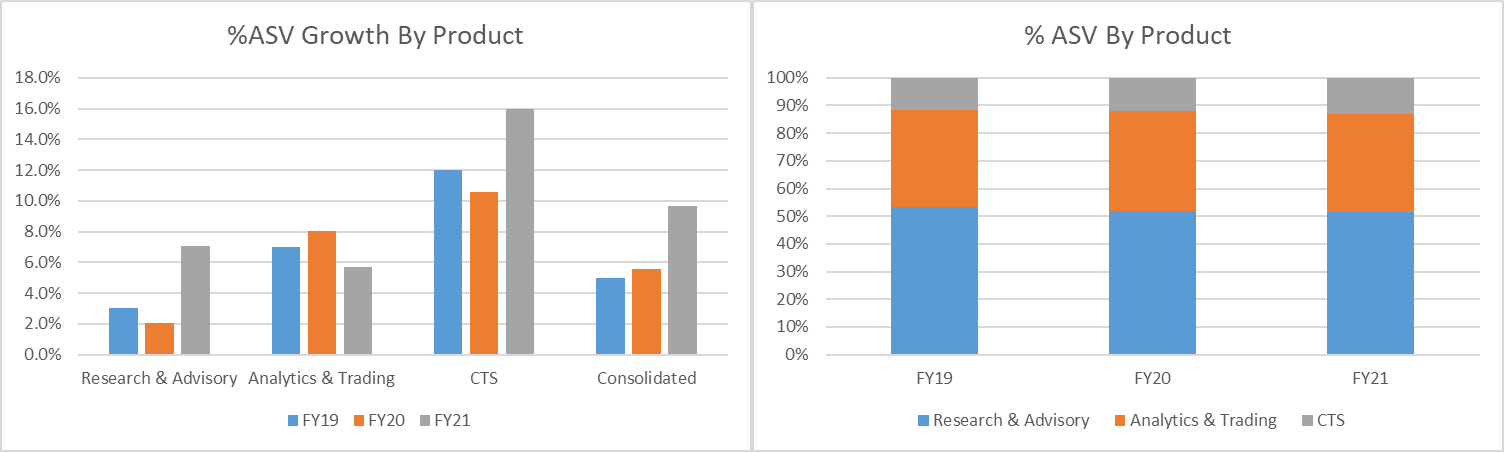
Research & Advisory + Analytics & Trading account for 76% of FDS’s annual subscription value, and both products may benefit from a period of increased volatility. Looking back at 2020-2022 vs prior to 2019, ASV in research & advisory grew at 7.1% (2020) and 8.0% (2021), a rise from <3% prior to COVID volatility. Similarly, Analytics & Trading ASV also has not been negatively affected through 2020-2021 (8% Year-Over-Year (YoY) FY 2021). Looking forward, we see a prolonged period of increased volatility in both fixed income and equities, and FDS’s strong portfolio analytics products will continue the strong growth trend that we’ve observed. Due to their strong resilience to volatile market conditions, research and trading products should provide strong support for ~9% organic ASV growth going forward.
Content & Technology Services (~14% ASV) should also benefit from a period of heightened volatility. The main power users of FDS’s fundamental and alternative data are institutional asset managers focused on quantitative strategies. In an report by JP Morgan and Integrity Research, it is estimated that asset managers spend ~$3B on alternative data, and such spending is forecast to increase by 20% going forward. FDS is not a share gainer in this segment, however, as there are frequently new entrants providing different sources of data. Nevertheless, in a volatile market, quantitative asset managers are encouraged to incorporate more alternative data, and FDS should be a beneficiary of this increase in spending. From 2019 to 2021, CTS has grown its ASV at low-to-mid double-digit, and we expect such a trend to continue into the future.
Although Wealth Management (included in Research & Advisory segment) accounts for only ~10% of FDS’s ASV, it is one of the fastest growing segments in finance and will continue to do so thanks to demographics shifts and digitalization. Wealth management is expected to grow at around 5-7% to a $73 trillion industry by 2025, as Millennials put more money under management. As FDS already provides professional investment management tools, it has tremendous operating leverage when it comes to providing new wealth products. We believe FDS will be a share gainer in the wealth segment and grow at 12-15% YoY over the forecasting period.
Company Filing, ZH Advisors
Geography
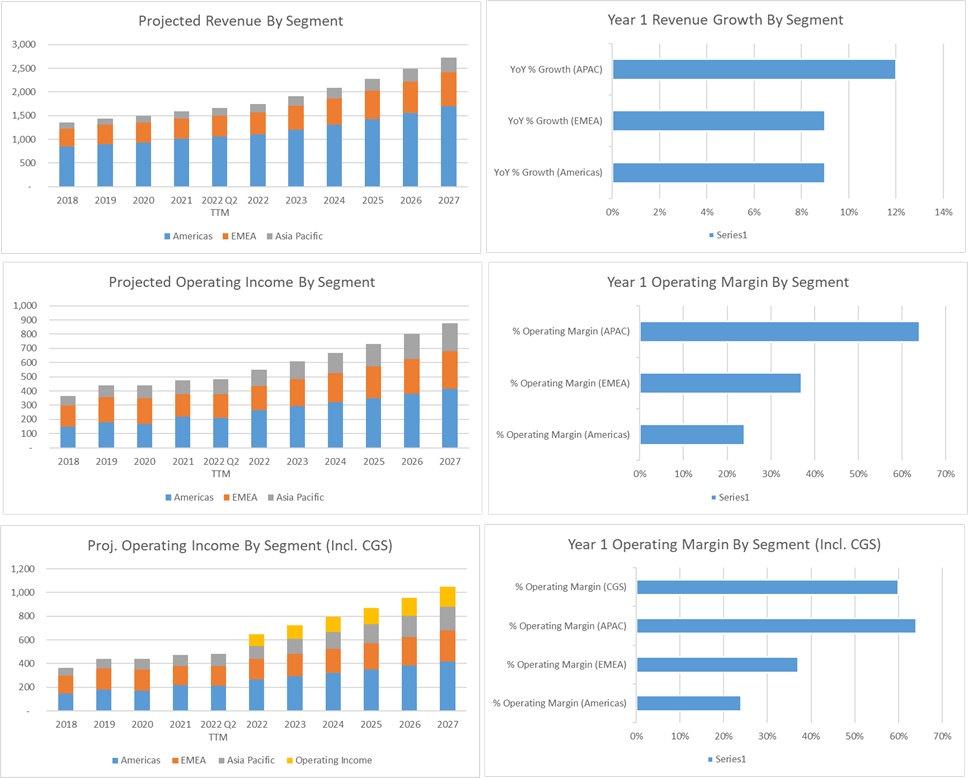
While not crucial to our investment thesis, we also want to highlight the FDS’s high growth in APAC, relative to EMEA and Americas. The company has been able to achieve >60% operating margin in APAC. Strong performance and high revenue growth (12%) in APAC further support our assumption of operating margin expansion.
(TTM): Trailing Twelve Months)
Company Filing, ZH Advisors
Revenue: Expect Consistent High-Single-Digit Revenue Growth
Summarizing revenue and organic ASV trends for each segment, we conclude that various industry tailwinds support a sustainable high-single-digit growth rate for FDS.
| Growth Drivers By Segment | ||
| Client Type | Buyside | 1. Private, wealth, corporate clients support long-term organic ASV growth; 2. Market uncertainty to benefit active management relative to passive, increasing buyside client and workstations count. |
| Sellside | Unlikely to experience significant growth due to decrease in deal activity | |
| Product | Research & Advisory | Increased demand for research content management as market uncertainty encourages more active investment management |
| Trading & Analytics | Increased demand for trade execution and portfolio analytics as market volatility highlights risk monitoring | |
| Content & Technology Solutions | Increased demand for alternative data from quantitative investment mangers | |
Financial Performance Analysis
Operating Margin
We expect FDS’s operating margin to expand by ~50bps/year to a 34% FY2027 exit. Two primary drivers to support our project are a) cost cutting and b) integration of CGS, a high-margin business with considerable synergy within the Trading & Analytics segment.
Cost Cutting
As a business service company, FDS has less requirement on having physical workspace than the broad market. A hybrid work arrangement will significantly decrease lease & real estate expenses. Real estate typically costs FDS 2.5-10% of revenue, and a 30% office space reduction will realize a ~100bps expansion by 2027. Data management will also be a key driver to the company’s improved operations. FDS is actively managing all data sources, and the cost reduction associated with more efficient data management is expected to be around ~150bps by 2027.
On the flip side, due to a tight labor market, compensation expenses are expected to increase. However, even as broad labor costs rise, many tech companies have announced layoffs and plan to further cut back on headcount, supplying the market with the type of workers that will easily add value to FDS. It would be difficult to estimate the cost of attracting technical talent given the current state of the broad economy and the tech sector specifically, but our expectation is that the impact of rising compensation cost on operating margin will be muted.
Accretive Acquisition of CGS & Additional Synergies
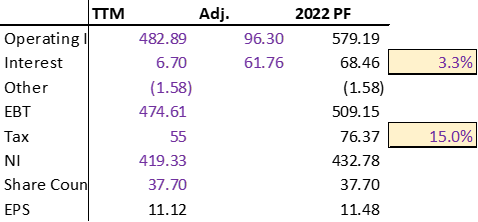
Successful acquisition and integration of Cusip Global Services will further improve operating margin. In Dec 2021, FactSet announced that it has entered into a definitive agreement to acquire CGS from S&P Global for $1.925 billion in cash. The transaction was completed in Mar 2022, after FactSet issued a 5Yr 2.90% senior note and a 10Yr 3.45% senior note in Feb 2022. At a weighted average cost of debt of around 3% (the exact deal structure is unknown), the acquisition is accretive from day 1, assuming CGS generates $175 million in gross revenue and $96.30 million in operating income.
Company Filing, ZH Advisors
The above analysis indicates that, without assuming any revenue/cost synergies, the acquisition already is beneficial to FDS in terms of EPS (admittedly, transaction structure and valuation also play a role). We believe there are significant synergies especially within the trading and advisory product segment (volatility increases, so participants become more active). CGS is forecast to generate $175 million in revenue from year 1 with a 50%-60% (55% modeled) operating margin. We believe that a year 1 operating margin (consolidating CGS) of 30-32% is a reasonably safe projection. Combined with management’s successful execution of cost-cutting strategies, a 150bps margin expansion by 2027 is our baseline forecast.
Leverage
Note that the issuance of new debt to acquire CQS does impact the credit profile of FDS. However, FDS had very little debt on its balance sheet ($575MM, adj. for long-term operating lease) prior to the acquisition, so the increase in leverage does not indicate any significant liquidity/credit risk. Interest coverage is – at its lowest – forecasted to be 10.6X, while rising to 15.3X at exit. To mitigate additional credit risk, we have decided not to include any multiple expansion at exit.
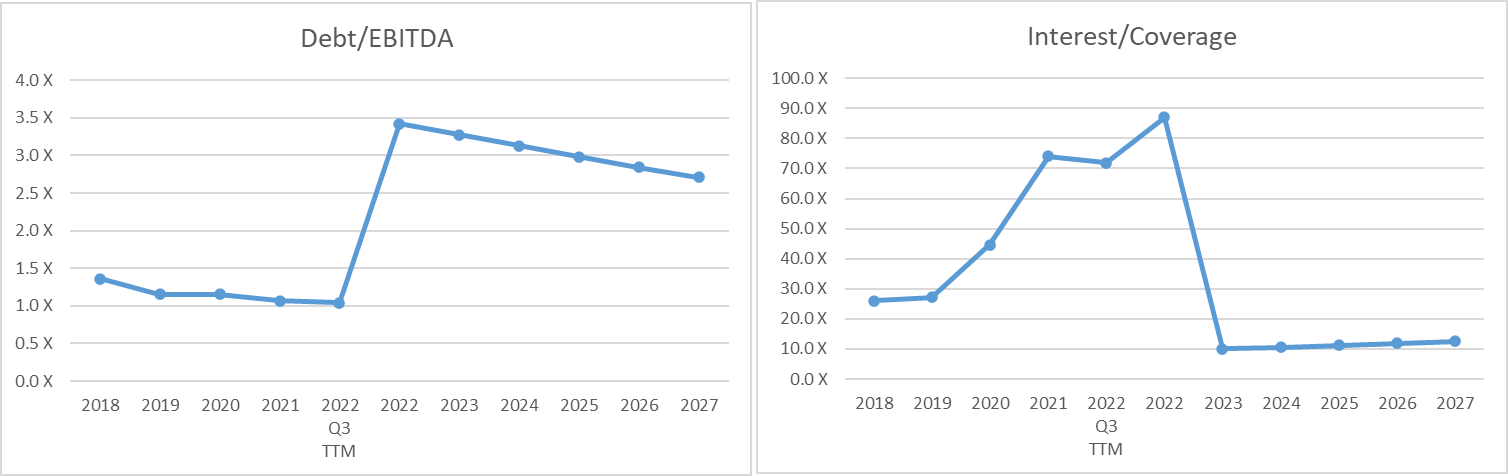
Company Filing, ZH Advisors
Cash Flow Generation
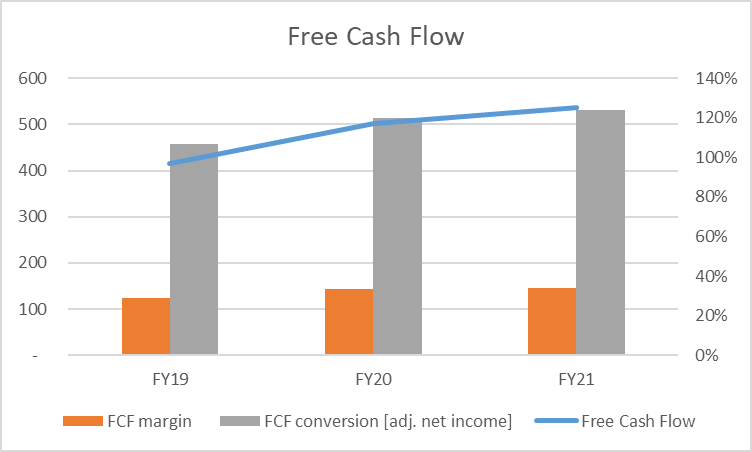
FDS has historically generated 30-35% free cash flow as a % of revenue (FCF margin). Notably, the FCF conversion rate from adjusted net income is over 100% due to depreciation expense and stock-based compensation. FDS spends around only 3-4% of revenue on CapEx, which also supports a high FCF margin.
Company Filing, ZH Advisors
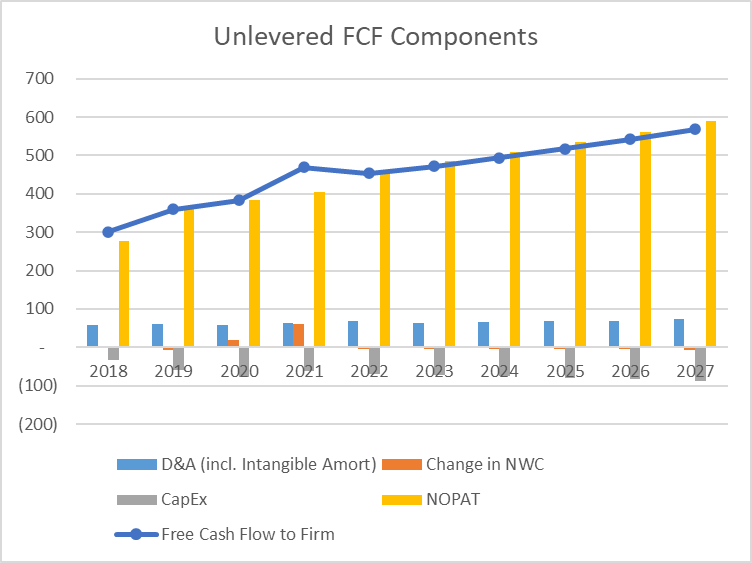
For the purpose of forward-looking projections, as FDS operates a relatively simple business model, most of the sources of cash is from NOPAT. We make a conservative assumption that FDS makes $10-15 million in working capital investment per year. This has not been the case historically, but since revenue will increase considerably after acquiring CGS, we believe such conservative adjustment is reasonable. In addition, we have assumed that CapEx will always be greater than D&A, which makes our final valuation more conservative.
Company Filing, ZH Advisors
Financial Performance: Expect Operating Margin Expansion
FDS has a high free cash flow conversion rate and a healthy leverage profile due to its limited debt, suggesting high quality of earnings. Additionally, FDS should be able to implement cost-cutting strategies and successfully integrate CGS to realize synergies with its various product segments. For these reasons, we believe FDS will increase its operating margin from 32% (FY2021) to around 34% at 2027 exit.
Risks & Downside Catalyst
Our main investment case is how FDS will be resilient – or even benefit – from a recessionary scenario, so our analysis will not be complete if we don’t look at company-specific and macroeconomic risks facing FDS. FDS’s most important business risk is competitive pressure, and we argue such risk is mitigated by a distinguished product. In terms of macroeconomic risk, we look at FDS’s performance through 2008 and conclude that the worst-case scenario is limited to a -20% drawdown in intrinsic value.
Company-specific risk: loss of competitive advantage
| Platform | Pricing | Market Share |
| Bloomberg | The cost of a Bloomberg Terminal is $27,660/year for one license, and terminals are leased on a two-year basis. The price drops to $24,240 per terminal per year for two or more terminals. See below for academic pricing. | 33.4% |
| Capital IQ | The cost of Capital IQ is not published publicly, as the pricing model is tier-based and tailored to meet the specific needs of each customer.
The lack of transparency around Capital IQ’s pricing stems from their product offerings being customized solutions for the customer profile and specific use-cases. |
6.2% |
| FactSet | The cost of a FactSet subscription is $12,000 per year for the full product. | 4.5% |
| Refinitiv Eikon | The cost of Eikon is $22,000 per year, but a stripped-down version can cost as little as $3,600 per year. | 19.6% |
(Source: WallStreetPrep)
Financial Analytics is a competitive business with several large established players. S&P Global Market Intelligence (SPGI) is a direct competitor with FDS’s products. In CapIQ, the user can extract and compare basic information for companies and transactions, making the product ubiquitous in investment banking. Gaining share in investment banking is important since most private equity analysts also have investment banking background. With the new acquisition of IHS Markit, S&P Global now offers a wider array of products than FDS, and it is possible that S&P Market Intelligence becomes the preferred source of info among both buyside and sellside clients. However, FactSet offers a distinguished product. First, FDS curates intelligence largely beyond simple data aggregation. For example, FactSet allows for streamlined pitching and stress testing, which are not currently a part of CapIQ. Second, FDS has made available useful Excel & PowerPoint add-ins, making the work of a banker more efficient. What mitigates the competitive pressure further is that FDS offer a comprehensive portfolio analytics and trade execution solution, which S&P Global does not offer currently. For those reasons, we believe FDS will be a share gainer in banking, private markets, and institutional asset management compared to S&P.
Macroeconomic recession risk
Since the risk of a US recession seems to be a real possibility, we look at a bearish scenario to assess downside. The COVID crisis in fact benefited FDS’s growth, so we look to the 2008 crisis for a more bearish scenario.
The worst EBITDA decrease of ~5% happened around Q2 2007. This compares to a 25%-35% broad decline in EBITDA in the SP500 index. The worst operating margin compression happened before the crisis in 2005 (-500bps compression). After the crisis, operating margin held steady around 30-33%, with the worst peak-to-trough compression around 200bps. Over the same period, average operating margin of S&P500 dropped from 12% to 7%. In terms of valuation, FDS did fall slightly more than the broad market. EV/EBITDA went from a pre-crisis 17X to a trough of 8X. SP500 fell from 13X to 8X. However, FDS’s EV/EBITDA quickly rebounded to pre-crisis level after two years, during which period SP500 did not experience any valuation expansion.
We generate the downside valuation with a year 1 (-5%) revenue estimate and a year 1 (-300bps) operating margin compression. From year 2 to year 5, revenue growth and operating margin will retrace to the 2022 levels. We assume no multiple expansion at exit. Under these assumptions, we arrive at the following.
|
Implied Share Price |
$305.08 |
|
Implied 1Yr Target Price |
$322.73 |
This implies that a worst case -20% in intrinsic value.
Downside Catalyst
Although the financial analytics market is competitive, FDS offers a differentiated product with significant advantages compared to other offers, and we believe FDS will be a share gainer in key market segments. FDS’s business operations are historically less impacted by market downturns, and we conclude that the downside is limited to a -20% drawdown.
Valuation
We make the following key assumptions when building our DCF model.
- ~9% revenue growth (revenue growth analysis above)
- 32% operating margin, expanding to 34% in year 5 (financial performance analysis above)
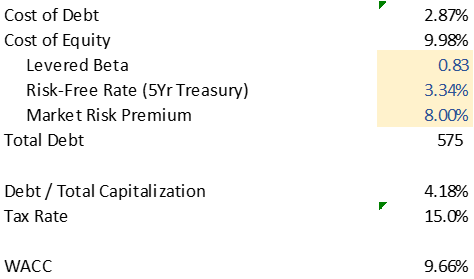
- 9.7% WACC: The following inputs are used to arrive at a 9.7% discount rate.
Company Filing, ZH Advisor
We want to note several important adjustments we make.
- We exclude stock-based compensation from the free cash flow (to firm) calculation and treat them as real cash outflows. We believe they are a significant expense (2-4% gross revenue) and critical to the company’s retention of talent, and therefore warrant a cash treatment.
- We exclude long-term operating lease expense from our EV calculation – instead of treating as long-term debt – as we believe the operating lease treatment is more reasonable.
Note that the assumed market risk premium of 8% is not particularly high. Considering the macroeconomic environment, we may enter a market where the required market risk premium is higher than modeled. Below is a sensitivity table stressing exit multiple and discount rate.
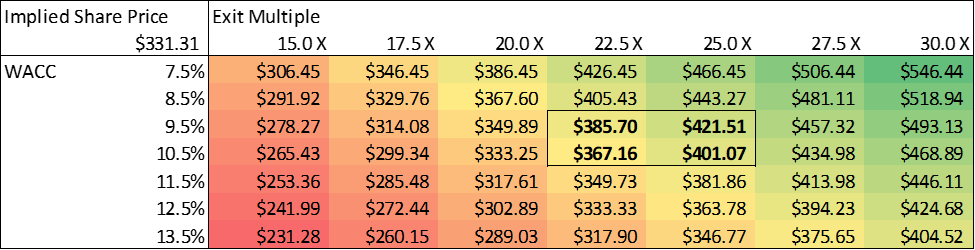
Company Filing, ZH Advisor
The highlighted box in the middle is where implied intrinsic value falls. Based on updated information from FDS’s 2022 Q3 quarterly filing, we now believe the company is trading at a slight discount to its intrinsic value.
Conclusion: Resilient growth at a reasonable price
FSD is expected to grow at a healthy pace while improving its operating performance. Our investment case is that, while continuing its long-term growth strategy, FDS should be resilient through a possible economic downturn and may even benefit from increased volatility. Indeed, its current valuation of 20x EV/EBITDA and 30+x P/E provides no “margin of safety”. However, through our DCF analysis, we conclude that the company is trading at a slight discount to its intrinsic value. Given the limited downside, we believe the current price level should provide a reasonable return for the risk-averse investor. Currently the stock is down -19% YTD; if another systematic sell-off occurs in the market, FDS presents an impressive buying opportunity.
Be the first to comment