

Diy13/iStock via Getty Images
Written by Nick Ackerman, co-produced by Stanford Chemist
Eaton Vance Tax-Advantaged Dividend Income Fund (EVT) was a position I had picked up in the fall of 2020. That was after watching the position for a couple of years. The fund never seemed to get to a deep enough discount or stay there for long enough to act on it. While 2020 put pressure on the fund and began trading at a discount, it really didn’t present a meaningful discount until the latter half of the year.
Since picking up the position, it has done exceptionally well in my portfolio. The discount it was carrying quickly reverted back to a premium, and it has been flirting around par for most of 2021 now. I’ve wanted to add even more to the position at some point, but it appears I’ll have to be patient once again, waiting for the significant panic selling.
Not only were the returns strong from the discount contraction back to a premium, but the overall market strength has been a huge contributing factor as well. They recently posted their Annual Report, with a fiscal year-end October 31st. Here is what they had to say about the period;
The 12-month period starting November 1, 2020 was notable for an equity rally that began in the opening month of the period and continued through period-end — except for a pause in January 2021 and a temporary retreat the following September. For the period as a whole, broad U.S. indexes generally posted strong double-digit returns as investors cheered the reopening of businesses that had been affected by the COVID-19 pandemic and the rollout of several highly effective vaccines.
Over the course of their fiscal year, they were able to beat their benchmark. However, mentioning that it was only because of leverage, which adds overall risk to the fund when volatility picks up.
For the 12-month period ended October 31, 2021, Eaton Vance Tax-Advantaged Dividend Income Fund (the Fund) returned 45.70% at net asset value of its common shares (NAV), outperforming its benchmark, the Russell 1000® Value Index (the Index), which returned 43.76%. The Fund’s common stock allocation and its preferred securities allocation each underperformed the Index during the period. However, the use of leverage — which is not employed by the Index — magnified the Fund’s positive performance enough to enable the Fund to outperform the Index during the period.
Some will view this negatively; some will be rather neutral about it. I’m in the second camp. Overall, it is rather neutral as EVT continues to deliver on what I expect – paying me monthly distributions. In addition to that, if I wanted Russell 1000 Value Index returns, I’d find an ETF for that.
In this case, I’m okay with the additional risks of leverage and exposure outside of equities. While equities are significant for EVT, they also carry preferred and other fixed-income. Over the long run, these assets could underperform the equities it is benchmarking against.

(Source)
The Basics
- 1-Year Z-score: 0.61
- Premium: 0.41%
- Distribution Yield: 6.68%
- Expense Ratio: 1.10%
- Leverage: 18.2%
- Managed Assets: $2.53 billion
- Structure: Perpetual
EVT has a focus on “dividend-paying common and preferred stocks and seeks to distribute a high level of dividend income that qualifies for favorable federal income tax treatment.” They also include a “value investment style and seeks to invest in dividend-paying common stocks that have the potential for meaningful dividend growth.” The investment objective is to “provide a high level of after-tax total return consisting primarily of tax-advantaged dividend income and capital appreciation.”
They mostly invest in the U.S. but have a small allocation to international positions, primarily in Europe. To meet this tax-advantaged objective, they will primarily be using long-term capital gains and qualified dividend income to reduce the tax burden. This can make it more appropriate for a taxable account.
The fund is quite large and continues to grow larger with the market appreciation. With over $2.5 billion in total managed assets, the fund is quite an impressive size. As mentioned above, they employ leverage, but it is rather moderate.
Their borrowings are on the lower side for now as rates stay low. Rates are set to rise in 2022, which could mean higher borrowing costs. That being said, they have a relatively attractive spread compared to some other funds we’ve been covering. In this case, it is a 1-month LIBOR plus just 0.50%. It isn’t uncommon that this is closer to 1% or above in some cases. At the end of their fiscal year, the average borrowing rate was 0.62%.
Performance – Solid Returns
Because EVT invests mainly in large-cap U.S.-based dividend-paying stocks, it is no surprise that the fund has delivered solid results.
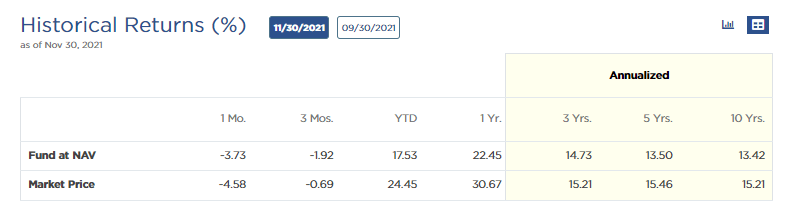
(Source – Fund Website)
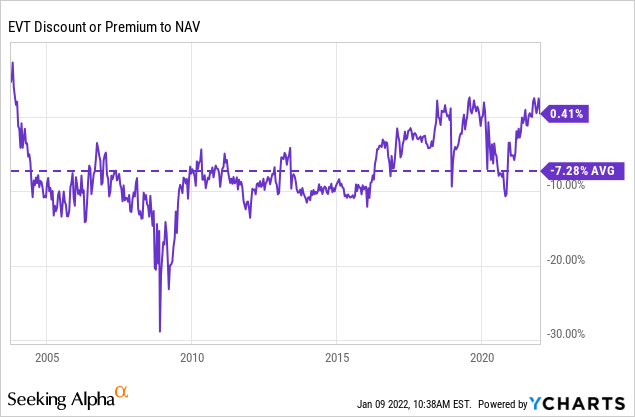
I believe this has helped garner more investor interest on the back of such strong returns. That has pushed the fund’s regular discount that it traded at years ago to continually trading around or above par. Of course, that is except for 2020 where we finally got a break to invest. The chart below is from the fund’s inception and shows the average discount since then. As we can see, we are well above this average.
However, we will see a different story if we look at just the last three years instead of the inception date. The fund still averages a discount thanks to the 2020 weight.
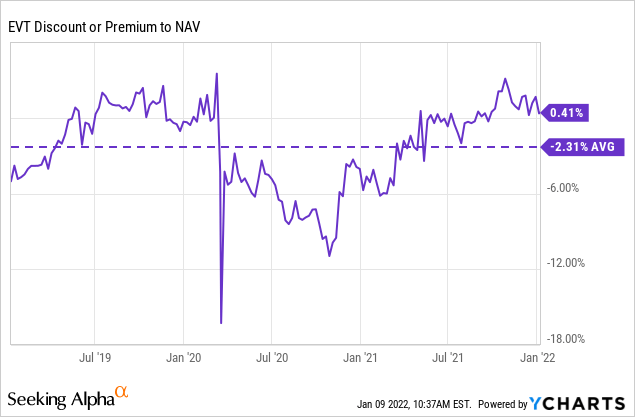
It could be a different story in the future, and international positions could outperform. I know I believe international investments are incredibly cheap and look quite attractive. Though I won’t change my portfolio dramatically, EVT will still deserve a place in my portfolio. Especially with its overweight allocation to the financial sector, more on that below.
Distribution – 12.1% Boost Helps
Several months ago, Eaton Vance boosted a number of their closed-end fund distributions. EVT was a lucky one to get a boost. This was good for a 12.1% increase, taking the monthly distribution from $0.145 to $0.1626. In the fund’s history, they have only cut once. That was around the 2008/09 financial crisis.
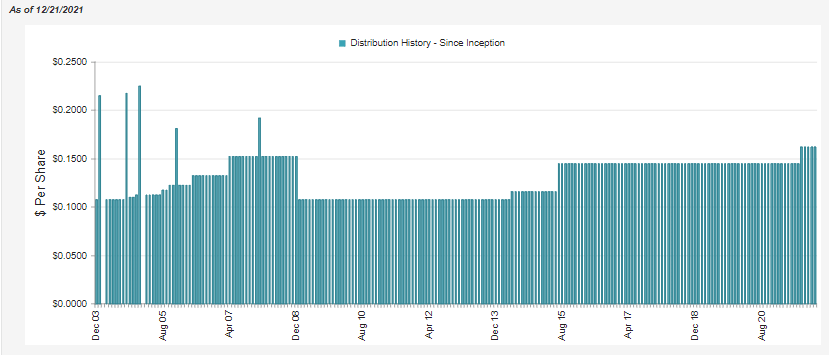
(Source – CEFConnect)
The fund’s distribution yield currently comes to 6.68%. On a NAV basis, that works out to 6.71%. These are reasonable and attractive yields, making them quite tempting for an income investor.
It is common for most equity funds to fuel their distributions through capital gains. That is no different with EVT. However, net investment income [NII] in this case is also a reasonably significant contributor. That would be thanks to their focus on dividend-paying stocks.
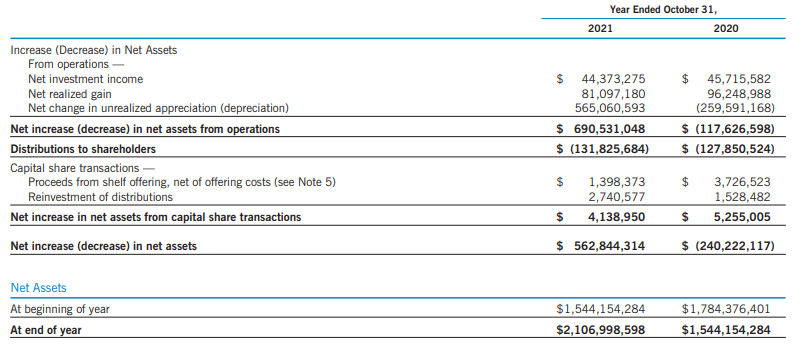
(Source – Annual Report)
NII dropped slightly year-over-year, and NII coverage came in at around 34%. Only a small drop from the 36% NII coverage from the prior year. Contributing to the drop was the combination of a bit lower NII and the increase in distributions to investors overall.
In the next report, we would expect this to drop a bit further as well. That would be due to the fact that it’ll represent a full period of the higher distribution being paid.
Since the fund trades at premiums, they utilize a DRIP that issues new shares. They also have in place an at-the-market offering that can further increase the number of shares. Since they are issued at a premium, it would be accretive to NAV for all shareholders. Though it isn’t even measurable at these levels, it certainly isn’t harmful.
Over the last couple of years, the tax character of the distributions has been fairly consistent.
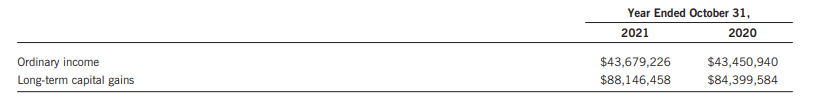
(Source – Annual Report)
In 2020, 100% of the ordinary income was considered qualified dividends. Therefore, tax-advantaged for shareholders. For 2021, we will have to wait for the final tax classifications in early 2022.
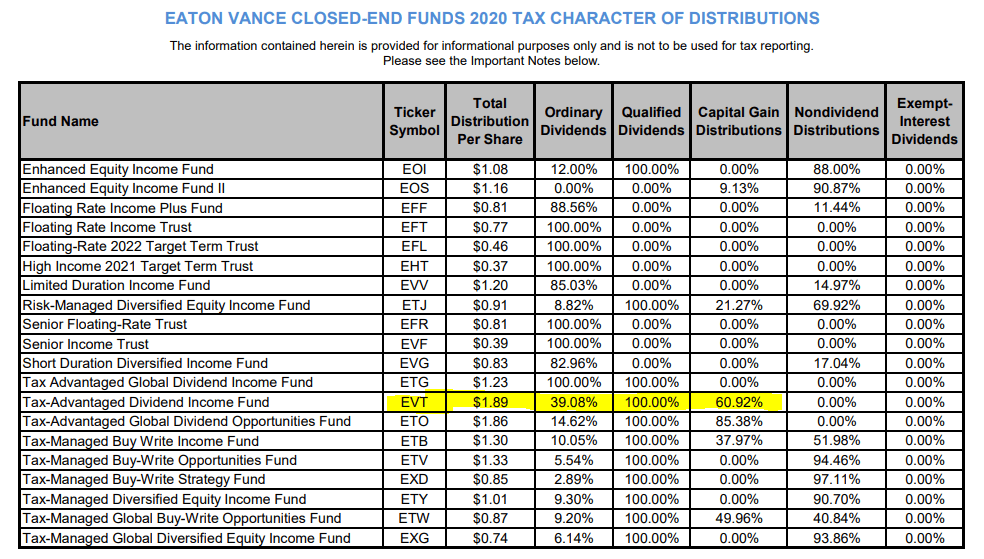
(Source – 2020 Tax Character)
EVT’s Portfolio
EVT is an actively managed fund, as all closed-end funds are. In this case, the fund reports a relatively active turnover for most years. Last fiscal year, they reported 30%. However, it has been as high as 85%, as reported in 2017.
The asset allocation for EVT has been fairly consistent since I’ve been following the fund. As I’ve mentioned, total equity, particularly in U.S. equity, has been the dominant weighting. This can be found in their Fact Sheet for the period ending September 2021.
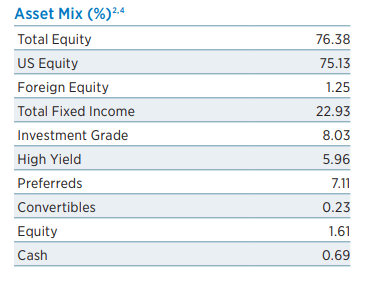
(Source – Fact Sheet)
What I believe is another draw for this fund is that they have an overweight allocation to financials. At the end of October, it was nearly 30%.
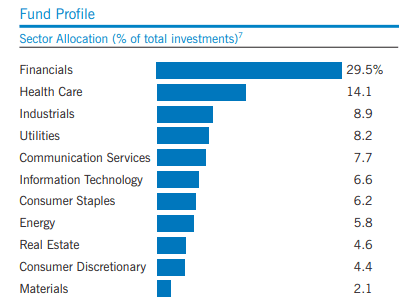
(Source – Annual Report)
That is a significant increase from the 15% the fund reported a year earlier and highlighted in my previous article. At that time, financials made up just 15% of their allocation. It was still the most sizeable allocation, but they have ramped this up significantly through the year.
With that, it really comes to no surprise the types of holdings we see in their top 10.
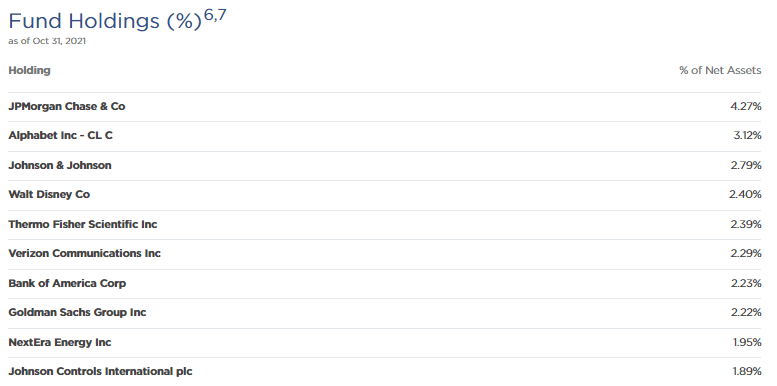
(Source – Fund Website)
JPMorgan (JPM) was one of the top positions previously. However, the allocation was 2.91%, so the latest update shows a fairly significant increase. Bank of America (BAC) also had its allocation increased from 2.02% to 2.23%. One position that was removed from the top list was PNC Financial Services Group (PNC). Instead, we now see that Goldman Sachs Group (GS) is making an appearance.
When looking at the full list of holdings for EVT, they have dropped the position for PNC all the way down to just a 0.26% allocation. At the end of October 2021, they carried 26,157 shares. In October 2020, this was a significantly larger position of 281,037 shares.
Interestingly, the number of shares of GS also was reduced. They went from holding 115,138 shares to 113,204 by October 2021. Yet, the performance of GS over that time frame was significant and led to the position growing in its allocation within EVT.
In fact, all of these financial positions have done incredibly well over EVT’s fiscal year. Below is a chart including GS, JPM and BAC. I’ve included the S&P 500 ETF (SPY) for context.
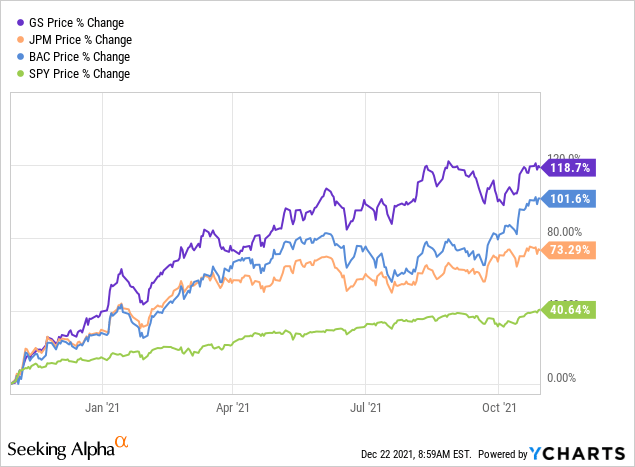
Financials are set to continue to do well, with higher interest rates coming over the next several years. That is one reason why EVT would have to get a lot more expensive from here before I’d consider selling. For now, I’ll continue to enjoy the high distribution that EVT is paying out.
Conclusion
EVT has had an incredible run over the last year. The latest Annual Report shows us that their NII and capital gains have been consistent and strong. Of course, we can gather that from the upward trend of the price and NAV per share. With the Annual Report, we can see what’s going on under the hood in greater detail. EVT might be on the more expensive side with a premium, but I expect the fund can still deliver some attractive returns going forward. They carry a significant position in financial securities, which should do well when rates rise.
Be the first to comment