

olrat/iStock via Getty Images
Continuing the series of articles discussing conditions in emerging markets, today I would like to provide an update on the iShares MSCI South Africa ETF (NYSEARCA:EZA), which I previously covered in December 2020.
With the MSCI South Africa 25/50 Index lying at the crux of it, EZA oversees a portfolio of around $332 million disproportionately spread between 37 equity holdings. It is a financials-heavy play with meaningful exposure to materials. With individual weights marginally exceeding 1%, energy, healthcare, and industrials are sectors where the fund has almost no footprint.
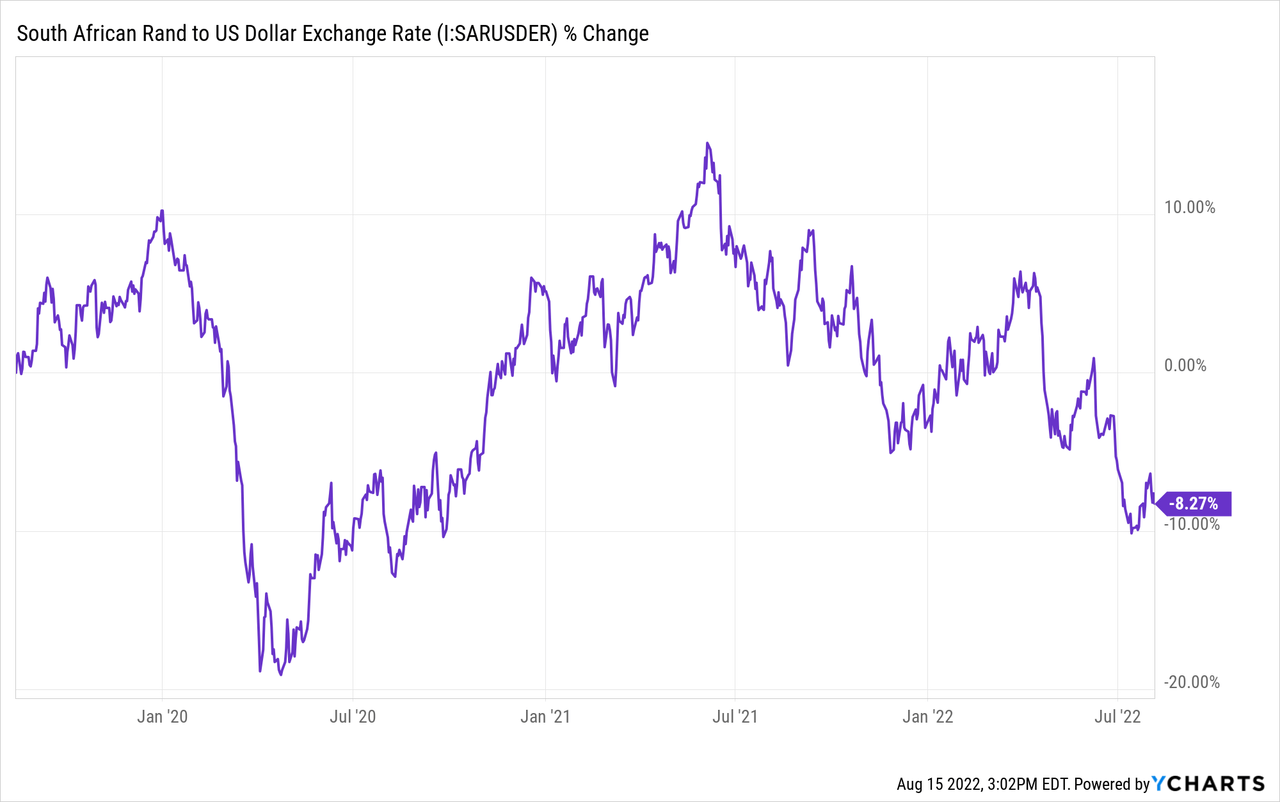
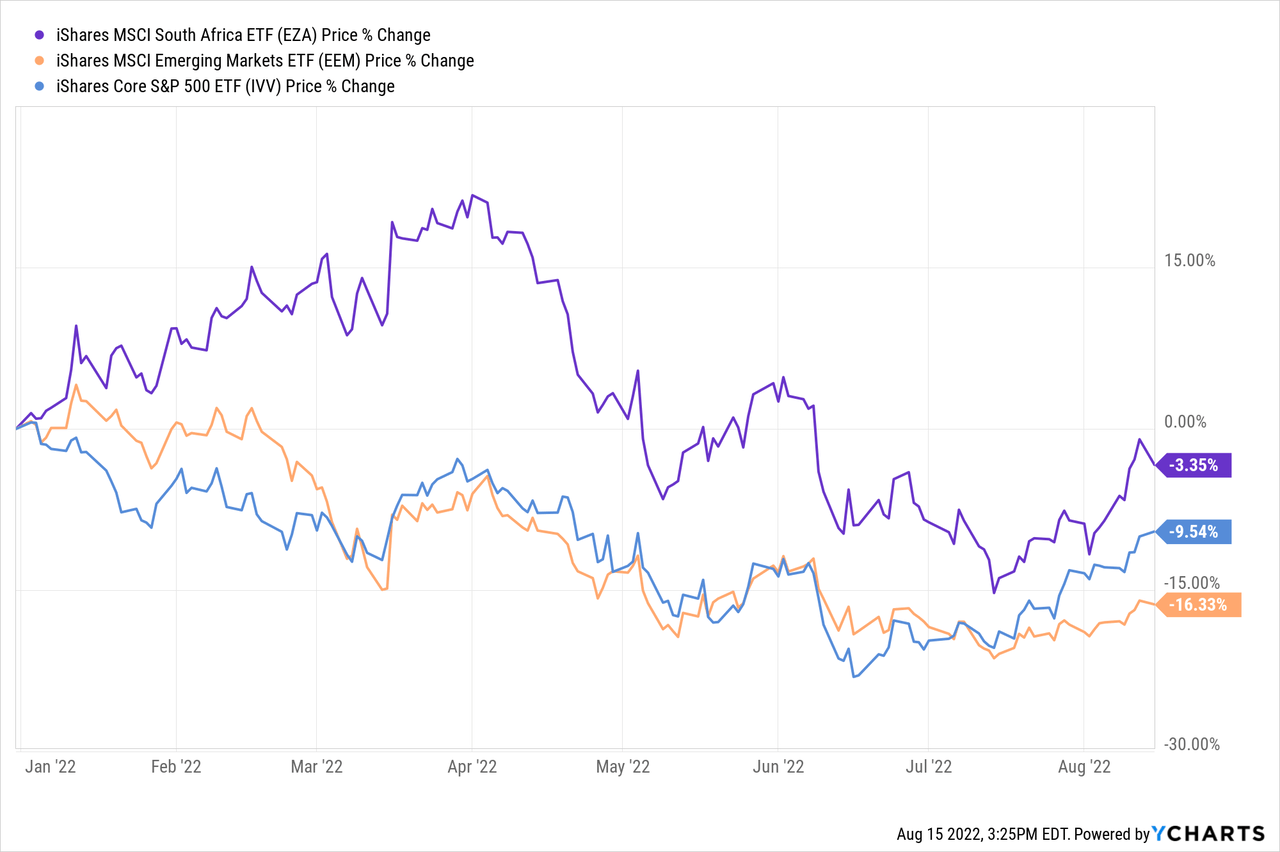
Since my note, EZA has massively underperformed the S&P 500, by more than 10% as of writing this article, with the soft performance of the rand being one of the top detractors this year which erased gains seen in 2021.
Today’s article delves into the current macro considerations surrounding South African equities, flagging risks that prospective investors should consider carefully before cranking up bets on this market. And in light of the existing risks, I maintain a neutral rating.
South Africa macro considerations: rates do little to buttress the rand
Upon cursory inspection, the South African economy is barely on a shaky footing. EZA bulls could remind skeptics that the Reserve Bank revised its 2022 economic forecast in July, anticipating 2% growth vs. 1.7% previously. This is in sharp contrast to the International Monetary Fund actually downgrading its outlook for emerging markets and developing economies the same month, with the revised rate for the cohort down 20 bps to 3.6% for 2022 and down 50 bps to 3.9% for 2023.
But delving deeper into the data, confidence supported by a higher GDP forecast starts to dissipate.
First, the debilitating effects of the heavy rains that triggered flooding in KwaZulu-Natal not only brought human suffering but also took a heavy economic toll. One particular fact that stands out is that around 2,500 hectares of cane fields were destructed, which means a scarcer supply of sugar and subsequently higher food inflation in the country, which is already on a tear due to geopolitics-linked agricultural commodities market turmoil.
The annual forecast also defied power outages that once again brought to attention the engrained issues of the country’s electricity sector, namely the insufficient capacity of state-run aging coal power plants. The government designed a plan to boost supply from private players, while also adding renewable to the mix, though it is uncertain whether these will ultimately resolve the problem that traces back to 2008. For materials companies, namely smelters and mines that have immense energy demand, the fragile electricity supply is a strong bearish factor, thus traders betting on the ZAR to depreciate amid a new wave of rolling blackouts did have their rationale.
Combined with the flooding, load-shedding pushed the economy down 1.1% in Q2. And for the third and fourth quarters, the SARB sees anemic growth rates, 70 bps, and 40 bps, respectively. Also, the medium-term situation is far from being rosy for a multitude of reasons. For example, the central bank actually cut its expectations for 2023 and 2024, with the slashed forecast growth rates at 1.3% and 1.5% vs. 1.9% for both years anticipated previously.
Next, amid the excruciating inflation principally fueled by soaring energy and food prices and also the weaker ZAR, the Reserve Bank had to act accordingly to stem the ugly repercussion of it spiraling out of control. In July, it increased the repo rate by 75 bps to 5.5%. It was the fifth rate hike in a row and the most aggressive move in twenty years, and more increases are in the cards.
Additionally, the global macro factors are weighing on the rand. For example, this is China’s surprise 10 bps rate cut. This can be perceived as both a bullish and bearish factor for the SA currency and EZA. I would say that my sentiment is somewhat bearish. In my view, more likely this will be interpreted by the market as a sign of weakness in China’s energy-intensive sectors as weaker industrial production growth of 3.8% in July, well below consensus, was what attracted attention, triggering an immediate reaction from the oil market that started pricing in softer demand. That is to say, uncertainty regarding the economic expansion of SA’s key trading partner bodes ill for the rand.
A closer look at the portfolio
EZA’s tilt towards financials which account for over 33% makes it inherently more sensitive to the monetary policy in the country which has a direct impact on the bottom line of banks and the like. For example, commenting on its full-year guidance, Standard Bank Group (SGBOF) (OTCPK:SGBLY), one of EZA’s largest investments in the financial sector, mentioned that
A higher average balance sheet and positive endowment from higher interest rates should drive strong growth in net interest income.
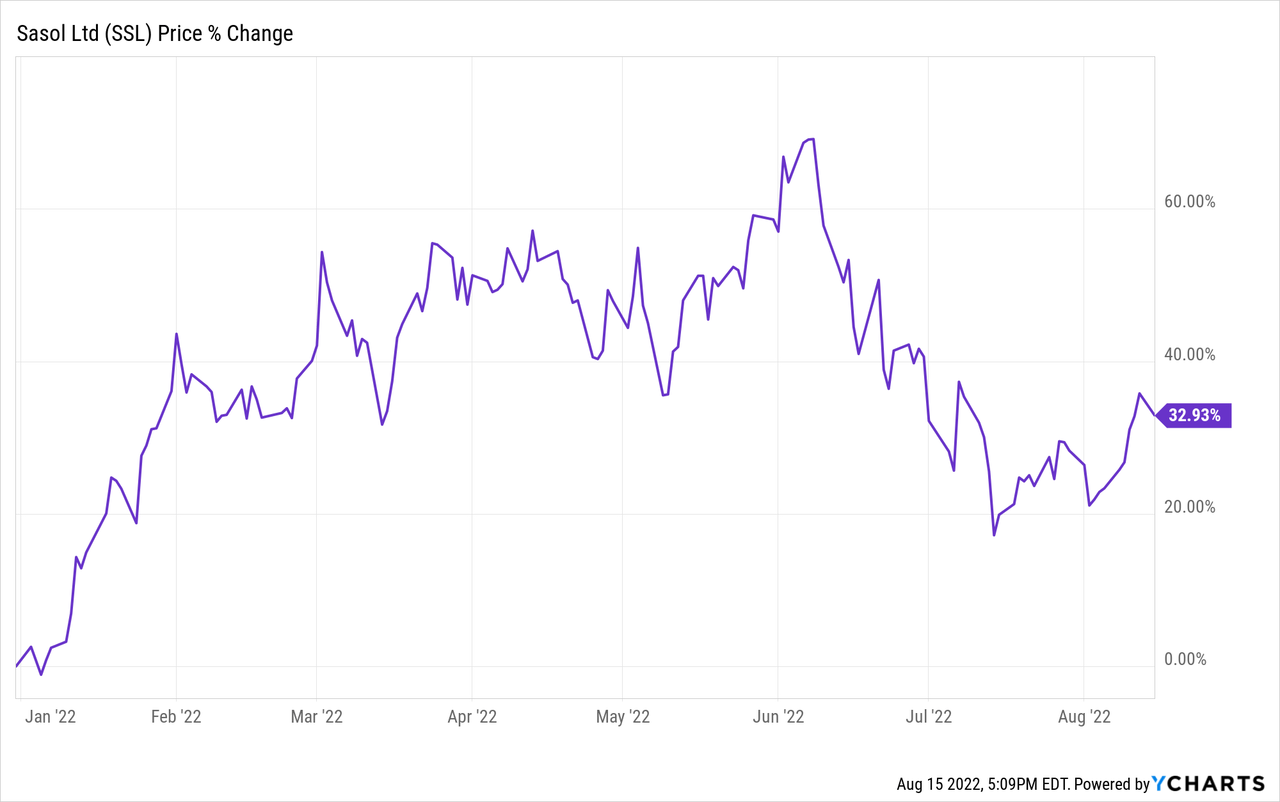
Materials come second, with around 23.7% allocated and Sasol (SSL), an integrated chemical and energy heavyweight, being the primary holding. SSL’s exposure to inflationary themes secured its YTD gains of almost 33%, and even despite that, the firm remains grossly underappreciated, trading with an EV/EBITDA more than a quarter lower than the sector median.
The ETF is meaningfully overweight Naspers Limited (OTCPK:NPSNY), one of the largest tech investors in the world, which accounts for 13.5% of its net assets occupying the top spot in the portfolio. For Naspers, 2022 has been a mixed year, as its share price in Johannesburg has been gradually creeping lower in the first months but in late June, it staged a swift recovery, quickly pairing earlier losses, with the YTD price decline now standing at only ~(1.4)%.
Final thoughts
In sum, EZA has positively surprised this year, with returns not only stronger compared to its EM counterparts but also ahead of the U.S. market.
For better context, EZA beat EEM only three times since July 2012 (four if we include all the twelve months of 2012), with 2021 being especially robust.
Created by the author using data from Portfolio Visualizer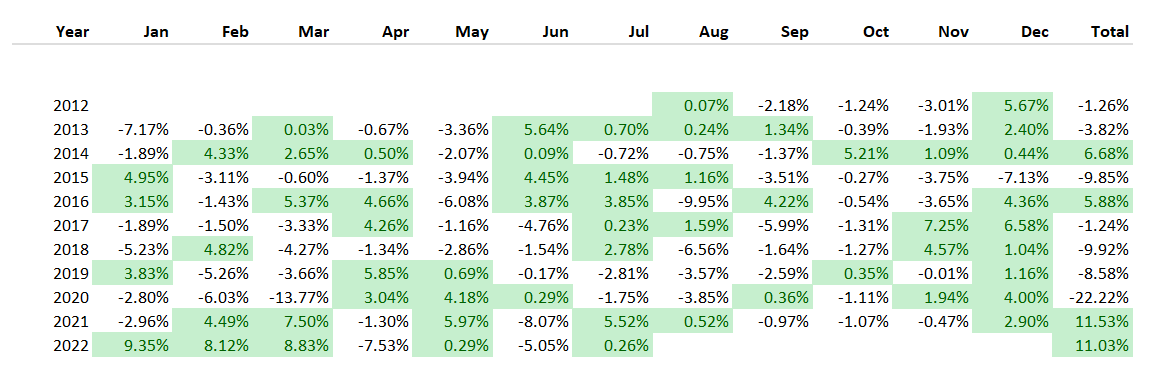
As a materials-heavy fund, it did benefit from inflationary beneficiaries present in its portfolio, while the rand was initially buttressed by resilient commodity exports and the hawkish SARB. However, we see that the rand thesis has become much weaker as risks became more pronounced. For example, the recent downbeat economic data from China adds to the possibility of softer demand for commodities, including South Africa’s primary exports like ore, slag, and mineral fuels, a clearly bearish factor for the ZAR as most of its commodity exports are headed toward this market.
Besides, there is little hope that more aggressive moves from the central bank will bolster the currency’s allure. With the U.S. and most of the developed world proceeding with interest rate increases, EM currencies that bear additional regional risk discounts look less appealing.
Please do remember that EM plays, EZA being a perfect illustration, welcome volatility, with the South Africa ETF’s standard deviation in the previous ten years ended July 31 standing at almost 24% vs. ~16% for the iShares MSCI Emerging Markets ETF (EEM). Its D Risk grade is not coincidental. While I have no strong reason why volatility in SA equities should edge lower in the near future, this points to inherently weaker risk-adjusted returns going forward.
The ETF looks comparatively cheap on a P/E basis, sporting a ratio of just 8.6x, but that is explainable given risks and possible headwinds.
That said, though understanding that global commodity markets remain tight and there is a small chance that this might actually turn out as a medium-term bullish factor for the rand, I am of the opinion that EZA does not offer a disproportionate risk-reward profile supportive of a strong bullish thesis. I maintain my neutral rating.
Be the first to comment