

Euro Outlook:
- The Euro started May on rocky footing, but may be turning the corner after a trio of EUR-crosses rebounded at their daily 21-EMAs.
- Both EUR/JPY and EUR/USD are hovering near multi-year downtrend downtrends, while EUR/GBP may still have more room to the topside.
- Per the IG Client Sentiment Index, the Euro has a different bias among its major crosses.
Euro Reverses May’s Rough Start
The first few trading days of May proved difficult trading grounds for the Euro, perhaps besieged by the fact that the fifth month of the year has also been the worst month of the year, from a seasonality perspective. For better or for worse, the Euro remains without a significant catalyst, having been at the whims of broader risk trends; for now, gains in global equity markets and bond yields. This has proved fertile ground for the trio of major EUR-crosses to rebound from the daily 21-EMAs after several days of weakness to start May.
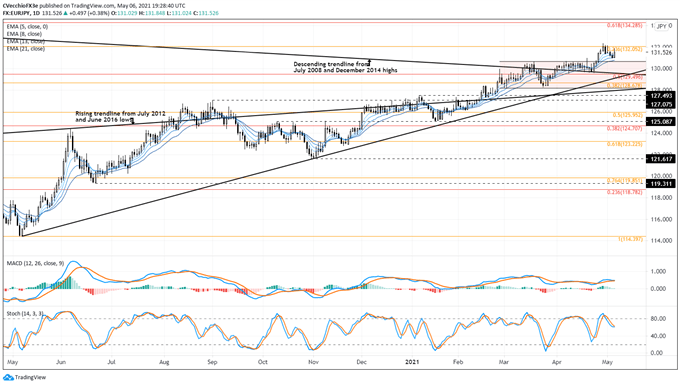
EUR/USD RATE TECHNICAL ANALYSIS: DAILY CHART (March 2020 to April 2021) (CHART 1)
The pullback in EUR/USD rates has been stopped at the daily 21-EMA as well as a longstanding confluence of technical levels that have been established as both support and resistance going back to last July: the 76.4% Fibonacci retracement of the 2019 low/2020 high range at 1.1945; the August and September 2020 highs at 1.1967 and 1.2011, respectively; and the 23.6% Fibonacci retracement of the 2017 low/2018 high range at 1.2033. If EUR/USD rates turn higher from here, a break above the descending trendline from the January and February swing highs would be a strong indication that a more significant rally was beginning to unfold.
IG Client Sentiment Index: EUR/USD Rate Forecast (May 6, 2021) (Chart 2)
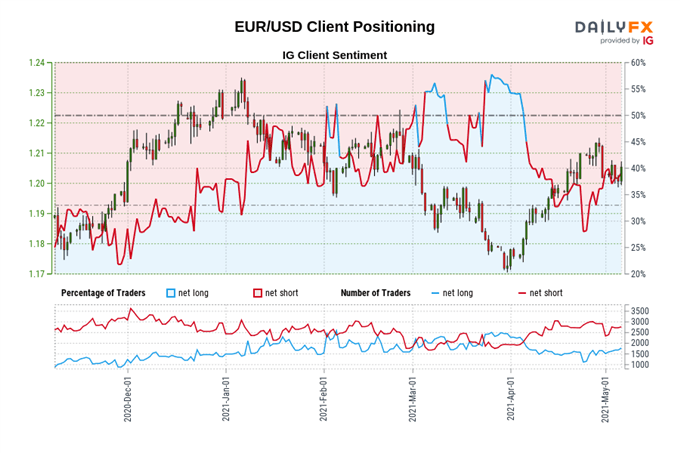
EUR/USD: Retail trader data shows 36.54% of traders are net-long with the ratio of traders short to long at 1.74 to 1. The number of traders net-long is 3.38% lower than yesterday and 2.45% higher from last week, while the number of traders net-short is 0.57% higher than yesterday and 2.89% lower from last week.
We typically take a contrarian view to crowd sentiment, and the fact traders are net-short suggests EUR/USD prices may continue to rise.
Positioning is more net-short than yesterday but less net-short from last week. The combination of current sentiment and recent changes gives us a further mixed EUR/USD trading bias.
EUR/JPY RATE TECHNICAL ANALYSIS: DAILY CHART (March 2020 to May 2021) (CHART 3)
In the prior update it was noted that “a dip may be ahead before another crack at fresh yearly highs.” EUR/JPY rates closed out April by surging to fresh yearly highs, but May has been met with a minor setback to the daily 21-EMA, which has acted as support. Consistent with the previously established view that “a bull flag has formed between 128.19 and 130.66,” and that “EUR/JPY rates are still contending with a break of the downtrend from the 2008 (all-time high) and 2014 highs,” EUR/JPY rates may have experienced the anticipated ‘dip’ and are ready to continue with their bullish breakout through the descending trendline dating back to the July 2008 (all-time) high.
IG Client Sentiment Index: EUR/JPY Rate Forecast (May 6, 2021) (Chart 4)

EUR/JPY: Retail trader data shows 41.06% of traders are net-long with the ratio of traders short to long at 1.44 to 1. The number of traders net-long is 14.02% higher than yesterday and 19.44% higher from last week, while the number of traders net-short is 9.81% lower than yesterday and 9.62% lower from last week.
We typically take a contrarian view to crowd sentiment, and the fact traders are net-short suggests EUR/JPY prices may continue to rise.
Yet traders are less net-short than yesterday and compared with last week. Recent changes in sentiment warn that the current EUR/JPY price trend may soon reverse lower despite the fact traders remain net-short.
EUR/GBP RATE TECHNICAL ANALYSIS: DAILY CHART (February 2020 to May 2021) (CHART 5)
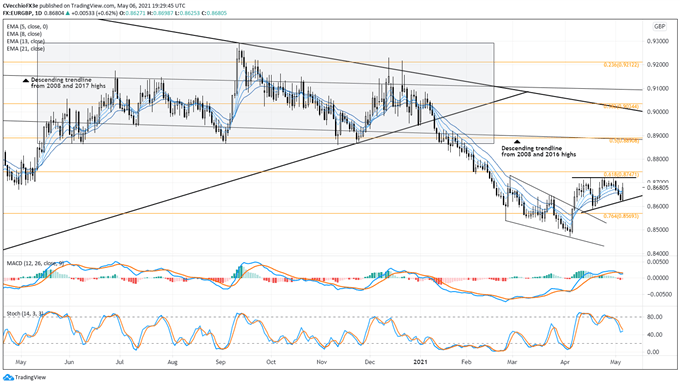
Following their bullish falling wedge breakout, EUR/GBP rates have been trading into an ascending triangle, which suggests that more upside may be ahead over the next several weeks. Accordingly, with EUR/GBP rates in the middle of the consolidation, there is still more time needed before any decisive directional break can be determined. With daily MACD flat and daily Slow Stochastics holding at their median line, momentum is decidedly neutral in the near-term; better opportunities may exist elsewhere.
IG Client Sentiment Index: EUR/GBP Rate Forecast (May 6, 2021) (Chart 7)

EUR/GBP: Retail trader data shows 52.08% of traders are net-long with the ratio of traders long to short at 1.09 to 1. The number of traders net-long is 11.80% lower than yesterday and 14.21% lower from last week, while the number of traders net-short is 9.78% lower than yesterday and 12.02% lower from last week.
We typically take a contrarian view to crowd sentiment, and the fact traders are net-long suggests EUR/GBP prices may continue to fall.
Yet traders are less net-long than yesterday and compared with last week. Recent changes in sentiment warn that the current EUR/GBP price trend may soon reverse higher despite the fact traders remain net-long.
— Written by Christopher Vecchio, CFA, Senior Currency Strategist
Be the first to comment