

Gold (XAU/USD) Analysis:
- Hot US CPI forecast continues to support gold prices in the near-term
- Net-flows into the worlds largest gold ETF ‘GLD’ slow on the last few days but remains net-positive YTD
- Long-term range back in focus but political instability complicates the situation
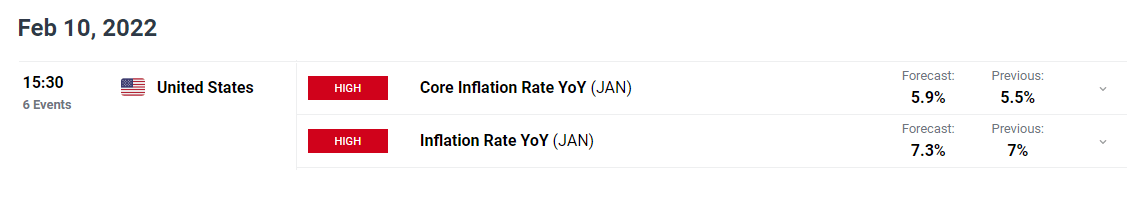
While the relationship of inflation and gold prices appears more significant over the long term, US CPI on Thursday remains an important risk event for gold. Inflation has been shown to be more persistent than originally anticipated my most major central banks, which increases golds attractiveness due to its ‘store of value’ characteristic. Headline inflation is forecast for 7.3%, the hottest figure in over 40 years.
Customize and filter live economic data via our DaliyFX economic calendar
Alongside its safe haven allure, the precious metal has also been supported by rather sizeable net inflows (+ $2.169 billion) into the world’s largest gold ETF ‘SPDR Gold Shares (GLD)’, in 2022 thus far. The mechanism in which net-flow changes can affect the price of gold is through the ETF’s mandate to back investor inflows with actual gold. Therefore, rising inflows results in increased gold purchases.
GLD ETF Flows (year to date)
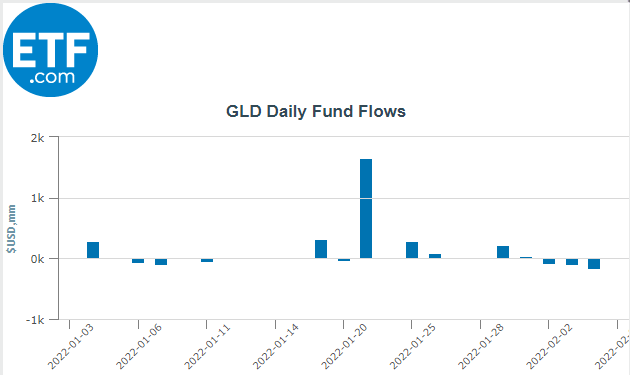
Source: etf.com
Looking at the daily gold (XAU/USD) chart, the yellow metal has surged higher since the 28 Jan low around 1780. The bullish move was rather uncertain as two failed attempts to trade lower resulted in the formation of two successive candles exhibiting long lower wicks.
Subsequent price action, buoyed by the ongoing political instability in eastern Europe, lead prices higher. Currently, price action is attempting to remain above the 38.2% Fibonacci level of the 2020 high to 2021 low at 1823. The most relevant level of resistance remains the significant 1835 level which has provided an inflection point throughout most of H2 2021. It must be noted that the current low levels of gold volatility – seen via the average true range indicator (ATR) – tends to be supportive of a longer term range trading setup. Should volatility decline and prices begin to drop, levels of support lie at the psychological level of 1800 and then 1790 – which appears around the mid-point of the long term range between 1835 and 1764.
However, the Russia-Ukraine situation complicates the outlook for gold if tensions escalate or indeed, we witness an invasion of Ukraine which would boost volatility in the price of the commodity to such a degree that the 1835 level could easily be surpassed.
Gold (XAU/USD) Daily Chart
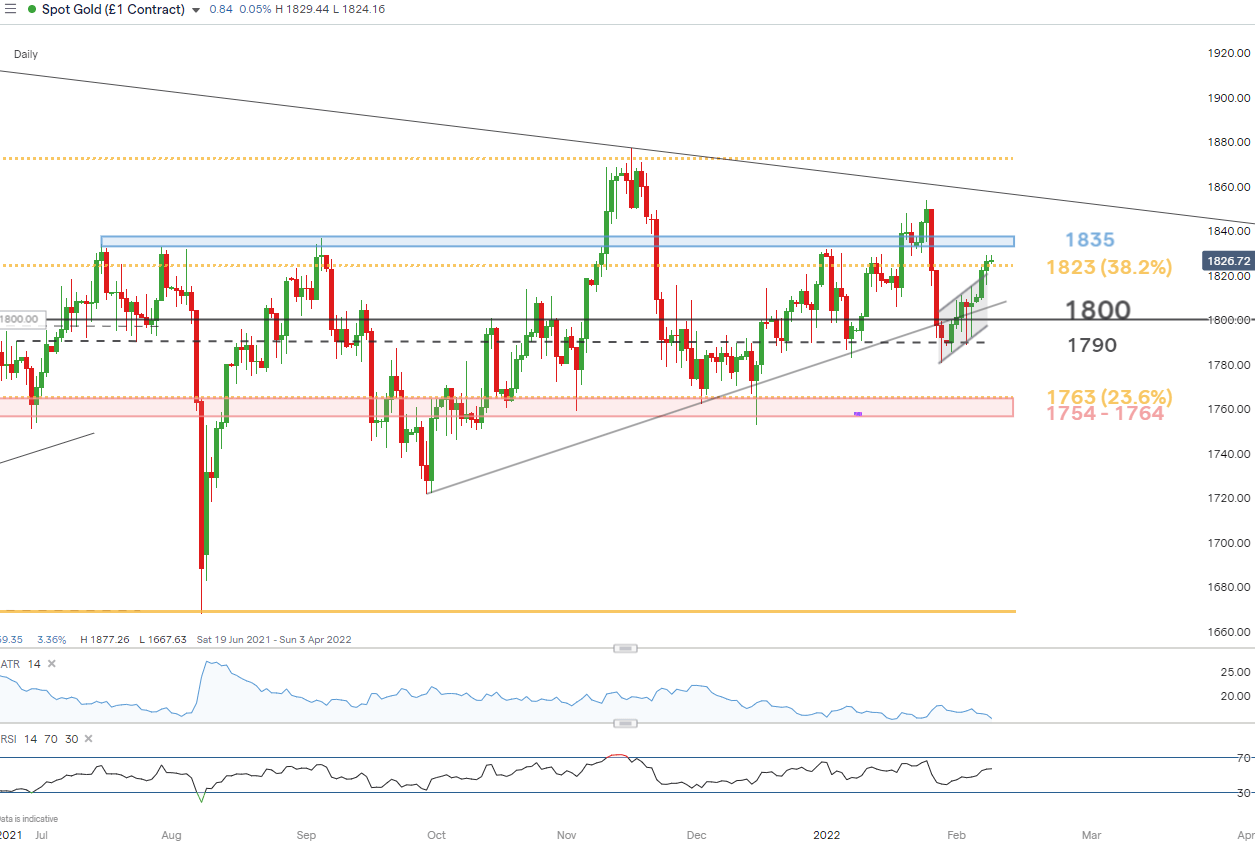
Source: IG, prepared by Richard Snow
The 4-hour chart appears to show waning bullish momentum as price action consolidates ahead of the 1835 level. Bullish continuation may be assessed should prices hold above 1823 but a failure to hold above opens the door towards the long term range previously discussed.
Gold (XAU/USD) 4-Hour Chart
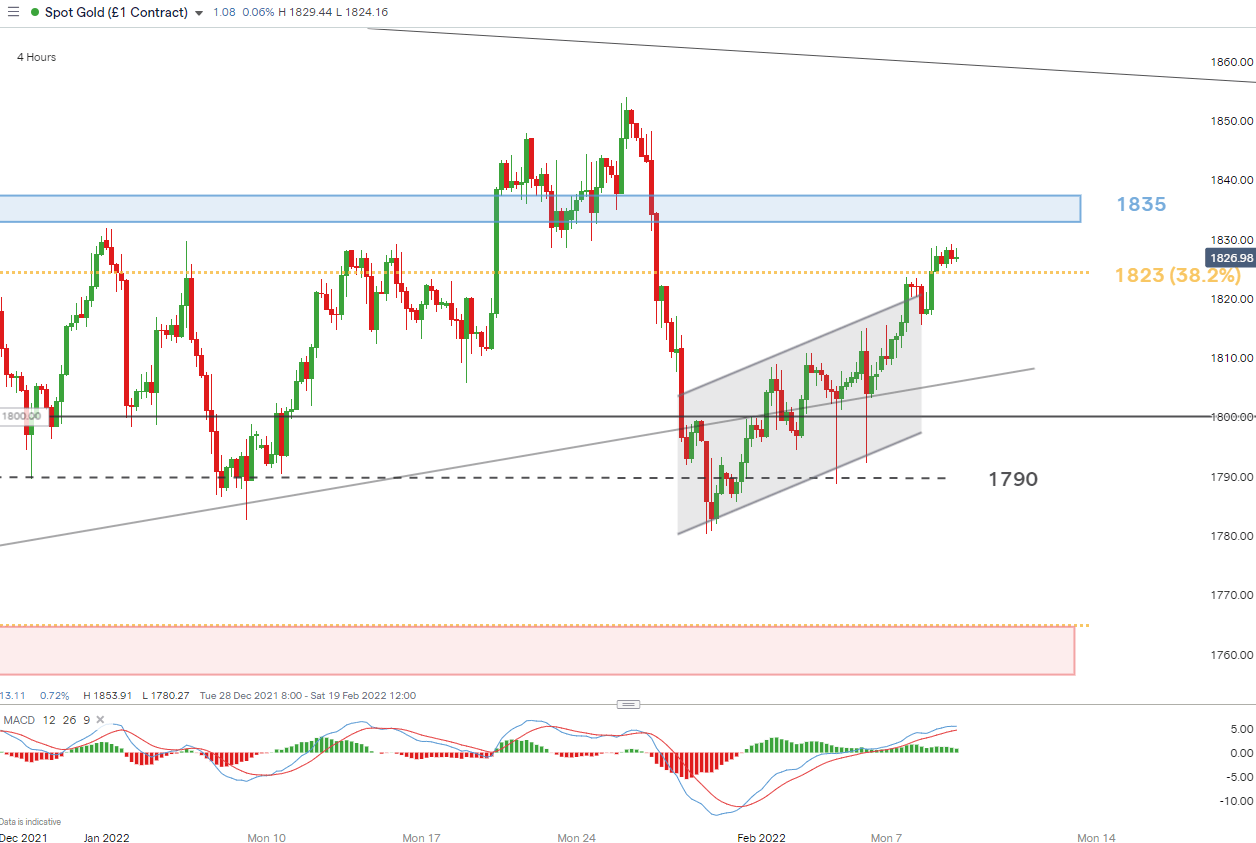
Source: IG, prepared by Richard Snow
— Written by Richard Snow for DailyFX.com
Contact and follow Richard on Twitter: @RichardSnowFX
Be the first to comment