

GBP/USD Price, Chart, and Analysis
- UK 10yr bond yields trim recent highs but remain firm.
- US CPI and UK GDP will steer GBP/USD in the short term.
Cable (GBP/USD) is nudging higher in early trade, helped by a marginally weaker US dollar and an accommodative UK gilt complex, ahead of two important data releases later in the week. The 10yr UK benchmark gilt is trading with a yield of 1.435%, down from a multi-year high of 1.50% made on Tuesday but still nearly 50 basis points higher on the year. The gilt market has been pricing in a series of further UK rate hikes over the last few weeks and this is underpinning the British Pound against a range of other currencies.
The Bank of England’s 25 basis point rate hike last week to 0.50% is expected to be followed by a further 25bp hike at the next MPC meeting in March with further hikes priced in throughout the year as the central bank grapples with a multi-decade high inflation rate (5.4%). At the last MPC meeting, the BoE said that inflation may hit in excess of 7% in the short term. Rates markets are now pricing in a Bank Rate of 1.5% by the end of 2022.
In the short term, cable will be moved by the latest look at US inflation on Thursday (13:30 GMT) and the December UK GDP numbers that will be released on Friday (07:00 GMT). Both releases need to be closely followed by GBP/USD traders.
Keep up to date with all market-moving data releases and events by using the DailyFX Calendar
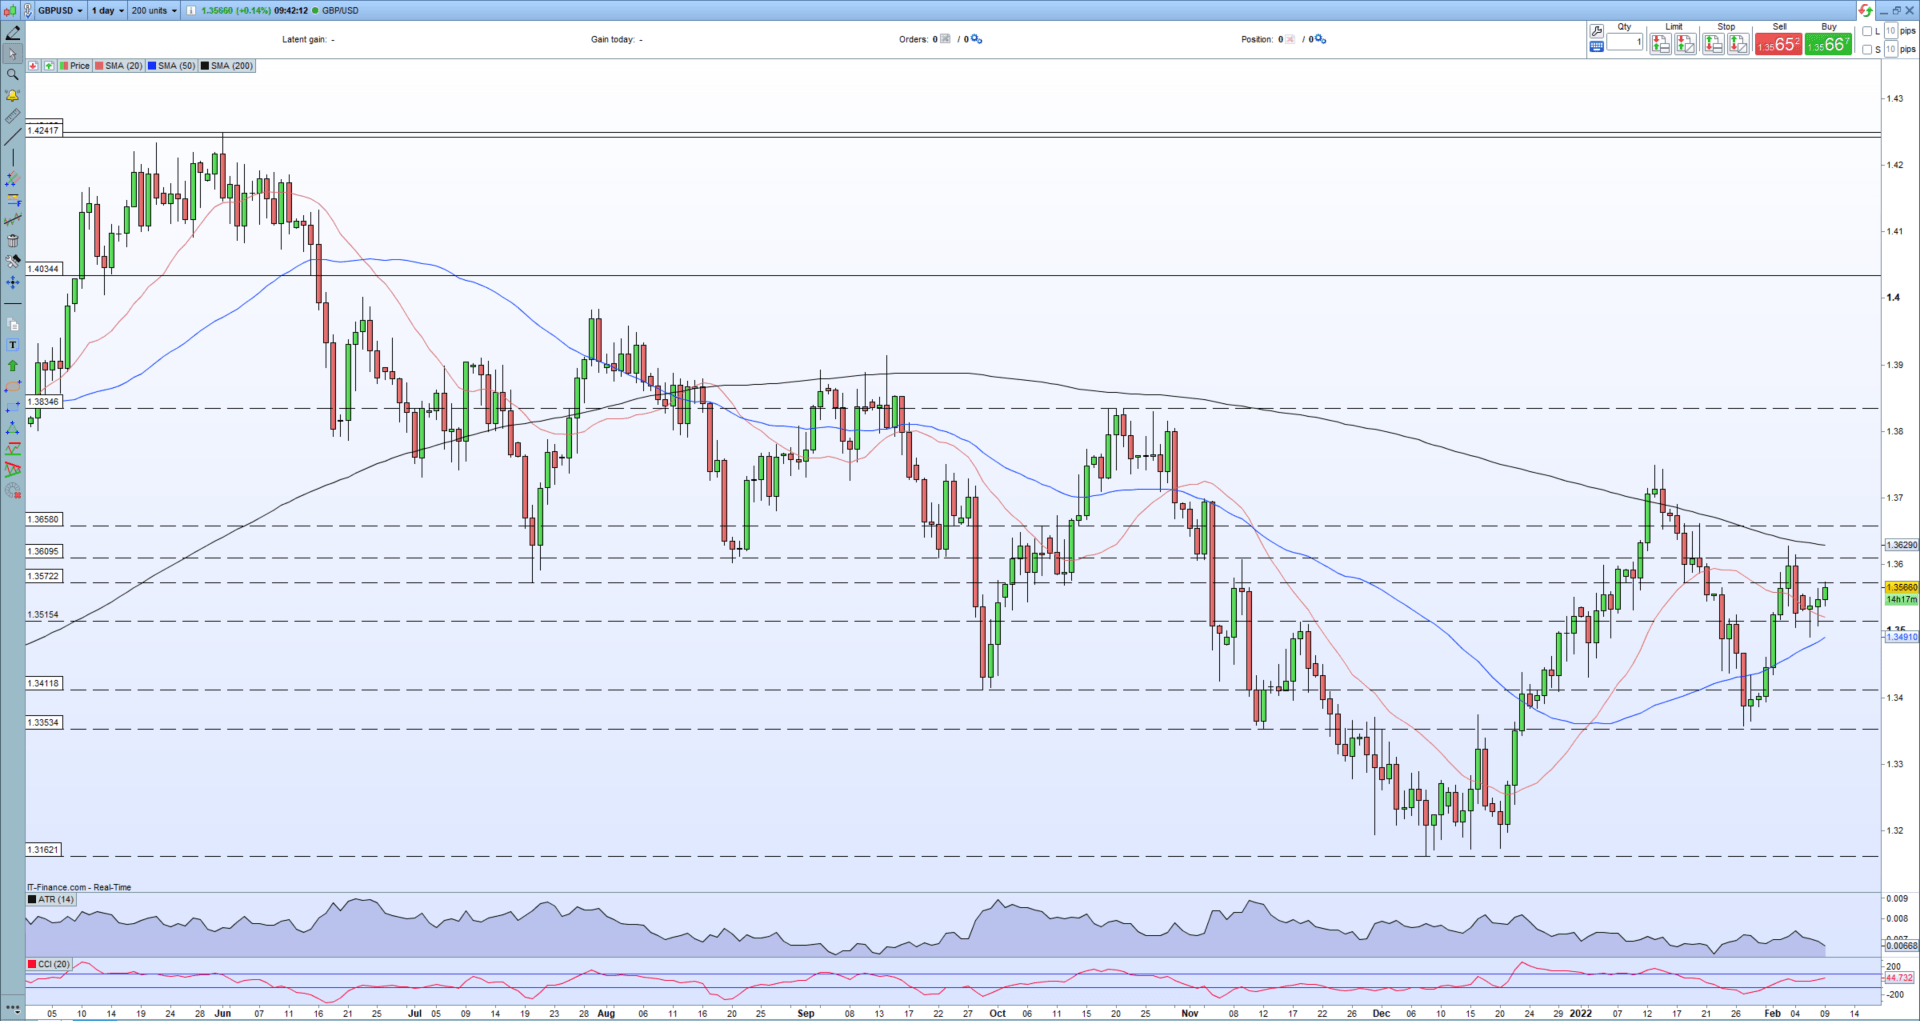
The outlook for GBP/USD remains mixed on the daily chart with a series of lower highs still in place, while the recent series of lower lows was broken at the end of January. The pair are trapped in the middle of all three simple moving averages adding to the mixed outlook. Initial resistance comes is seen around 1.3630 while support is seen at 1.3515.
GBP/USD Daily Price Chart – February 9, 2022
Retail trader data show 54.26% of traders are net-long with the ratio of traders long to short at 1.19 to 1. The number of traders net-long is 6.66% higher than yesterday and 7.89% higher from last week, while the number of traders net-short is 1.02% lower than yesterday and 2.10% lower from last week.
We typically take a contrarian view to crowd sentiment, and the fact traders are net-long suggests GBP/USD prices may continue to fall. Traders are further net-long than yesterday and last week, and the combination of current sentiment and recent changes gives us a stronger GBP/USD-bearish contrarian trading bias.
What is your view on GBP/USD – bullish or bearish?? You can let us know via the form at the end of this piece or you can contact the author via Twitter @nickcawley1.
Be the first to comment