

Euro Talking Points:
Like moths to a flame, Euro bears are back for another fight at the parity handle of EUR/USD. This is a major psychological level and when it was last in-play, in the second-half of 2002, it took about six months for this price to finally give way. And really, this speaks to the power of psychological levels along with the role of sentiment in a market.
So, I want to be clear, I’m not looking for many positive items around the Euro-zone, fundamentally speaking. Instead, I’m simply asking the question as to whether the pair is in a position where it can pose a sustained break-below the big figure and, perhaps further, the .9950 level that came in last month to mark the low.
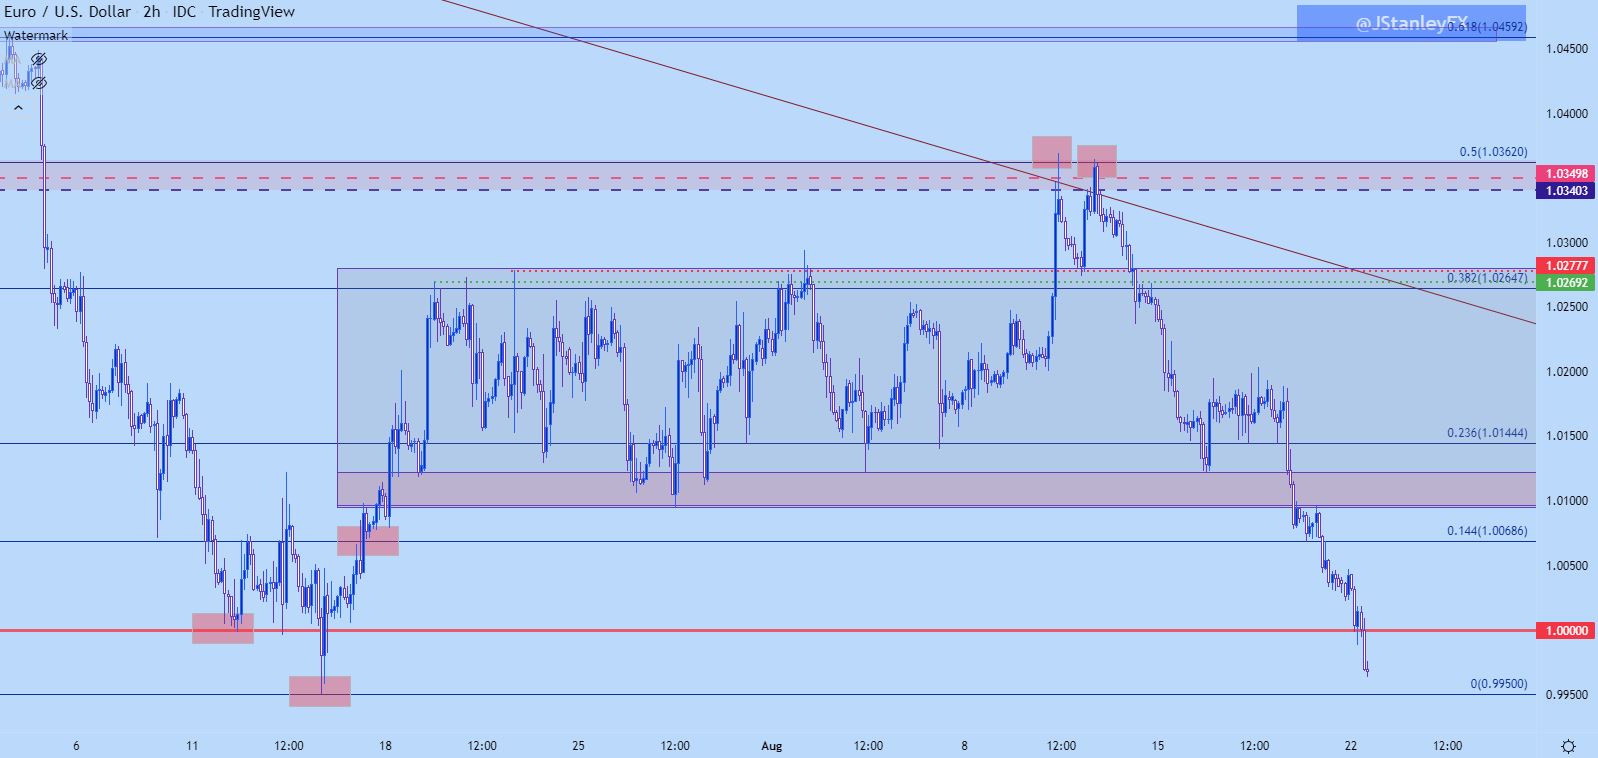
We saw this theme on full display in July. On July 12th, EUR/USD tested below parity, albeit slightly. But, selling pressure dried up and prices retraced by +120 pips before making a second run at the parity level two days later. That time, sellers got about 50 pips below the big figure but, again, selling pressure dried up and prices retraced. But, this time, sellers were offset as buyers built a range via a rectangle formation that lasted for the next few weeks – and through some pretty large headline risk! This held through the ECB’s ‘lift-off’ 50 bp hike and the Fed’s 75 bp hike in July.
EUR/USD: Two Hour Chart – Prior Parity Test
Chart prepared by James Stanley; EURUSD on Tradingview
The range finally gave way on a US CPI print two weeks ago, which brought a quick shot of USD-weakness into the mix, and that allowed EUR/USD to break-out to a key point of resistance at prior support.
That resistance was almost too clean, as it was a zone spanning from the 2017 low of 1.0340 up to the more recent 2020 low that set in May and June around 1.0365. There’s also a bearish trendline in the mix, making it an extremely clean area of confluent resistance.
EUR/USD Daily Chart
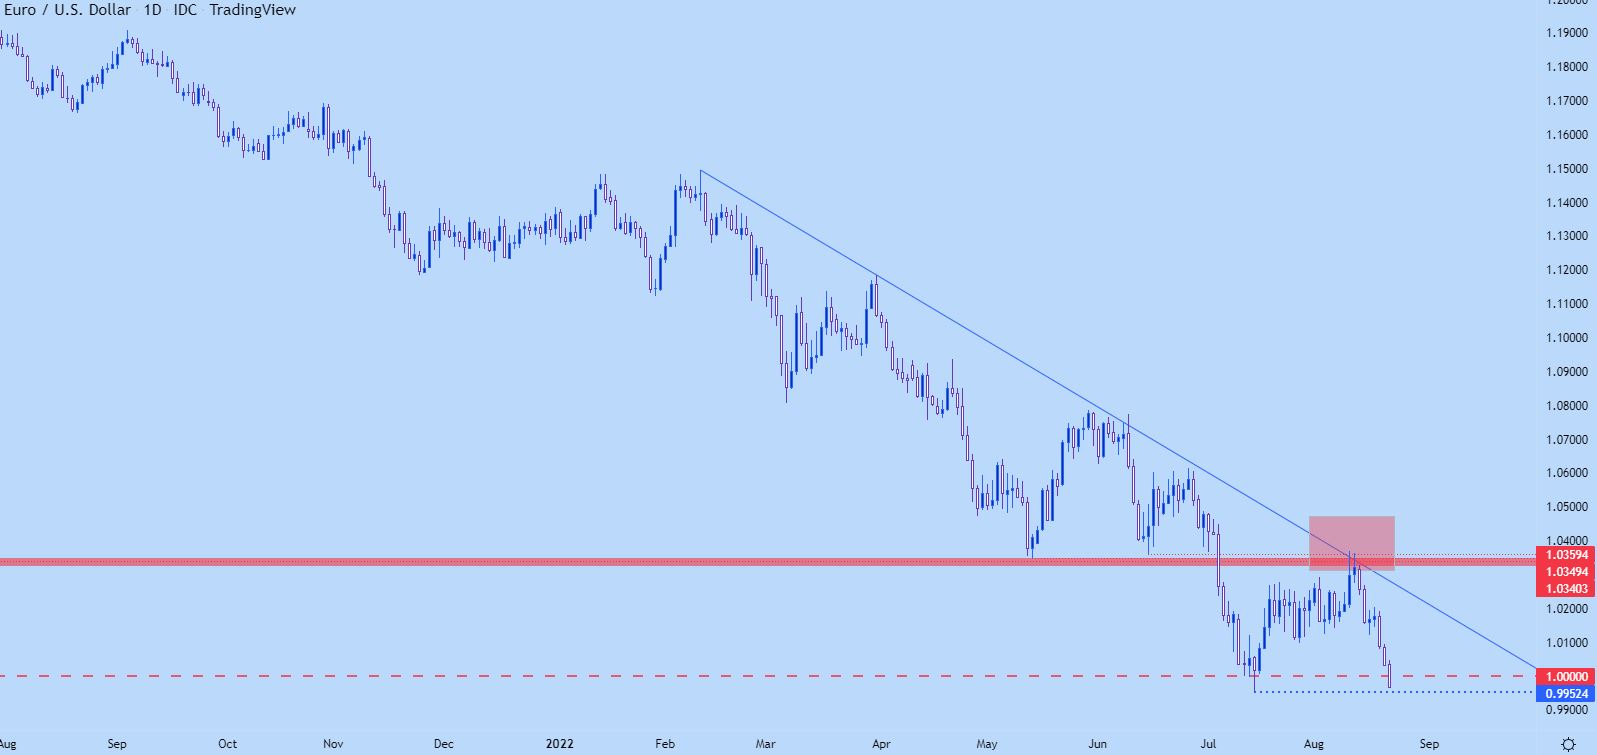
Chart prepared by James Stanley; EURUSD on Tradingview
And this really highlights the aim of confluence, finding multiple reasons that sellers might come back into the matter, which can then lead to a turn. In EUR/USD, this took a couple of days, as EUR/USD shot up to a short-term high of 1.0365 right after that CPI print, and then put in another attempt to break out a day later but fell short, printing a lower-high.
That led to another bearish run, with sellers continuing the series of lower-lows and lower-highs. Price has re-engaged with parity and is now putting in another test-below the parity figure.
The big question at this point is whether EUR/USD can bring enough sellers in below parity to lead to that continued breakdown. Given how consistently the pair has fallen by more than 300 pips over the past couple of weeks, the argument can be made that there’s probably a short-term oversold quality in the pair. Now, that doesn’t preclude bearish continuation – but it does raise the bar for what would be needed to allow for it to happen.
Because those that have been short may be looking to take profits around the parity level. And that can help to stall the move – and as the move stalls – then you can see reversals traders coming into the mix, looking to play a bounce with a support defense around the parity level. And if prices can start to move up a bit, those shorts that are still holding on begin to get squeezed a bit.
At least, in a normal market environment, this is the type of dynamic that usually goes down. The question is whether we’re nearing an abnormal market environment, as inflation is raging in the Euro-zone and the ongoing war in Ukraine complicates matters of economic policy, particularly around energy.
So, I don’t doubt that parity can break. As a matter of fact, I expect that as a very likely probability at some point in the second-half of this year. The big question for me is whether it can break right now or whether it’ll need a bit more time for the market to accept EUR/USD at spot prices that begin with a ‘.9,’ and not a ‘1.’
When the opposite scenario was happening back in 2002, as EUR/USD was gaining acceptance in the global marketplace and Central Banks were actually changing reserves into the Euro, the pair took about six months to finally break-out above the parity level. It started to test parity in June of 2002 and did not leave it behind until December of that year. The trend remained intact, technical criteria remained in-play (support at prior resistance). The big differentiator and the reason for the stalled trend looks to be the psychological level.
EUR/USD Weekly Price Chart (2000-2004)
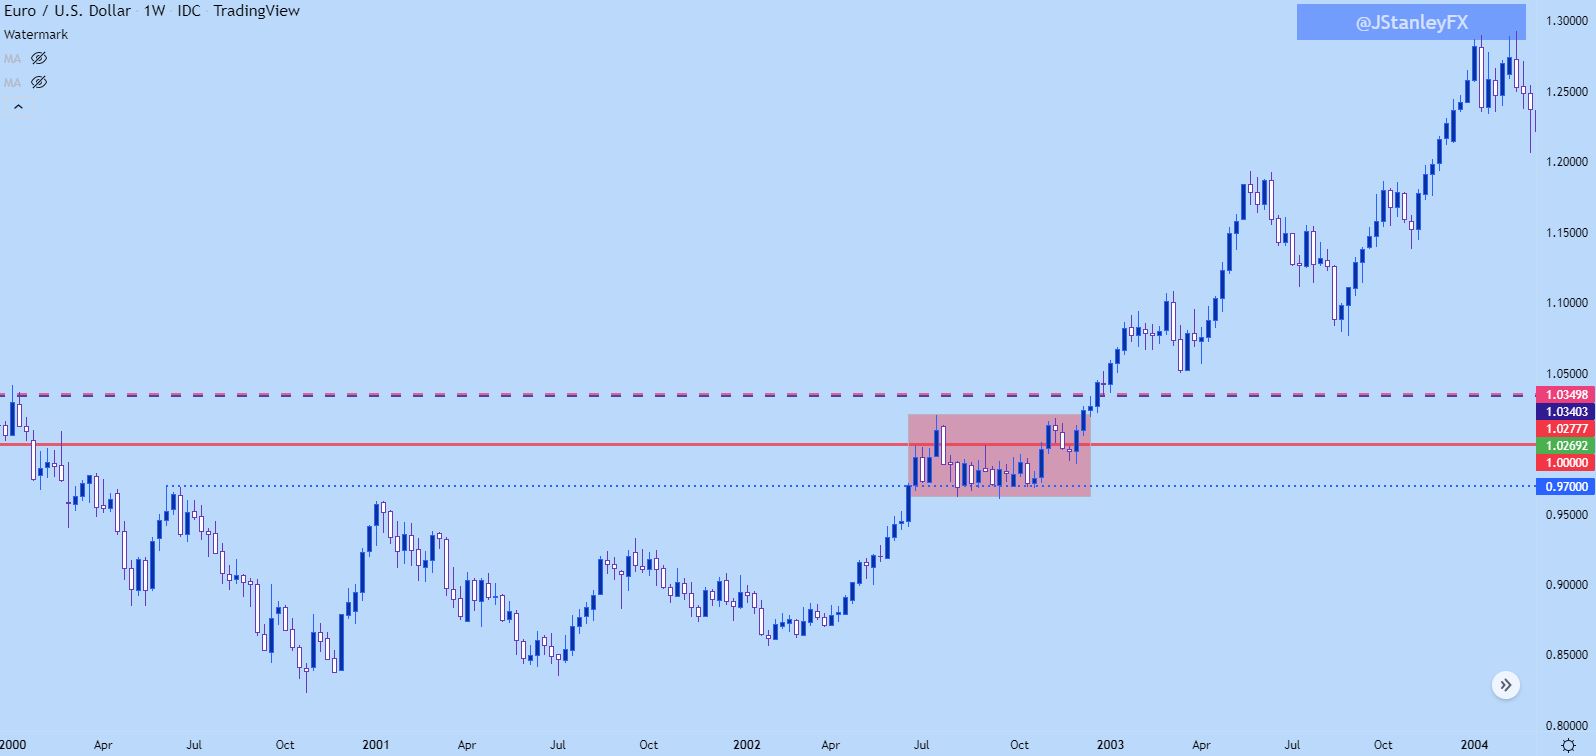
Chart prepared by James Stanley; EURUSD on Tradingview
EUR/USD: Watch .9950
There’s already a spot of interest below the parity handle and that’s the .9950 low from last month. If this price comes into play again, watch how price action moves afterwards. The big question is whether new sellers are coming into the fray or whether that bearish pressure is drying up. But, if we end up with a daily close showing a wick through either .9950 or 1.0000, pullback potential remains, which may lead to a more attractive point of positioning for longer-term bearish plays.
EUR/USD Four-Hour Chart

Chart prepared by James Stanley; EURUSD on Tradingview
EUR/JPY
Getting away from the US Dollar for a minute – both the Euro and Japanese Yen have been relatively weak of late. As the Fed continues to hike, the BoJ doesn’t have the same concern regarding inflation and in Europe, well they don’t really have the same latitude to hike that the Fed does despite dealing with massive inflation.
This has allowed for massive trends to develop in EUR/USD and USD/JPY; but the cross pair of EUR/JPY remains near the middle of a consolidation pattern that’s been brewing for the past few months.
If we are looking at legitimate Euro fears, the short-side of this pair should take on greater attraction. This would have two qualities helping to push: Euro weakness, from the currency itself, but also the possibility of Yen-strength as carry trades further unwind, which can happen during risk-off moods in the market.
We don’t have that scenario at the moment but given what’s happening in the above, this can remain a notable item to keep on watch for this week. EUR/JPY resistance is at the same 137.50 level that’s been in-play since March in various ways. Most recently as resistance to finish last week. There’s another spot a little higher, around the 139.00 handle, confluent with a nearby Fibonacci level. I’m tracking support for the symmetrical triangle at around another notable price of 133.48. A break-below that opens the door for a potentially large move, especially if we’re seeing risk-off flows at the time.
EUR/JPY Daily Price Chart
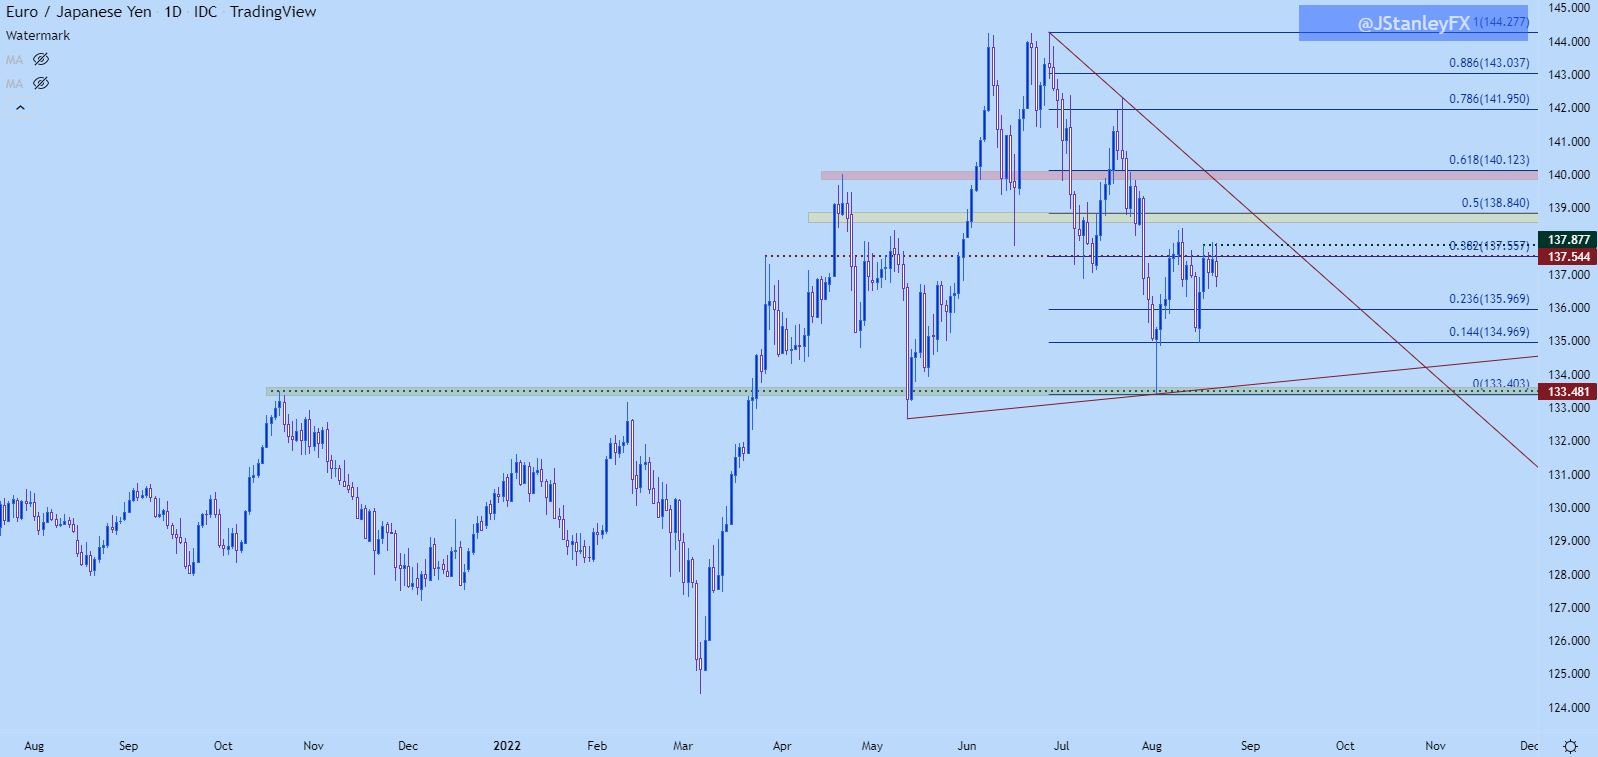
Chart prepared by James Stanley; EURJPY on Tradingview
— Written by James Stanley, Senior Strategist, DailyFX.com & Head of DailyFX Education
Contact and follow James on Twitter: @JStanleyFX
Be the first to comment