

naphtalina/iStock via Getty Images
The Direxion Daily Energy Bear 2x Shares ETF (NYSEARCA:ERY), or the “Fund,” is an exchange-traded fund (“ETF”) that “seeks daily investment results, before fees and expenses, of 200% of the inverse (or opposite) of the performance of the Energy Select Sector Index (the “Index”) which invests in areas like oil, pipelines, and coal.”
Investors should note that:
- The Funds pursue daily leveraged investment objectives, which means that the Funds are riskier than alternatives that do not use leverage because the Funds magnify the performance of their underlying index.
- Each Bear Fund pursues a daily leveraged investment objective that is inverse to the performance of its underlying index, a result opposite of most mutual funds and exchange-traded funds.
- The pursuit of daily investment objectives means that the return of a Fund for a period longer than a full trading day will be the product of a series of daily leveraged returns for each trading day during the relevant period. As a consequence, especially in periods of market volatility, the volatility of the underlying index may affect a Fund’s return as much as, or more than, the return of the underlying index. Further, the return for investors that invest for periods less than a full trading day will not be the product of the return of a Fund’s stated daily leveraged investment objective and the performance of the underlying index for the full trading day. During periods of high volatility, the Funds may not perform as expected and the Funds may have losses when an investor may have expected gains if the Funds are held for a period that is different than one trading day.”
Source: Direxion.
Fund Holdings
Yahoo Finance data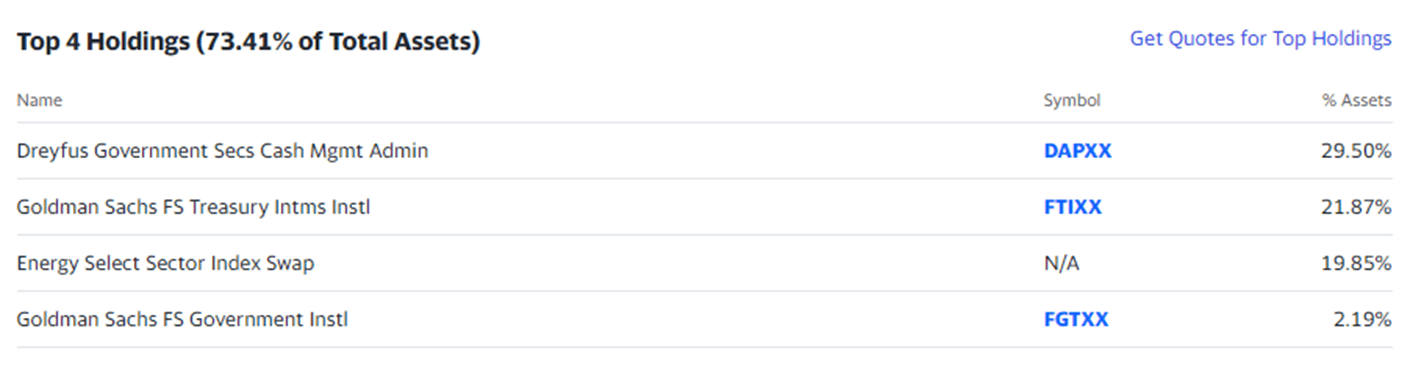
Index Holdings
The “Energy Select Sector Index” is a product of S&P Dow Jones Indices LLC (“SPDJI”) and has been licensed for use by Rafferty Asset Management, LLC (“Rafferty”). Its holdings are from the energy sector which includes the following industries: oil, gas and consumable fuels; and energy equipment and services. One cannot directly invest in an index, which is why the Fund was created.
Direxion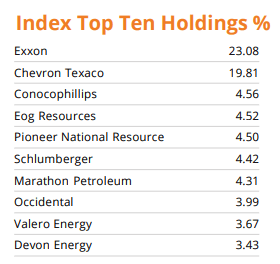
As of 09/30/22.
Fund Expense Ratio and AUM
The Fund charges an Expense Ratio of 0.95% and has Assets Under Management (“AUM”) of just over $50 million.
Seeking Alpha Direxion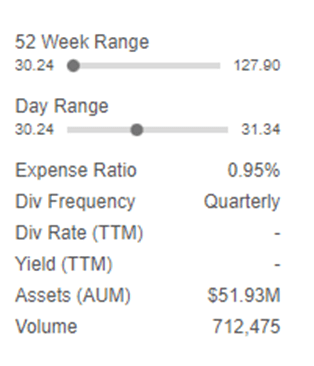
Seeking Alpha grades that ETF Expense Ratio was an “F.”
Seeking Alpha 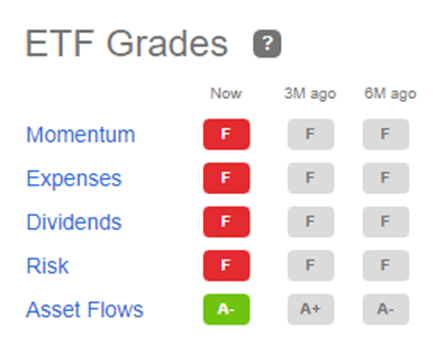
Fund Performance
Since inception in 2008, the total return of the Fund has been nearly -100%. Through March 31, 2020, the Fund sought daily leveraged investment results, before fees and expenses, -300%, of the performance of the Index, after which the leverage was reduced to -200%.
Yahoo Finance data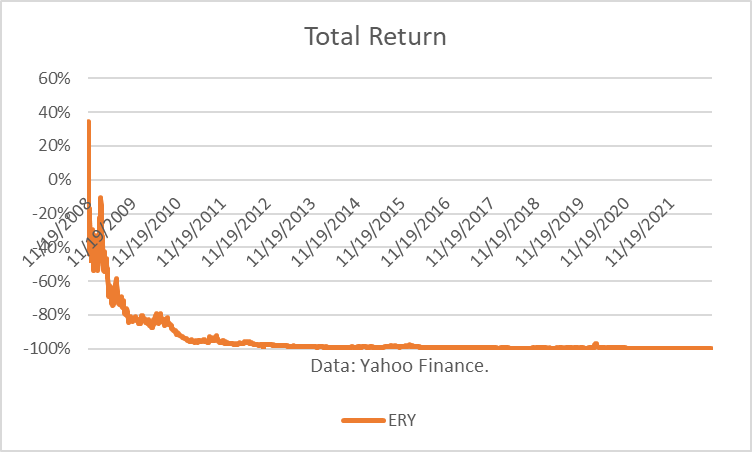
Over the past ten years, the total return of the Fund was -98.74%. That compares to a +227% return in the S&P (SP500TR).
Seeking Alpha
Over the past year, the Fund lost 70.84%, as compared to a loss of 15.54% in the SP500TR.
Seeking Alpha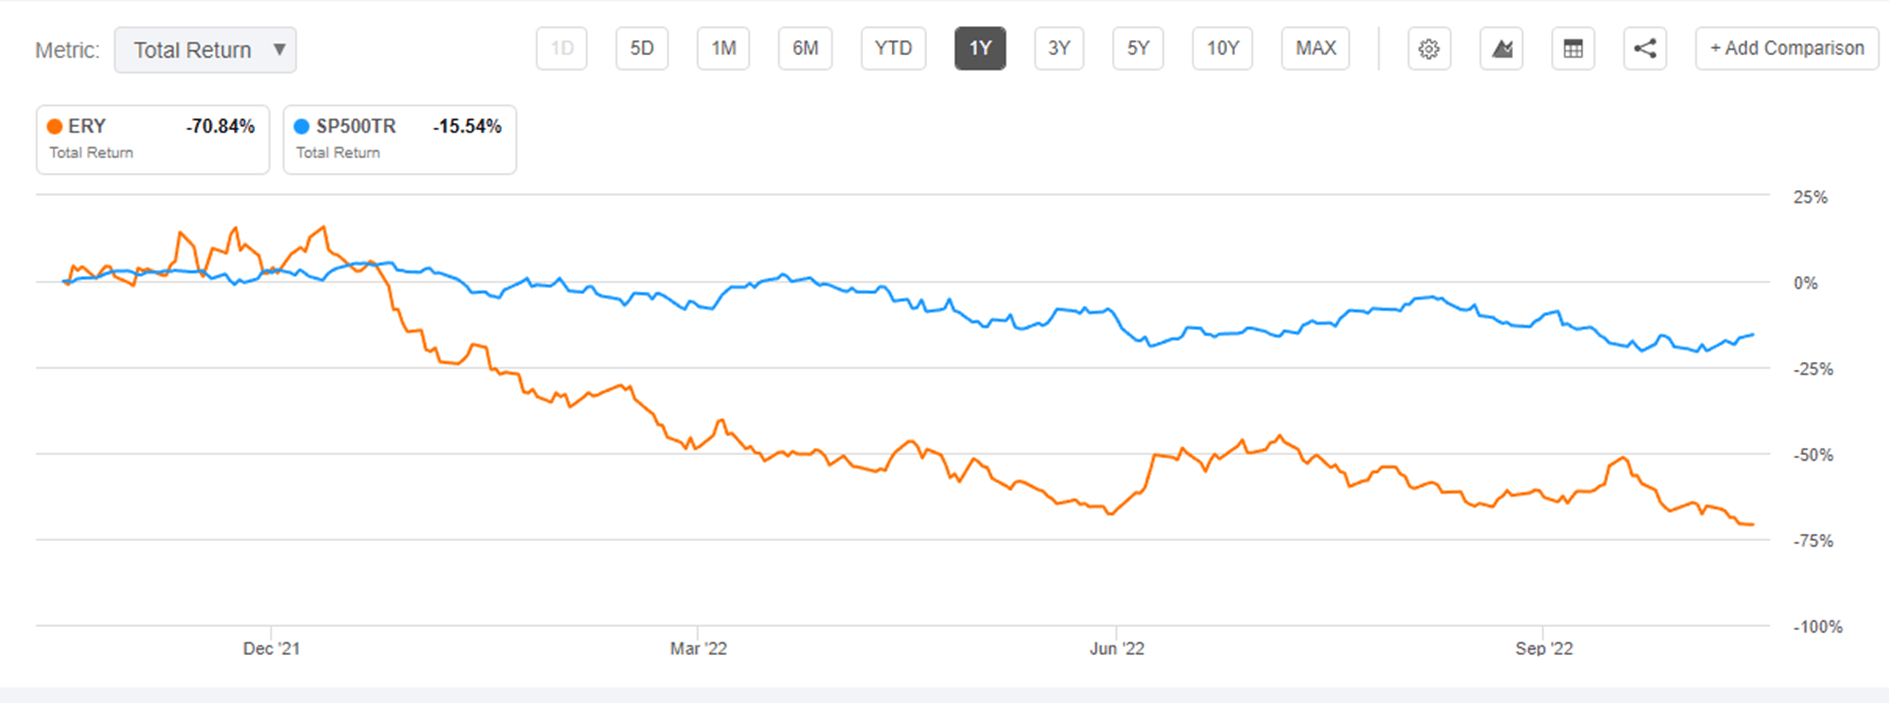
I compared returns of the Direxion Daily Energy Bull 2X Shares (ERX) to those of ERY. (Note: Please see my article, ERX: High Risk for Bull Oil Markets.) Because ERX is bullish and ERY is bearish, one might logically expect the opposite results over time. However, both ETFs have lost almost 100% of their value.
Yahoo Finance data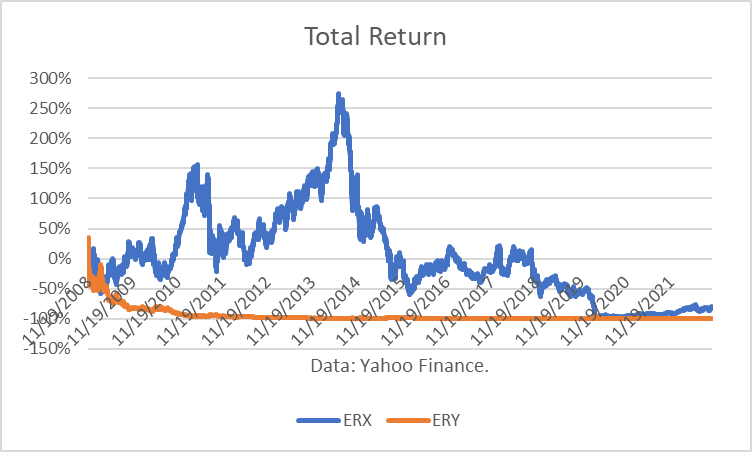
My explanation for this counterintuitive result is that their peak-to-valley drawdowns became too excessive because they a double-leveraged ETFs. For example, if the is a loss of 50%, a 100% return is required to recover that loss. If there is a 90%, a 900% return is required to recover that loss.
This illustrates why the maximum drawdown is such an important risk measure. Large drawdowns become too difficult to recover.
Yahoo Finance data
The Energy Select Sector SPDR ETF (XLE) is a popular ETF for investors in the oil and gas sector with AUM of $33.7 billion. I correlated XLE to NYMEX crude oil futures contract prices from Late 2008 (inception of ERY) and found the correlation of cumulative returns to be 48%, implying a strong influence of crude oil prices on oil & gas sector returns, as expected. The other key variable is production volumes.
Yahoo Finance data
Boslego Risk Services (“BRS”) Futures Trading Process and Results
I employ a disciplined, three-step process for deciding when to enter NYMEX futures trades, how large they should be, and when to exit trades. They are:
- Supply/Demand/Price Projections
- BRS Behavioral Finance Signal
- Risk Management and Trading Tactics.
Each of these steps are summarized below.
1. Supply/Demand/Price Projections
Every month, the EIA publishes its Short-Term Energy Outlook (“STEO”). The tables include supply, demand and inventory projections for the world oil market, taking into account their latest assessments of news and data. Specifically, they provide a projection of monthly OECD commercial oil inventories for up to two years into the future.
I have developed a linear regression model between OECD oil inventories and WTI crude oil prices for the period 2010 through 2020. As expected, there are periods where the price deviates greatly from the regression model. But overall, the model provides a reasonably high r-square result of 82 percent.
NYMEX,BRS data.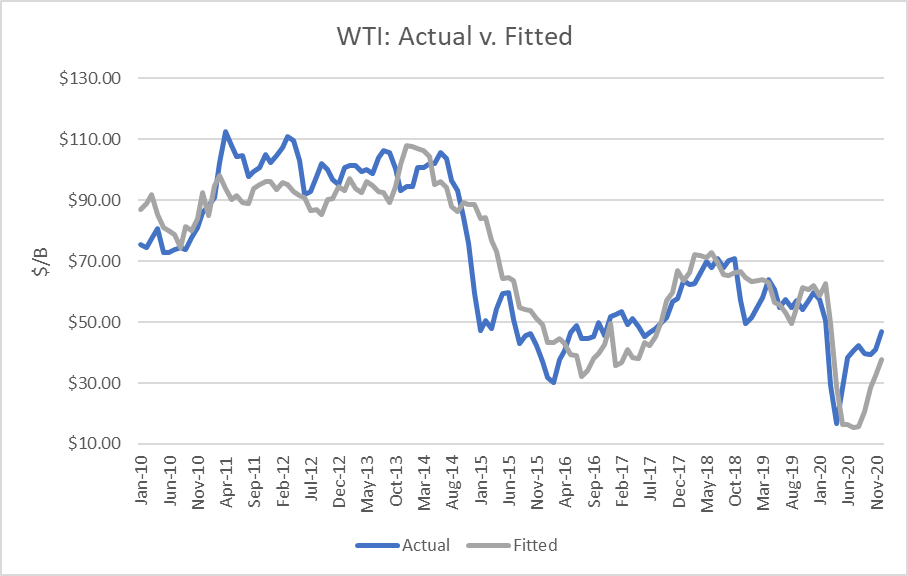
I use the model to assess WTI oil prices for the EIA forecast period and compare the regression equation forecast to current NYMEX futures prices. The result allows me to assess whether NYMEX futures prices are fundamentally overvalued, undervalued or fairly valued.
Similarly, the EIA provides projections of Natural Gas Storage monthly for up to two years forward. I will use my natural gas model to generate price forecasts. That result will also allow me to assess whether NYMEX futures prices are fundamentally overvalued, undervalued or fairly-valued.
2. BRS Behavioral Finance Signal
The first step is critical to enabling me to develop a conviction of where I think the markets are going. However, there are always uncertainties and new developments to take into account. Furthermore, I have found that energy futures market prices exhibit “excess volatility,” meaning they move much higher and lower than the fundamentals would imply.
Robert J. Shiller, Nobel economics laureate (2013), published a paper in 2003, “From Efficient Markets Theory to Behavioral Finance,” in which he discusses the failure of the efficient market theory to explain stock market prices and the “blooming of behavioral finance.” He proved that stock market prices exhibited “excessive volatility” from what would be expected, if market prices behaved according to the efficient market theory.
In particular, Shiller describes one of the oldest theories about financial markets, which he calls price-to-price feedback theory. Essentially, he argues that the emotions of greed and fear drive market prices far too high on the upside, and much too low in downturns.
Journal of Economic Perspectives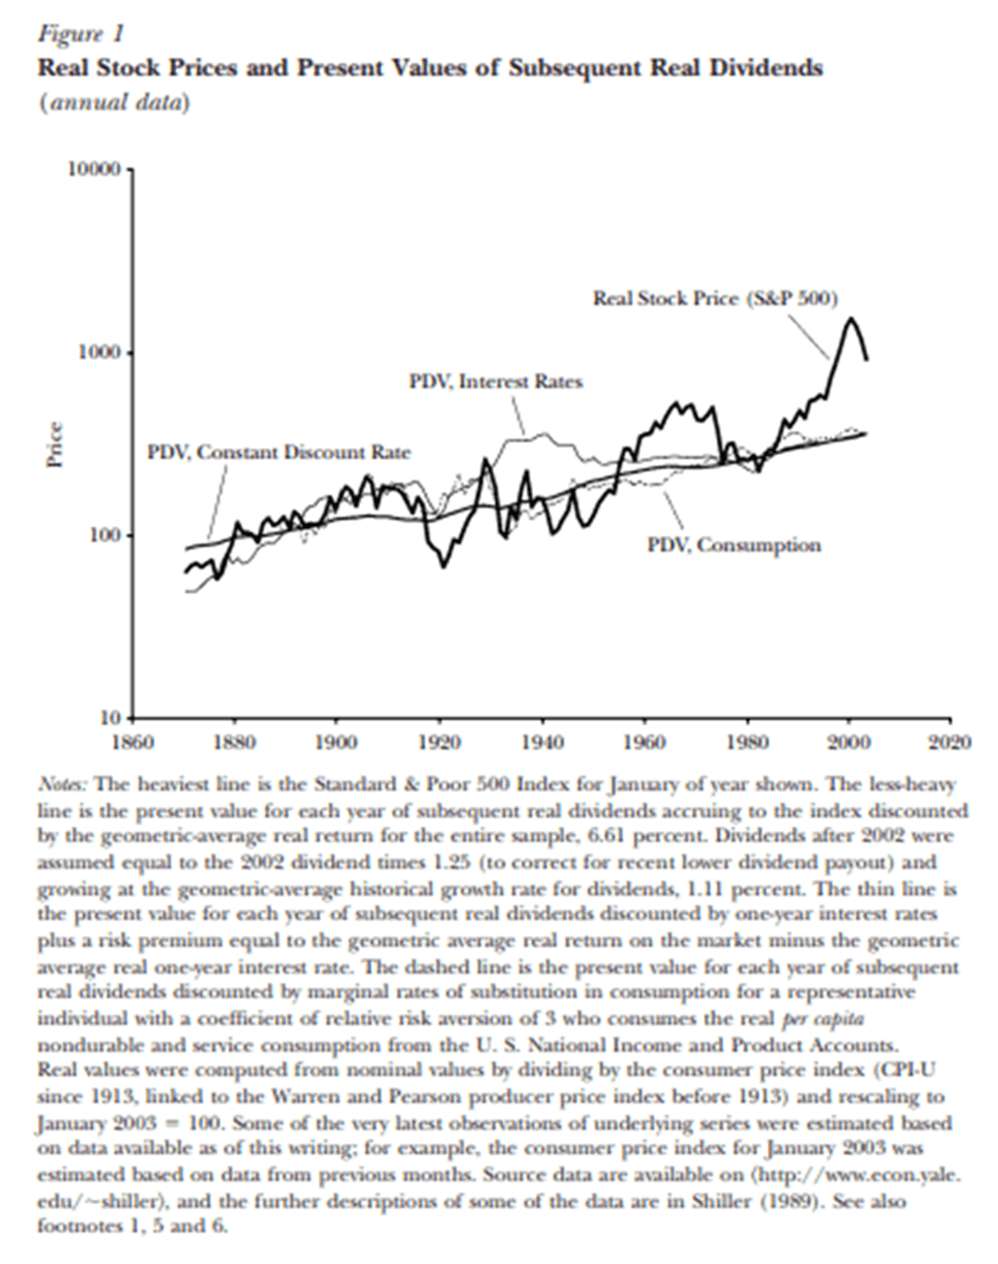
In his book, Irrational Exuberance (2000), Shiller argued that “market feedback, transmitted by word-of-mouth as well as the media, was at work in producing the bubble we were seeing then. I further argued that the natural self-limiting behavior of bubbles, and the possibility of downward feedback after the bubble was over.” He created a feedback model to describe price changes with a distributed lag and compared them to price changes, if they had behaved like a random walk, as held by the efficient markets’ theory.
Feedback Model Formulae.
Journal of Economic Perspectives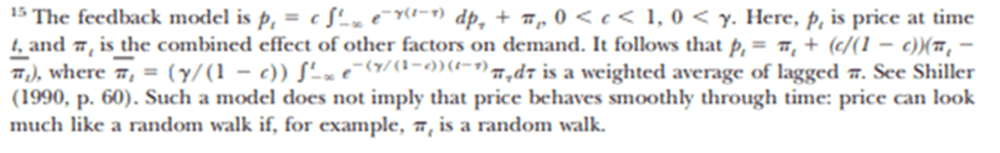
(Source: Journal of Economic Perspectives-Volume 17, Number 1-Winter 2003-Pages 83-104.)
I developed and tested hypotheses to try to quantify conditions that might make investors feel greedy or fearful. And it turns out that the size of market gains and losses, combined with the speed of them, does a pretty good job in determining when to be long (bullish), when to be short (bearish), and when to be out (neutral). There are other unique positioning techniques built into my model, such as a position adjustment based on market price volatility for risk control.
My approach was to separate emotions from investment decisions by running an algorithmic trading (AT) strategy that provides systematic, quantitative signals. The benefit of an AT strategy is that it can be back-tested under many different market conditions to determine the potential risks and returns of its future use. While such a strategy cannot guarantee future results, it can show how it would have performed in the past, unlike discretionary strategies, dependent on the skills of a trader. And at the least, it can eliminate strategies that would have performed poorly in the past.
My simulation results are presented in this article. Every day, I update the AT strategy for NYMEX WTI crude oil (“CL”), RBOB Gasoline (“RB”), Heating Oil (“HO”) and Natural Gas (“NG”). The outputs provide to me a signal of whether to be long, short, or neutral, and the relative strength (i.e., -100%, -50%, 0%, 50% or +100%).
I combine the results from Steps 1 and 2 to decide what position(s) to take and how large they should be, relative to my trading account size.
3. Risk Management and Trading Tactics
My monthly price projections in Step 1 will generally not change unless there is a major development which is not assumed in the projections. However, the daily valuations will change based on changes on futures market prices.
The price signals in Step 2 generally do not change daily, but they have changed more frequently than in past years. My approach is geared toward medium-term positioning, not intraday trading.
But as mentioned above, the energy futures markets in 2022 have presented unique complications and opportunities because of the ongoing uncertainties surrounding Russian production and export levels, bans by the EU and US, releases of Strategic Petroleum Reserves, actions of central banks to fight inflation, and OPEC production strategies, the range of uncertainties is high and the news flow is constant, and the news reports are often contradictory in their implications for oil and gas prices.
To control risk and achieve profits, I have found it necessary to take smaller positions than I would have taken in the past and to take profits more frequently, when they are earned. Heightened volatility implies that profits may not last long before prices swing in the reverse position. Therefore, my positions have changed more frequently than in the past and holding periods are sometimes only a day or a few days.
I began trading a model NYMEX futures account and publishing results in my Seeking Alpha Marketplace service, Boslego Risk Services, on June 23, 2022 through October 21, 2022. My total return for trading NYMEX WTI crude only was 30.8%. Out of 18 trades, 16 were profitable, for a win ratio of 8 9%.
The return for a long-only NYMEX crude position over the same period was -18.7%. The return from a long-only ERY position (i.e., short energy sector) was -38.8%.
Yahoo Finance data, NYMEX, BRS
My Maximum Drawdown (“MD”) for trading NYMEX WTI crude only was 8%. The MD for a long-only NYMEX crude position over the same period was 30%. The MD from a long-only ERY position (i.e., short energy sector) was 47%.
Yahoo Finance data, NYMEX, BRS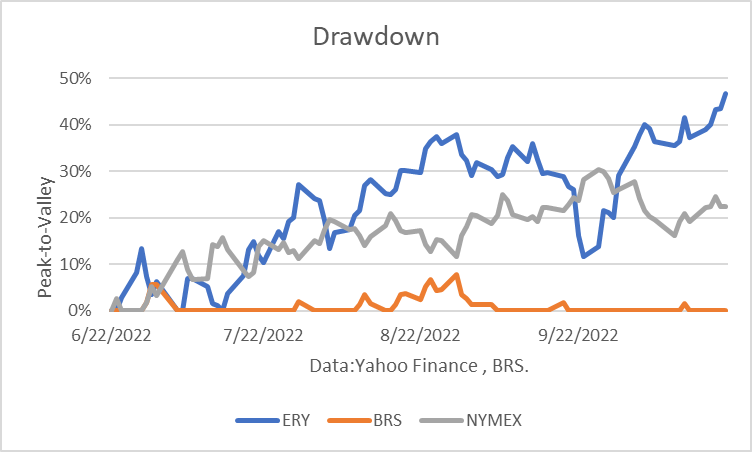
Conclusions
ERY is an ETF that provides a leveraged short position on the oil sector. For traders or short-term investors who do not want to manage a futures market account, this ETF may be a useful means for “shorting” the market. However, oil trading is not for amateurs and is highly risky.
The charts above also illustrate why not to take a long-term position in ERY. It would almost certainly lose.
Finally, I provided and explanation of my process. The results speak for themselves.
Be the first to comment