


Blue Planet Studio/iStock via Getty Images
Each month, I will make available my updated Equity CEF Performance spreadsheet, which often identifies opportunities among equity CEFs. This past weekend, the John Hancock Tax-Advantaged Dividend Income fund (NYSE:HTD) was identified as an undervalued opportunity and has gone from $24.57 (see below) to $25.56 in just 4 trading days.
Below is your YTD Equity CEF Performance spreadsheet link updated through March 25th, 2022:
2022CEFPerformance.3.25.22.xlsx
Here’s how Barron’s started this weekend’s (March 26) lead article:
Stocks Shrug Off War, Inflation And The Fed, But For How Long?
Don’t go looking for the “good news” that was responsible for the week’s gains—there wasn’t any, at least not the traditional kind.
That pretty much sums up the way I feel and I’m wondering, after each day in which the S&P 500 (SPY), $452.69 current market price, goes up as bond prices go down, will we eventually come to an October of 1987 moment in which bond yields look way more attractive than the potential for more stock market gains.
I’m not saying we will see a stock market crash like we saw in Oct. 19 (my birthday BTW) 1987, since the alternative back then were low-risk bonds yielding more like 10%, but when shorter term three-year Treasury bonds now offer 2.5% yields, you wonder when big money might just say to themselves, “Why take the risk in equities when treasuries finally yield more?”
Because anyone looking out over the next year and wondering how the equity markets are going to keep appreciating in the face of rising rates, rising inflation and rising tensions around the world, might just come to the conclusion that bonds are starting to make a little more sense after such a historic sell-off.
Heck, I’m just hoping to see some stabilization in bonds finally.
Equity CEFs
I’ll be back with updates to the Equity CEF/ETF Portfolio, but one equity CEF that popped out at me from looking at Sheet 3 of the Equity CEF Performance spreadsheet is the John Hancock Tax-Advantaged Dividend Income fund (HTD), $24.57 current market price.
If you look near the bottom of Sheet3, you’ll see HTD’s market price is down -4.5% YTD even as its NAV just hit a 52-week high. So with an -8.4% NAV/MKT performance difference (shown as green), that spells opportunity.
1-Year HTD NAV vs MKT price graph:
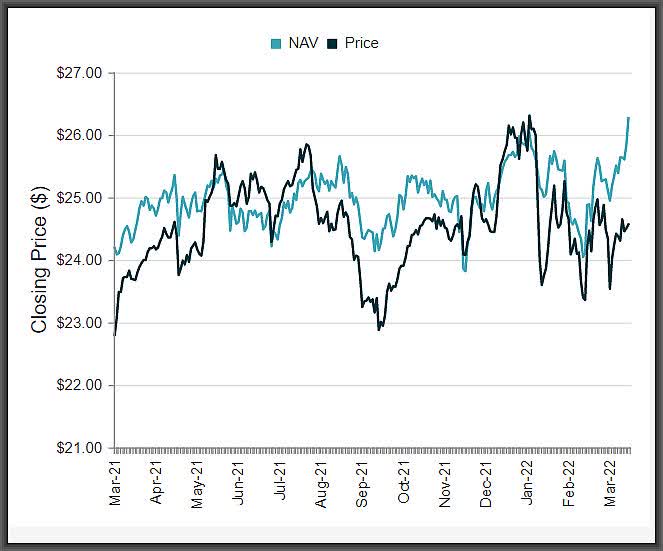
CEF Connect
I’m going to upgrade HTD from a hold to a buy at a -6.5% discount and add to the position here at $24.57 current market price.
This will be reflected in the Equity CEF/ETF Portfolio for tomorrow. HTD is riding the sweet spot of being a mostly a leveraged utility stock/preferred (60.4%) focused fund that also includes financials (22.9%) and energy (9.8%) stocks/preferreds.
I can only guess that it’s the preferred and corporate bond exposure that might be holding back HTD’s market price at about a 30% overall weighting in the portfolio, but obviously preferreds and corporates in utilities, energy and financials are not having a major impact on HTD’s NAV performance, up 3.9% YTD. HTD also offers a 6.7% market yield paid monthly.
Finally, how do I know this has been a mostly ETF rally over the last couple weeks? One, because big assets coming out of bonds is generally not going to go into CEFs due to their much lower liquidity compared to major market ETFs and two, when I update the NAV and market price performances in the spreadsheets each week, I see more and more equity CEFs going from green, i.e. outperforming the S&P 500 (SPY), to red and thus underperforming SPY.
Please utilize the Equity CEF Performance spreadsheet link above as it will often show opportunities among equity CEFs that you won’t see anywhere else.
Be the first to comment