


Tatsiana Frolova/iStock via Getty Images
It has been almost a year since I published the last article I wrote where I took a hard look at the valuation of the Vanguard Total Stock Market ETF (NYSEARCA:VTI) and set some price targets that at the time some readers thought were far too conservative. That article was VTI: How To Use The S&P 500’s Valuation To Find Suitable Entry Prices.
At that time Vanguard had told us that VTI’s P/E ratio was 24.3. As we all know, December 31, of 2021 turned out to be the peak of the COVID-19 era bull market. The year that followed has been one of slow but steady deterioration of VTI’s price punctuated by bear market rallies followed by renewed stock price slumps.
Now as we head towards a new year, it’s time to take another look at VTI’s current valuation and to do some hard thinking about the question of whether market conditions have changed enough over this past, very challenging year to make VTI a compelling buy. This is particularly important this December as the market has just staged yet another Santa Claus rally, one that has many investors wondering if they have seen true bottom or if this is just another bear market rally.
VTI Key Metrics
VTI is the ETF share class of the Vanguard Total Stock Market Index Fund, which is the largest total stock market fund in the world. The fund/ETF combination currently has $1.2 Trillion dollars’ worth of assets under management. It is offered by many company’s 401K plans and is the ETF most frequently recommended to new investors by pundits who tell us that investing in index funds is more likely to be a successful path to a secure retirement than picking stocks.
VTI Holds over 4000 stocks but Its Historic Performance is Very Close to that of the S&P 500
Because VTI is technically a share class of a mutual fund, Vanguard does not have to give us up-to-date metrics for it, but instead gives us the data required of a mutual fund which can be as much as six weeks out of date. According to that data, which Vanguard tells us is accurate as of 10/31/2022, VTI holds shares of 4,028 companies. This wide diversification is why it has become fashionable for advisors to recommend it over the S&P 500 ETFs like the Vanguard S&P 500 ETF (VOO) or the SPDR S&P 500 Trust ETF (SPY).
However, as I have proven by going into great detail in several previous articles, the market cap weighting of VTI is such that its large cap stocks make up such a huge proportion of its total value that the contribution to its performance of the 3,500+ stocks it holds that are excluded from the S&P 500 is tiny. It is so tiny, in fact, that the performance of VTI has tracked very closely with that of the S&P 500 for decades. That has been true this year, too, as you can see from the chart below.
VTI and VOO Performance 2022 YTD
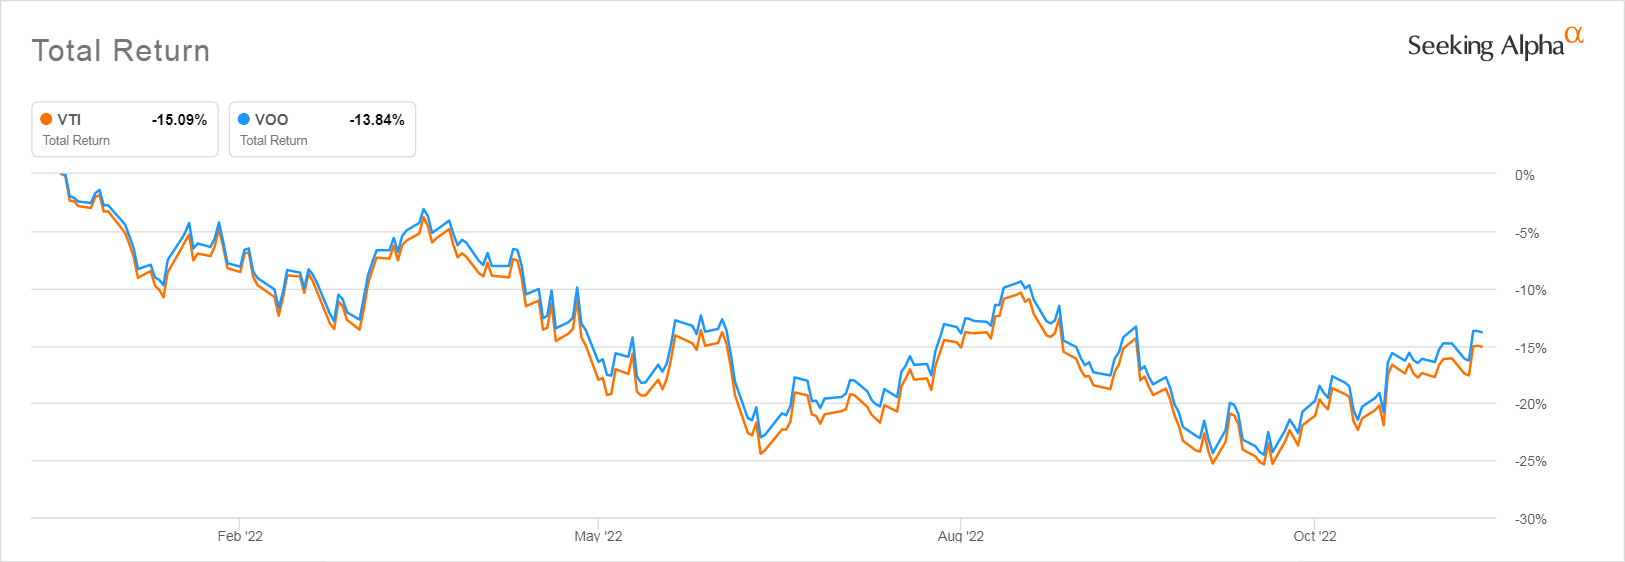
Seeking Alpha
If we go back further, to the period before the FAANG stocks began to dominate market performance, VTI performed even better than the S&P 500, which was the case after the dot.com crash. On a price basis VTI outperformed VOO from January 2004 to December 31, 2007 by a full 6%.
Vanguard currently provides the following metrics for VTI:
Current VTI Fundamental Metrics from Vanguard
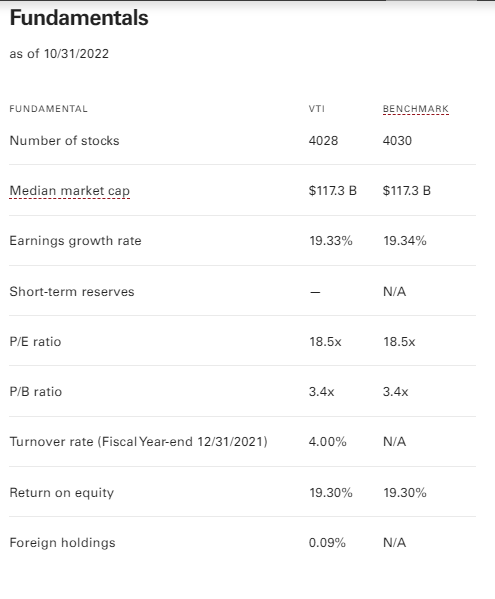
advisors.vanguard.com
Vanguard also tells us that VTI’s “Returns” are -14.58% YTD as of December 2, 2022.
How Have VTI’s Metrics Changed YTD?
Vanguard provides no other information comparing VTI’s current data with that reported at the beginning of the year. But fortunately we can recover older data as I had put screenshots of VTI’s Fundamentals data in my article published last year. You can see it below.
VTI Metrics as of December 31, 2021
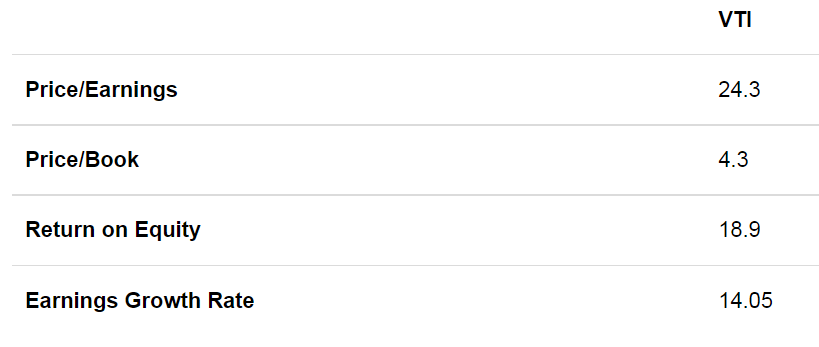
advisors.vanguard.com
With this data we can easily compute the changes in the few fundamentals Vanguard provides for us — though we are still hobbled by the fact that Vanguard only presents data current of 10/31/22 in early December.
Changes in VTI Fundamentals 12/31/21 – 10/31/22
| 12/31/21 | 10/31/22 | Difference | |
| Price/Earnings | 24.3 | 18.5 | -23.87% |
| Price/Book | 4.3 | 3.4 | -20.93% |
| Return on Equity | 18.9% | 19.3% | 2.12% |
| Earnings Growth Rate | 14.05% | 19.33% | 37.58% |
As would be expected with the significant decline in price that occurred YTD the Price/Book ratio has improved. However, this is a metric that has to be taken with a grain of salt given that it is more meaningful for 20th century companies where there was a huge investment in physical plant. With so many companies now outsourcing manufacturing and having intellectual property being a huge part of their value, book value becomes much harder to estimate and figures given can be very misleading.
Return on Equity increased slightly and is high enough to suggest overall market health.
Most striking is that the overall earnings growth rate of the stocks in VTI has increased dramatically. This would seem to augur well for future performance, but you have to remember that earnings plummeted during 2020’s lockdowns and that the last two years have therefore seen earnings of many stocks rise from an extreme low.
More to the point, this data is stale. After companies reported third Quarter earnings, estimates for 2022’s total earnings have fallen and the earnings growth rate most analysts are predicting is somewhere in the mid-single digits. Yardeni Research’s most current report, dated November 30, 2022, tells us that analysts are expecting 2022 annual earnings for the S&P 500 to grow only by 5%. Yardeni Research themselves predict they will only grow by 4.7%.
Given that VTI’s price tracks the S&P 500 pretty closely it is very likely that by the time Vanguard provides us with data as of November 30, 2022, the earnings growth rate of VTI’s holdings will also be far more modest.
This brings up another point that always annoys me about Vanguard’s Fundamentals. Unlike other fund providers, Vanguard does not tell us what methodology it uses to compute these figures. Are they an average, a weighted average, a harmonic average or what? Different kinds of averages applied to a market cap weighted index will give us very different figures.
VTI’s Dividend Suggests Continuing Overvaluation
VTI’s trailing 12-month yield is 1.53% according to Seeking Alpha. It has a general history of dividend growth, with the exception of the period around 2008 and 2020 as you can see from the chart below.
VTI Dividend History
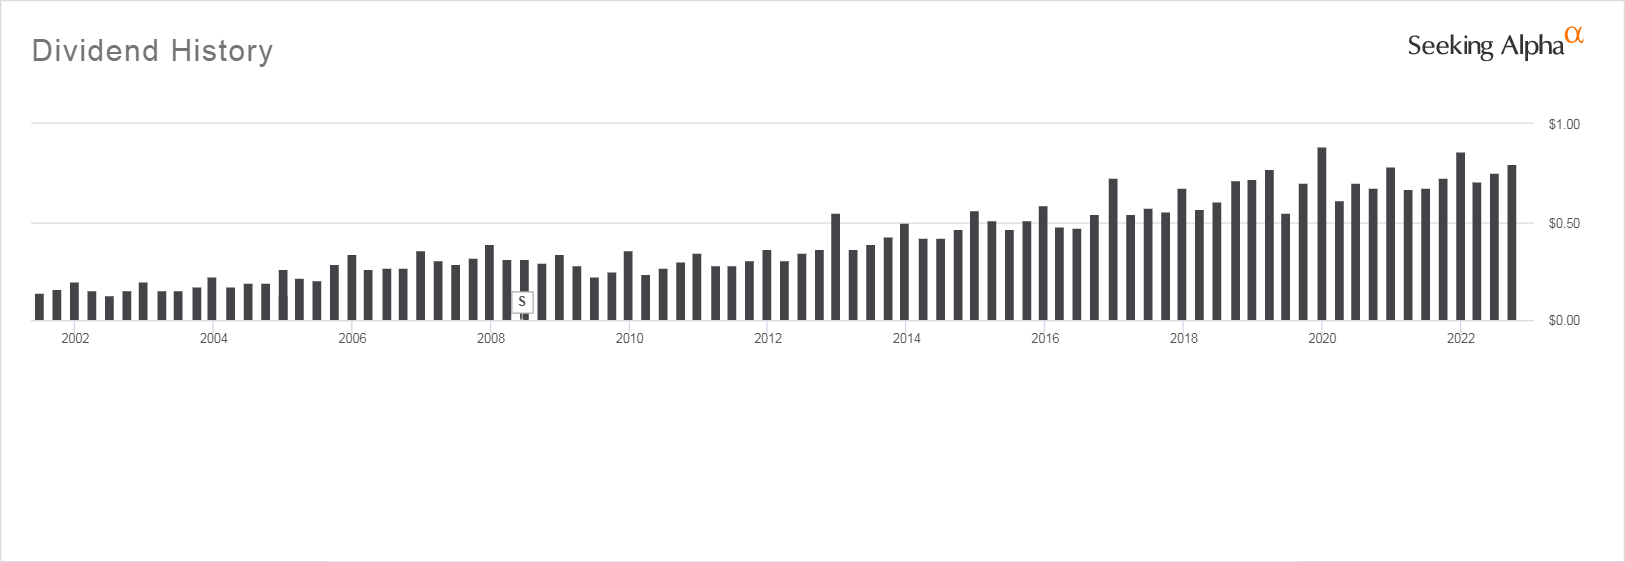
Seeking Alpha
Its dividend yield is still low compared to its historical yields. It is not an investment you would buy and hold if your focus in investing was to maximize income. From 2004 to 2016 and as recently as 2018 its dividend yield was above 2%. For those who use dividend yield as a valuation metric, this suggests that it is still a bit overvalued.
Where Is VTI Headed In 2023?
Vanguard also gives us no forward earnings estimates based on analyst projections. This makes it very hard to make any sensible estimates of how VTI might perform going forward. Fortunately, it is possible to improve our estimates by going back to the strategy I laid out in my earlier article, which is to use the close correspondence of VTI’s price action to that of the S&P 500 use S&P 500 numbers, which are reported in far more detail, to roughly estimate VTI’s future performance.
I have laid out how I use the S&P 500 estimates to calculate VTI’s valuation and price targets based on earnings projections in these two articles: Value-Based Price Targets For VOO Under Different Possible Scenarios and VTI: How To Use The S&P 500’s Valuation To Find Suitable Entry Prices. Note however that Fastgraphs, my source for market data, no longer gives us data for the S&P 500 but instead substitutes that of SPY, which I believe it calculates on its own. Its earnings forecasts for SPY often vary unpredictably from day to day. Hence I have had to look for other reliable sources for the S&P 500’s projected annual earnings.
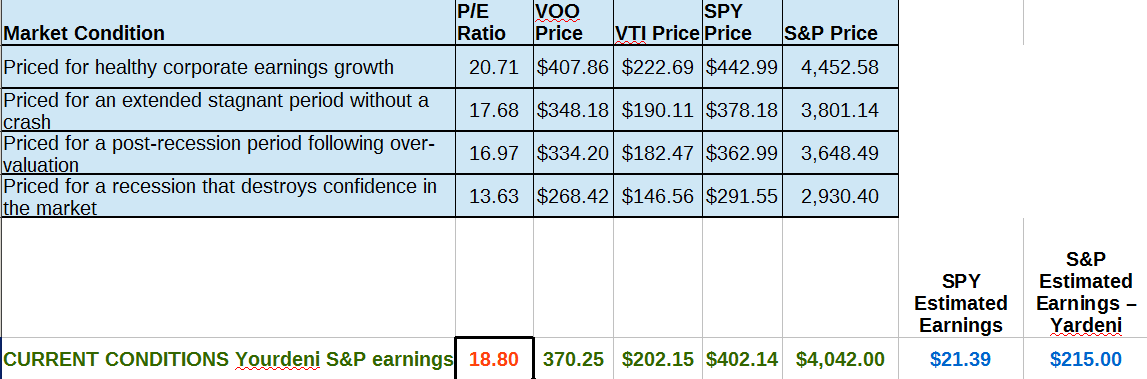
As explained in my previous articles, I also studied what the average P/E ratios of the S&P 500 have been over sustained periods when the overall market had clearly defined differing characteristics over the past 22 years. These included periods when the market was priced for healthy earnings growth, periods when the market sustained an extended stagnant period without a crash, a period after a bout of severe overvaluation after the dot.com bust, and finally, during the period from 2008-2013 where a severe recession had destroyed confidence in the market.
I then calculated what price/earnings combination based on current earnings forecast for VTI, VOO, and SPY, would correspond to the average P/E ratio that prevailed under these differing market conditions.
How Helpful Were These Price Targets Been This Year?
At the time I came up with my price targets for these ETFs based on the P/E ratios of past market conditions, investors had become convinced we were in a period of a “New Normal” where historical P/E ratios no longer mattered. As we now know, they were wrong. The P/E ratio of the market dropped below the historical P/E ratio characterizing a market with healthy corporate earnings growth and for a stagnant period without a crash. It continued dropping until by October the S&P 500’s P/E based on what were then the S&P 500’s current earnings estimates had dropped to the level prevailing for a post-recession period following overvaluation. At that time I began cautiously investing new money in both VOO and VTI which is what my personal investment strategy statement tells me to do. I do not sell long-term holdings in these ETFs except when there is a tax loss harvest opportunity as I want them to remain the main holdings of my stock portfolio.
How The Current P/E Ratio of VTI Computed With My Data Stacks Up Against Historical Valuations
Below you will see what the current estimated price targets for VOO, VTI, and SPY would be under the various market conditions discussed above, based on current earnings forecasts for the S&P 500. I am using the 2022 S&P500 earnings that Yardeni Research is forecasting, as I have found them to be the most useful.
In the table below, the section in blue computes a target price for each of the ETFs tracked here that would yield the average P/E ratio that corresponds to each of the four different market conditions we have been discussing.
Price Targets for VTI and Other Broad Market ETFs Based on Current S&P 500 Price and Yardeni Research 2022 Earnings Estimates
The Author
I would say that we are currently in a period where market conditions are most like an extended stagnant period without a crash. If that is true, VTI looks slightly overvalued based on current estimates and its current price, though unlike the situation we were in at the end of 2021, it is not so overvalued as to be a poor investment. The only reason you might think that would be if you are investing for the short term — 10 years or less — and believe that the market won’t experience a period where corporate earnings growth is healthy over that span. If you are investing for a retirement 20 or 30 years ahead, the chances are that you will see bull markets that make today’s prices look cheap.
Investors in VTI tend to be people investing for a retirement years in the future. Given that the market tends to rise very suddenly and often steeply without warning, and often without any rational basis, I think that the risk of being out of the market and missing a strong recovery balances out the slight overvaluation.
Bottom Line
Based on the broad market P/E ratios that have prevailed during various different kinds of markets over the past 20 years and its current dividend, VTI looks like a reasonable place to invest your money, as long as you are investing for the next decade or more. Seeking Alpha’s Quant system rates it as a Strong Buy.
As I see it, the biggest factors that could lead to short term price deterioration in VTI are if inflation continues to be strong and the labor market continues to hold up. This will cause the Fed to continue to aggressively raise rates which is a headwind for stocks as after a decade of cheap money companies are now more heavily leveraged than ever before. The other factor that may impact on VTI’s performance is the likelihood of a global recession, given that the large cap companies that dominate its results earn much of their income outside of the United States.
But to counterbalance that there are factors that could cause the market to surge. The biggest is the possibility that the Russian invasion of Ukraine is brought to a halt, one way or another and that this could lead to the end of sanctions and political decisions that are currently causing world-wide food and energy shortages, which are the main forces I believe are now driving inflation. Another is that China might give up on its Zero Covid strategy and allow its citizens to get back to work.
I believe strongly that the Fed was not wrong when it assumed inflation was “transitory” based on the data we all had access to. At that time inflation was being driven by the supply line constraints due to COVID-19. They had no way of foreseeing the impact that the Russian invasion of Ukraine would have on energy prices or that China would continue to pursue its Zero Covid strategy, which is continuing to hamper supply lines.
That points out how dependent we are on what actually happens, not what we expect to happen based on the data that is currently available. There is always the chance that VTI will surge or crash. Do not invest more money than you can afford to lose in a worst-case scenario in any investment, whether it is an index fund, specialty ETF, or individual stock. Don’t invest money you know you will need within the next five years, either.
As usual, I suggest that those of you who invest in VTI buy on a regular schedule, investing relatively small amounts at a single time. Avoid investing large sums such as an inheritance or the proceeds of the sale of a business all at once. This strategy protects you against the worst-case possibility of a steep decline in price followed by years of stagnation, as occurred in 2001-2013, but lets you benefit to some extent from any unexpected surge in the market. We know that people are much more emotionally affected when they make big losses than they are when they miss out on big gains.
Personally I prefer the S&P 500 ETFs, SPY and VOO to VTI, but I own a lot of shares of VTI that go back almost 20 years that I will never sell as the capital gains are huge. I also continue to use it as a tax loss harvesting partner for VOO knowing that if the market surges I may find myself holding those shares for many more years.
NOTE: If you are investing in a taxable account be aware that VTI goes ex-dividend on December 22, 2022. The record date is December 23. The price of VTI is likely to drop by the amount of the dividend paid. So if you don’t want to buy the dividend buy your shares after December 2024.
Be the first to comment