

da-kuk
Investment Thesis
India’s stock market is crushing the S&P 500 by double digits, fueled by the fastest-growing economy on earth, and the only way U.S.-based retail investors can ride this wave is through exchange traded funds. One option, among many, is the WisdomTree India Earnings ETF (NYSEARCA:EPI), a smart beta vehicle with a relatively low P/E ratio that can provide access to over 470 profitable Indian companies across eleven sectors and all market caps. Although I rate it a buy, this recommendation comes with a series of large-print warning labels, for it certainly is not the least expensive nor even the highest-performing within the India asset sub class.
In this article I aim to: (1) provide basic facts about why India presents an exciting investment opportunity, (2) analyze EPI’s holdings and address concerns about top-heaviness, and (3) conduct a comparative analysis of EPI’s performance, risks, growth, and value metrics (against a couple iShares ETFs I also give a buy rating to).
India’s Economy and Markets
India’s economy and equity markets certainly look quite attractive for investors regardless where they are located. India’s gross domestic product (GDP) rose by 13.5% in the April-June quarter, making its economy the fastest-growing on earth. India is expected to finish second only to Saudi Arabia in GDP growth rate in 2022 while the IMF projects the south Asian giant to reach the number one spot next year. It also just surpassed the UK in total GDP to become the world’s fifth largest economy, in an impressive leap from the eleventh spot India occupied a decade ago. In addition, according to IMF data, by 2025 India’s GDP is expected to rise 50 percent: from $3.53 trillion to $5.3 trillion.
This explosive growth has not directly translated into high stock prices, but both of India’s major indices, SENSEX and the Nifty 50, have outperformed the S&P 500 by nearly 15% over the past twelve months.
India’s NIFTY 50 rocks US indices in past 12 months (Seeking Alpha Premium)
However, it is important to mention that India’s economy and markets face key risks such as continual tightening of monetary policy as the country’s central bank tries to rein in inflation, along with low levels of private sector investment. Power shortages and soaring energy costs have forced the government to intervene to control petroleum exports to meet rising domestic demand, which caused the trade deficit to rise to record levels in July.
With that said, even when considering the risks, the Indian economy is still worth betting on. (And, to be honest, India has been a far safer bet than nearly all of my U.S.-based investments).
EPI Profile & Holdings
All eight India ETFs that received Seeking Alpha quant scores all rated as strong buys overall, primarily due to high momentum grades. Each ETF has strengths and weaknesses but the main difference will come down to the investor’s investment objective in terms of factors such as weighting strategy, risk level, number and consolidation of holdings, along with market cap mix, among others.
India ETFs Profile Overview (Data sources: Seeking Alpha Premium/Fund websites)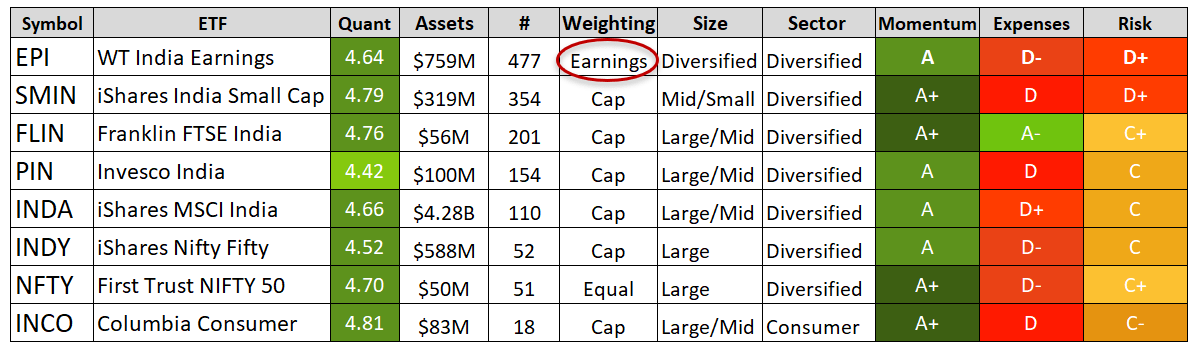
The EPI fund, incepted in 2008, consists of around 477 stocks worth nearly $760 million which are all traded on either or both of India’s two main exchanges: the Mumbai (Bombay) Stock Exchange (BSE) and the National Stock Exchange (NSE). The EPI takes a representative sample from its underlying asset – the WisdomTree India Earnings Index. The index, reconstituted annually, only includes stocks from companies that have recorded at least $5 million in profit in the preceding fiscal year, a P/E of at least 2 and market cap of at least $200 million. The fund is diversified across eleven industry sectors, although financials, energy, basic material, and technology make up 67% of the fund’s Net Asset Value (NAV).
EPI Holdings by Sector (WisdomTree)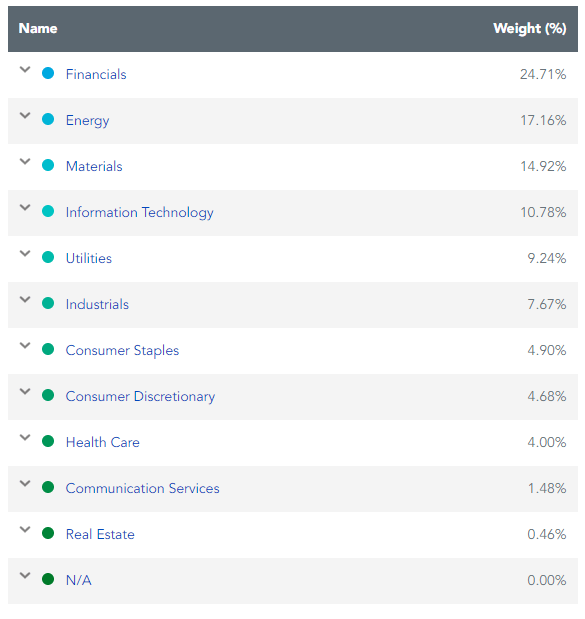
In terms of holdings breakdown, the fund is relatively top-heavy, as this pareto analysis shows, with the top three of the 477 stocks accounting for 17% of the fund’s total value. Moreover, one single stock, Reliance Industries Limited (RIL), represents 8 percent of the total value. However, this is not necessarily a bad thing.
EPI Holdings Pareto & Top Stock (Data Sources: WisdomTree, Reliance Industries FY22 Annual Report)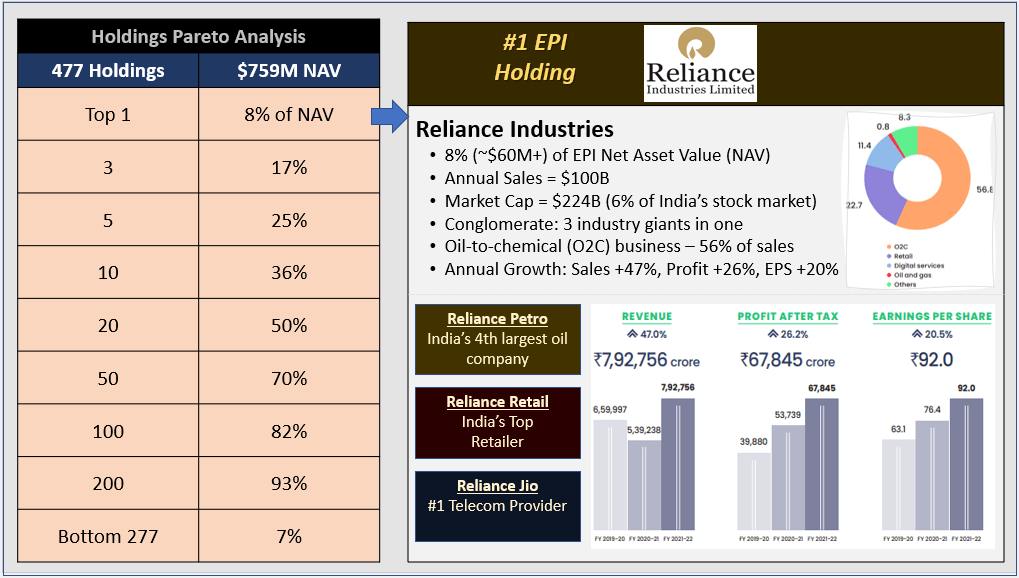
The below table shows the top 20 holdings, which account for 50% of the EPI fund’s total asset value, along with each stock’s 1-year price performance, as of 9/12/22, in addition to growth, profit, and P/E figures. The annual numbers are based on fiscal year 2022, which ended on March 31 for most Indian companies.
Top 20 EPI Holdings (Data Sources: WisdomTree, The Economic Times (India))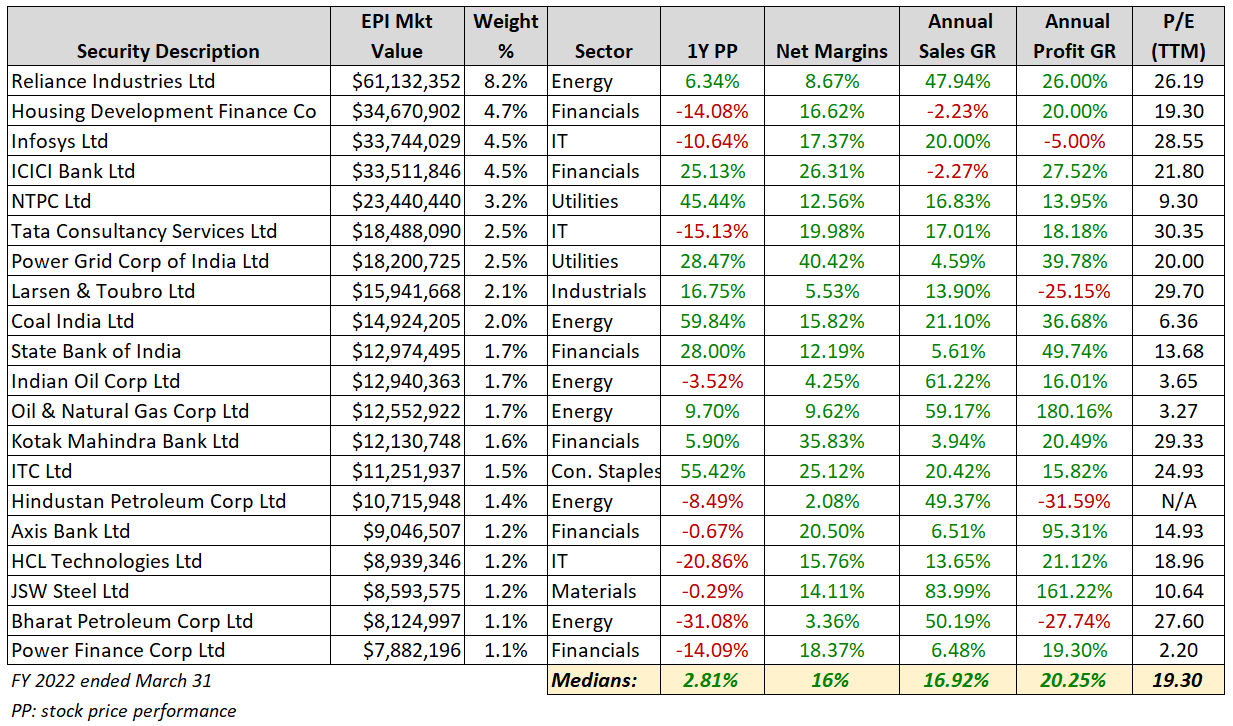
The median P/E of nearly 20 is interesting because, as we shall see, EPI claims the fund has an overall P/E of around 12 and is a key competitive differentiator versus other funds.
It is worth looking at RIL in more detail, given it makes up 8% of the portfolio, and observing some remarkable facts that could partly alleviate concerns about the fund’s top-heaviness. For starters, RIL is not simply an energy company wholly susceptible to oil market perturbations, as the slide above illustrates. It is really three multibillion-dollar companies wrapped up in one, that dominate three sectors: energy, consumer discretionary, and communication services. RIL, to be sure, derives a majority of its $100 billion in annual revenue from its oil-to-chemical (O2C) segment. But more than 20% of sales comes from Reliance Retail, ranked as the second fastest growing retailer in the world in a Deloitte industry outlook released in February. Finally, there is the digital business which includes India’s largest mobile network operator Jio.
Comparative Analysis: EPI vs. INDA/SMIN
Although eight ETFs under the same India equity sub class as EPI have garnered strong Seeking Alpha quant scores, for comparison purposes I chose two iShares ETFs that combined represent a similar opportunity in terms of size and type of exposure, although without the smart beta strategy. In fact, Blackrock actually recommends buying iShares MSCI India Small Cap Index ETF (SMIN) and the MSCI India ETF (INDA) given there is no overlap.
EPI, INDA, and SMIN have top Seeking Alpha marks in momentum relative to all other ETFs, but their expense ratios are painfully outlandish compared to the median of 0.45%, which is a price that may need to be paid. EPI and SMIN have low risk scores partly due to poor tracking errors: that is, the difference between the actual returns of the fund compared to the underlying benchmark. The high expense ratios and tracking errors likely explain why these ETFs are not performing as well as India’s main indexes like Nifty 50 and Sensex.
The asset flows have been down for all 3 funds in the past year, although in the last 30 days there has been a turnaround with EPI up 12%, INDA +4, and SMIN +7%. EPI also gets an F in short interest as % of shares outstanding compared to the median (10% vs. 0.52%).
EPI Peer Comparison: Cost and Risk (Data Source: Seeking Alpha Premium)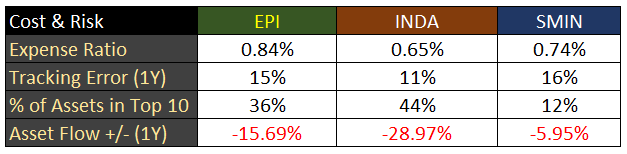
When it came to trading price performance over the past 12 months, both iShares ETFs beat EPI. However, EPI came out ahead in terms of total return, which was somewhat surprising.
EPI Peer Comparison: Price and Total Returns (as of 9/12/22) (Data Source: Seeking Alpha Premium)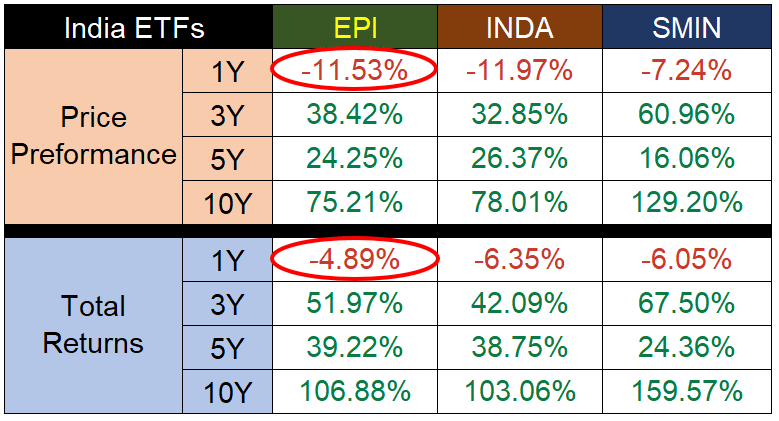
After comparing distributions it turns out that EPI benefited greatly by a quarterly dividend of $1.84 paid out at the end of June, which represents a jump of 826% in dividend growth rate, which boosted the yield to 6.82%. This is quite an outlier when considering EPI’s average payout in the past four quarters is $0.12 and its highest quarterly payout since inception was $0.19 at the end of 2021.
In terms of growth and value metrics, EPI has a very encouraging P/E ratio for value investors compared to its peers with a solid dividend yield. The implied growth, calculated by WisdomTree as retained earnings multiplied by ROE, is not stellar, but solid against a competitive field.
EPI Peer Comparison – Value and Growth Metrics (WisdomTree)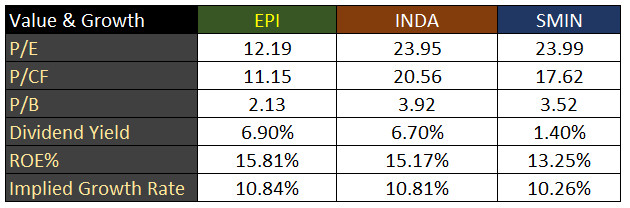
$10,000 sunk into each fund a decade ago would return the following based on WisdomTree’s NAV comparison tool, which shows SMIN outperforming with a 190% return on investment.
$10,000 investment growth over 10 years (WisdomTree)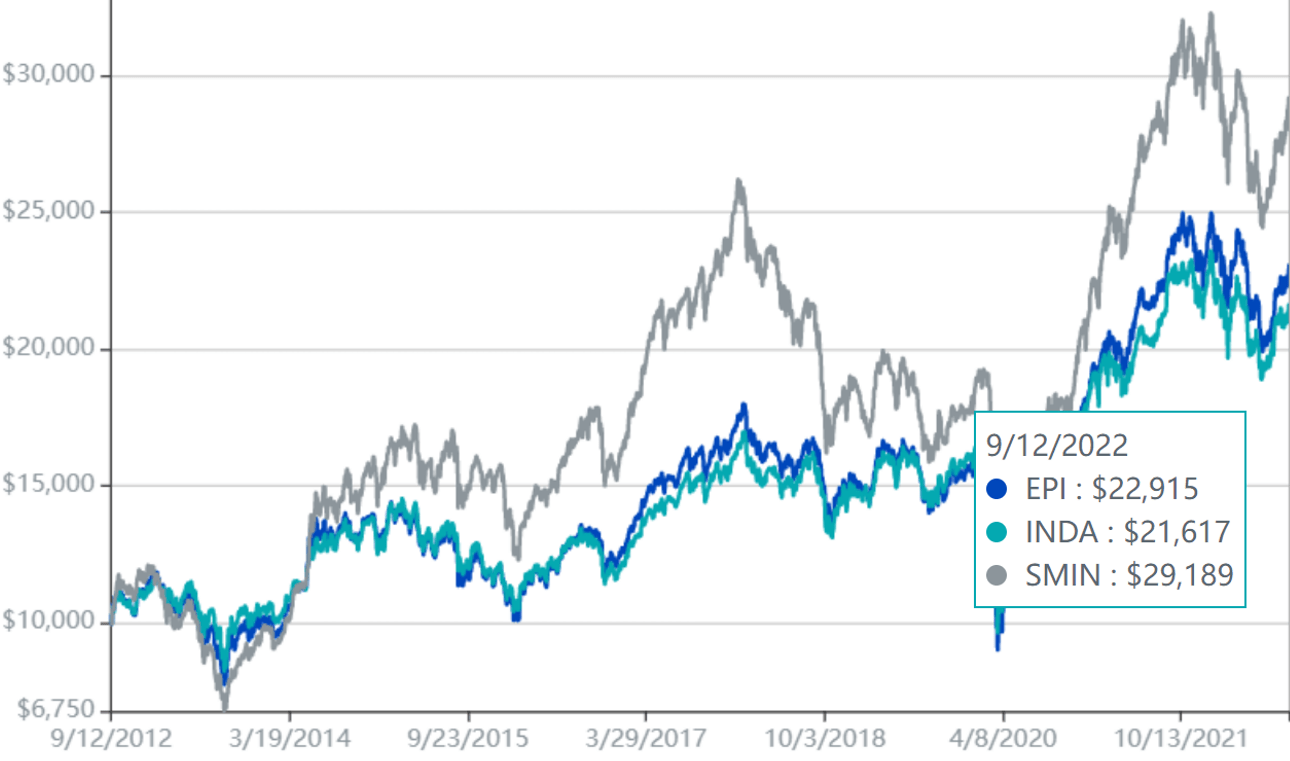
Conclusion
Right now is the best time to invest in Indian companies and buying shares of the EPI ETF is a great way to do it. Although not the cheapest or highest performing of the India ETFs, EPI has great upside with a portfolio that affords broad exposure to profitable companies in eleven sectors across all market caps, a low P/E ratio, and a great dividend yield. However, although it deserves a buy rating, along with INDA and SMIN, investors should keep a close eye on dividend consistency and tracking errors and monitor if EPI is improving in terms of getting closer to matching the actual returns of India’s booming markets.
Be the first to comment