

Spencer Platt/Getty Images News
Thesis
I remain structurally bullish on EOG Resources, Inc. (NYSE:EOG). It has been a core part of my portfolio for the better part of two years. Lately, I’ve been asking if the natural gas and oil bull market has reached a peak, and after researching the market and history books, I conclude – I don’t think so.
After the oil boom and bust of 2008, the Exploration and Production (E&P) industry experienced a decade-long era of underinvestment combined with new ESG pressures, which made investing in the industry unattractive. E&P companies primarily work on existing wells and fields.
Inflation remains high at 8.5% and is much stickier than people initially anticipated. Rising interest rates dampened demand, yet, energy prices remain high. Demand is declining, and we’re likely entering a recessionary environment, yet, the U.S. could soon face an energy crisis.
Energy Crisis in the U.S.
Energy-wise, the U.S. has been in a privileged position compared to the rest of the developed world. The U.S. has vast oil and gas resources and is not dependent on energy imports.
The U.S. is one of the world’s largest energy consumers and producers. Oil and gas prices in the U.S. were safeguarded, and U.S. consumers thrived on their cheap energy prices. This could also be one reason that allowed investors and speculators in the U.S. to excessively speculate in the financial markets.
The largest oil producers in the world (Visual Capitalist)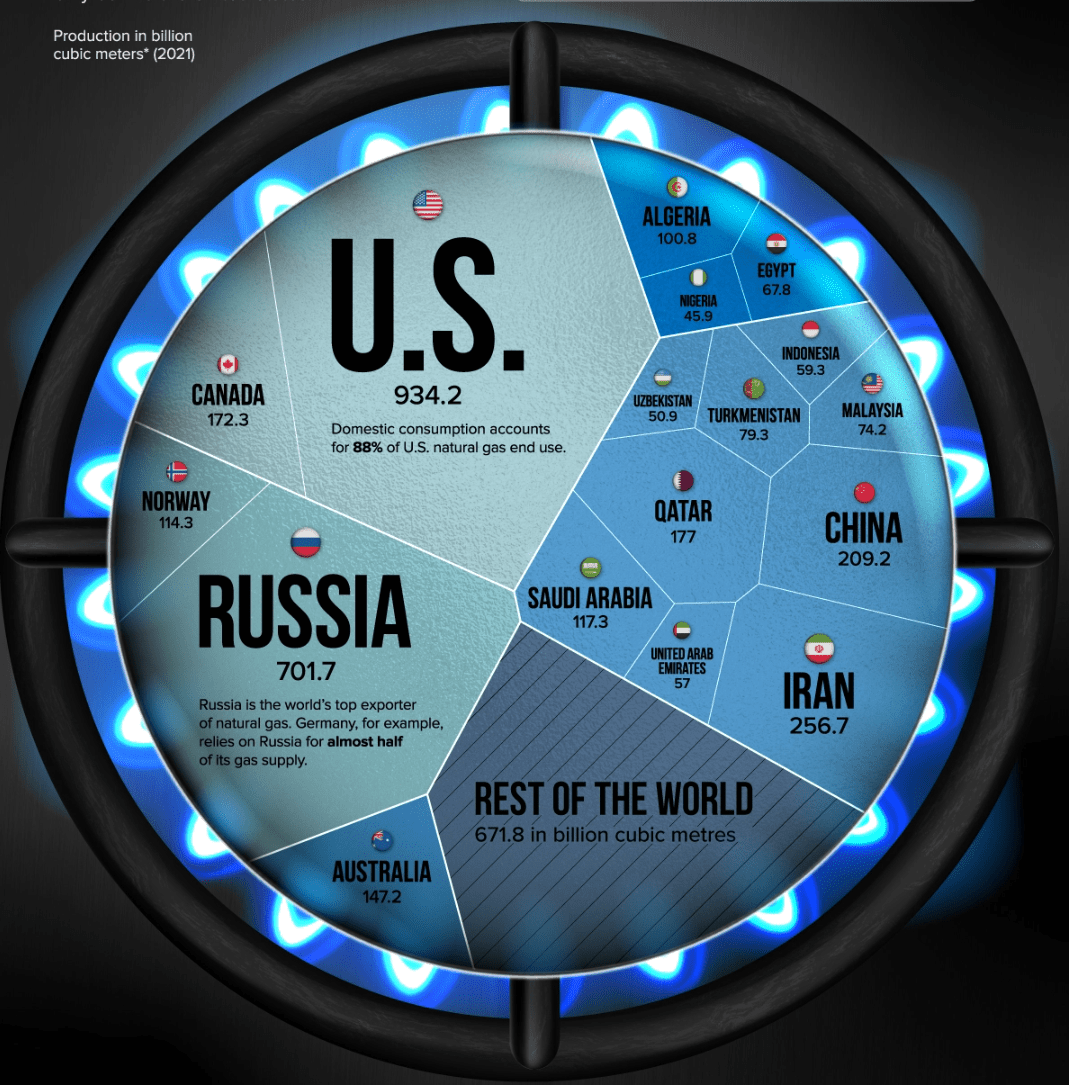
U.S. citizens enjoyed cheaper oil and much cheaper natural gas than the rest of the world. The 2010s were an era of overinvestment in the E&P sector leading to the large fields like Marcellus and Haynesville coming online. This allowed the U.S. to switch from one of the largest importers (early 2000s) to the largest natural gas and LNG exporter.
The price difference is remarkable. A barrel of oil has six times more energy content than an MMBtu (million British Thermal Unit) of natural gas. So the logical ratio between these two units should be 6:1.
Before the major wells in the U.S. came online (~1990-2010), the ratio between oil and gas in the U.S. was 8:1. Since 2012, the ratio averaged 20:1 due to the production capabilities and trade surplus the U.S. experiences.
Oil to Gas Ratio in the US (Bloomberg)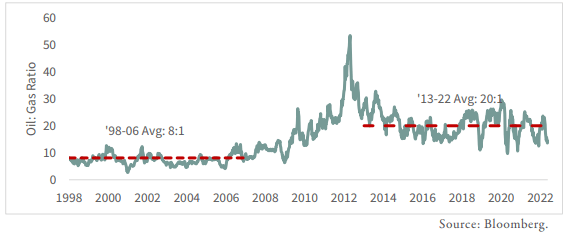
Europe is currently paying ~$35 per MMBtu, the U.S. is paying $8.5 per MMBtu. Using the Brent Crude and WTI, the ratios are ~3 for Europe and ~11 for the U.S. The U.S. oil-to-gas ratio contracted slightly over the recent months.
Shale Production in the U.S.
The U.S. has been plagued by underinvestment in the exploration and production of new fields due to ESG mandates. The U.S. has three fields that make up a total of 52% of the U.S.’s total gas production.
The Marcellus, Hayneville, and Permian Oil make up 52% of U.S. natural gas production, with 40% just from the first two.
Marcellus and Haynesville ramped up natural gas production around 2010 from around 0 bcf/d to ~29bcf/d in Marcellus and 13 bcf/d in Haynesville.
Hubbert Curve
Before diving deeper into production, we discuss the Hubbert Curve. King Hubbert was a geologist that worked at shell oil. His theory is that the production of natural resources behaves like a bell curve. After an initial noisy production ramp-up, production would ramp quickly, plateau, and rapidly decline again.
The Hubbert curve by Hubbert (1956) (Researchgate)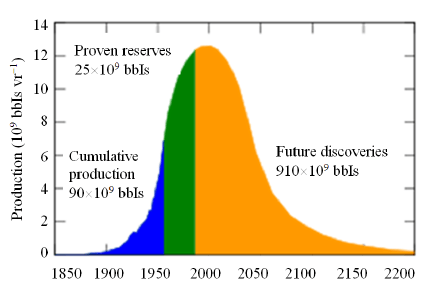
Technological advancements distorted the curve over the last 50 years, so I wouldn’t bet on production following it 1:1.
Yet there are plenty of fields that followed the bell curve pattern. Barnett and Fayetteville experienced a productivity drop after reaching 60% of all Tier 1 locations drilled.
Barnett and Fayetteville production – Hubbert Curve Model (Goehring Rozencwajg)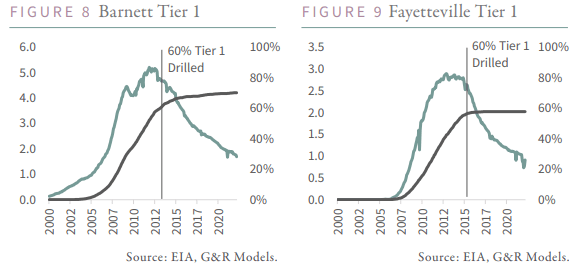
We can use the Hubbert Curve as a rule of thumb when estimating the usable life of fields. The Hubbert Curve allows us to plot production capacity vs the cumulative production to create a Hubber Linearization. We won’t go this far in this article.
Back to the Shale Production in the U.S.
Exploring new fields and bringing them online is coupled with high up-front investment and time. You can’t just force the executives of oil corporations to ramp up their production when they’re producing at capacity.
The U.S. Energy Information Administration (“EIA”) releases regular drilling productivity reports. This allows us to look at the productivity of fields over time.
Since the drought of the 2020 pandemic, E&P companies have increased the numbers of rigs in different regions, yet production quickly reached a peak and is now slowly decreasing.
eia – Drill Productivity Report 2022 (eia)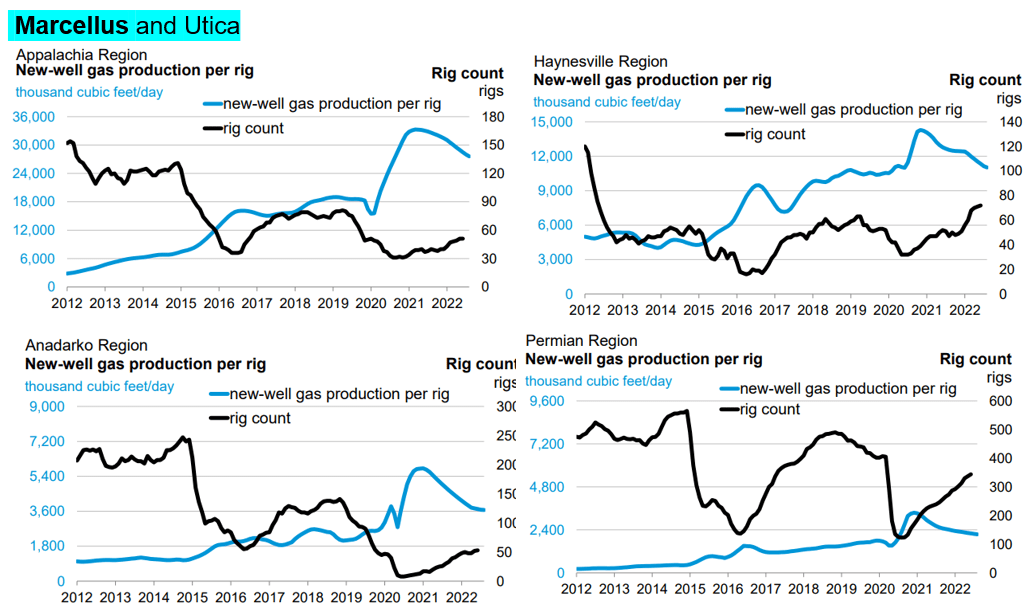
E&P company executives are not motivated to continue exploration and drilling as congress and investors send mixed signals. At the end of last year, congress grills oil executives about climate change. A few months later, congress grills the same oil executives about high oil prices and demands that they increase output.
The problem I see here is that the natural gas supply decreases rapidly, and the U.S. could lose its trade surplus, which has been defending it from international prices. Over the next year or two, without further investment in E&P, even with an ongoing recession, the U.S. could be forced to start importing natural gas, immediately setting its price equal to the international one. That’s could lead to a 300-400% increase in natural gas prices in the U.S.
E&P IPO and Secondary Fundraising (12-month MVA) (Goehring & Rozencwajg)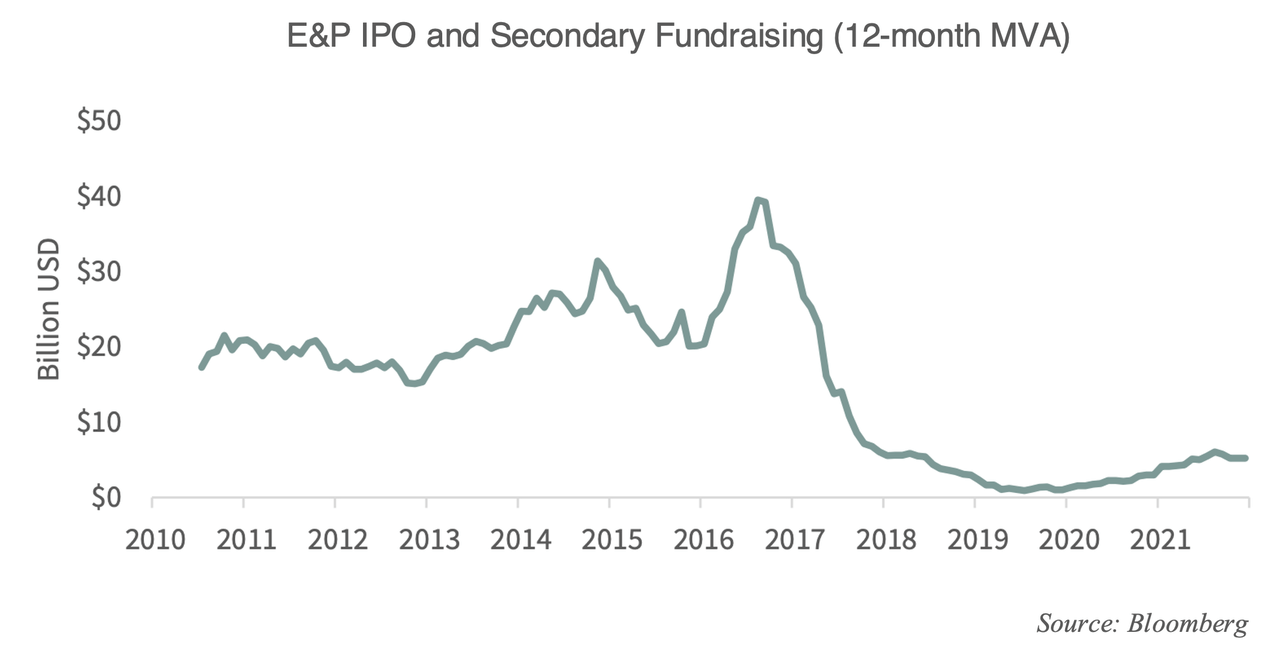
Money is barely flowing into the E&P IPO and secondary fundraising market, which is understandable. This could keep the market for natural gas very tight in the U.S., which is in turn very profitable for oil and gas producers in the U.S.
The Commodity Super-Cycle
Commodities and the stock market work in cycles. I discussed it in more detail in an article I published last year in November.
I urge the reader to take a look at the article – Anything With Demand is an Inflation Hedge.
Looking at the history of financial markets, we can see how commodities and financials work in cycles. There are deflationary periods in which stocks outperform and inflationary periods in which commodities outperform.
S&P 500 / Producer Price Index (log) (Longtermtrends)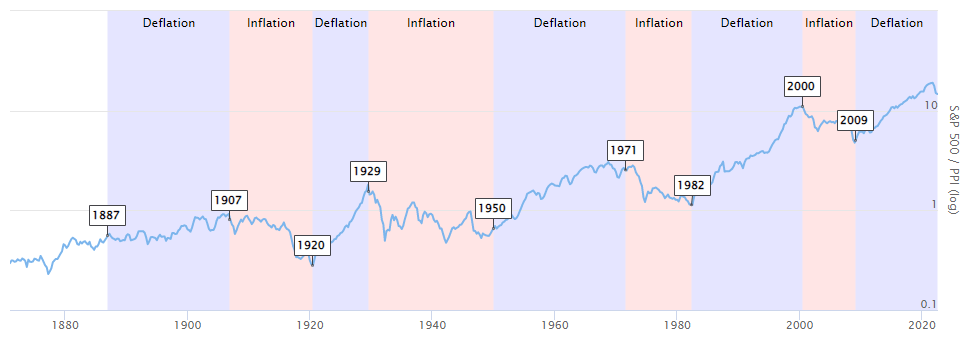
Deducing from the chart and what happened around those times, we can extract signs for a commodity cycle.
- Commodity cycles occur in inflationary periods – meaning they were preceded by money printing in some form.
- Commodity cycles are preceded by periods of underinvestment in commodities.
- The stock market was surging before a commodity cycle.
- Large monetary changes occurred during the largest commodity super cycles.
We can check each list entry for the signs of an upcoming commodity cycle.
EOG Resources
EOG Resources is well-positioned within a possible commodity bull cycle. The last commodity bull cycle was characterized by negligence, where tons of debt was raised without consideration of the company’s cash flow.
The bubble in crude oil, natural gas, and other commodities destroyed 100s of billions in capital. All while E&P companies continued to raise debt to finance their business.
EOG put negligence aside and practiced discipline for the better part of a decade. It consistently reduced its debt levels, improved its cash flow and profitability, and returned excess cash to investors.
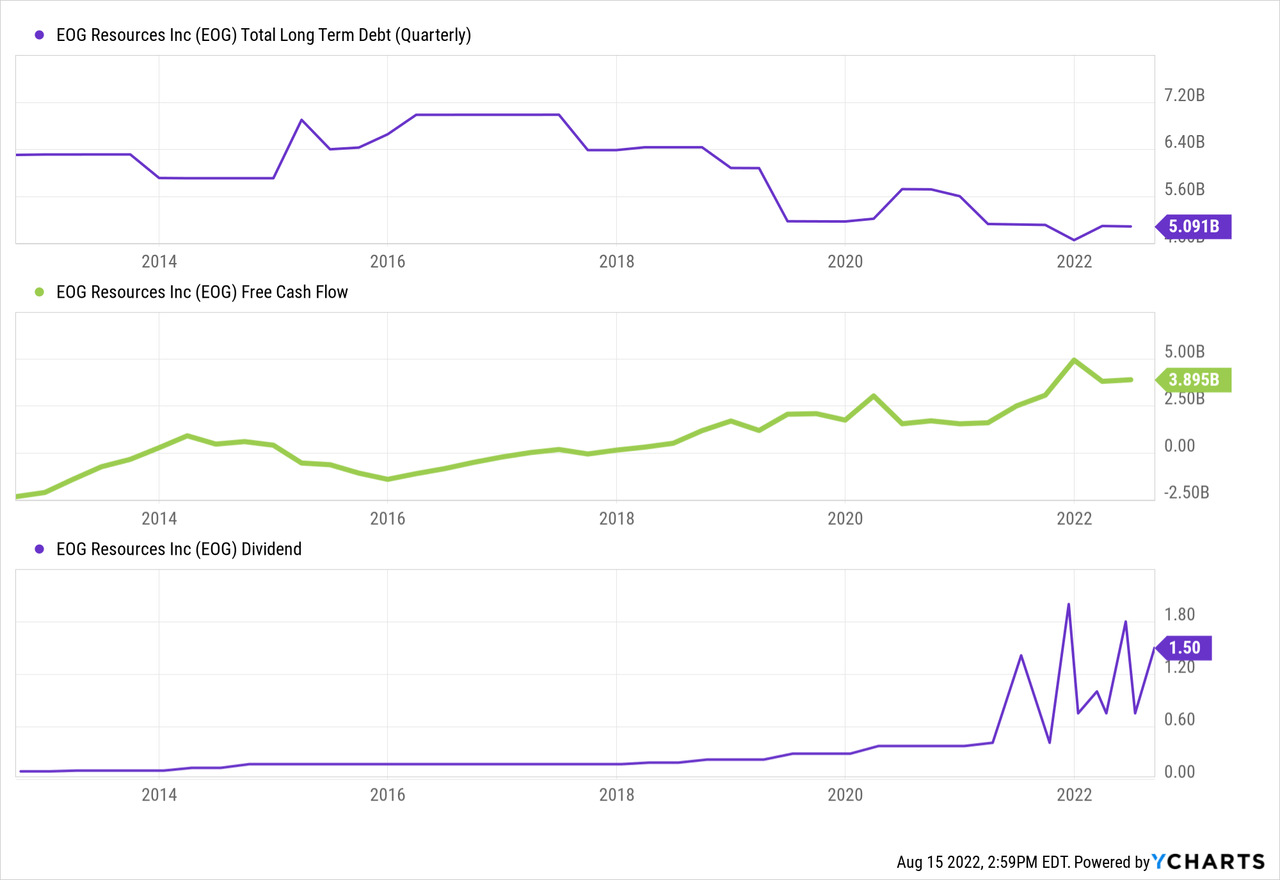
EOG has been free cash flow positive since 2018 and reduced debt levels by ~40%.
Valuation-wise, EOG is trading conservatively as investors are still wary about E&P companies in general. I’ve posted a chart above showing that E&P investments are at an all-time low. In my previous article mentioned above, you’ll find more charts supporting the statement.
Fastgraphs EOG – Operating Cash Flow (Fastgraphs)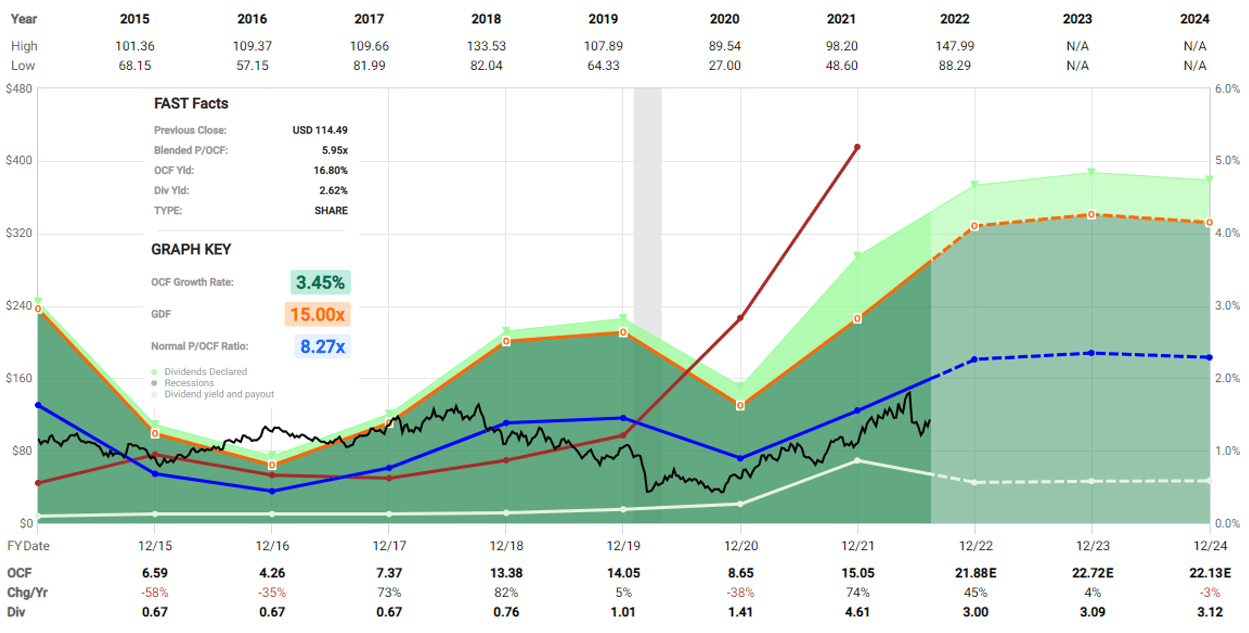
EOG has been part of my low-volatility portfolio which I regularly update on Google sheets. Feel free to take a look at my portfolio! The commodity part of my portfolio has exploded since 2020 and, even during the downturn in 2022, remained net (VERY) positive.
EOG produces oil and natural gas. As I’ve discussed earlier in this article, I’m bullish on both commodities but see problems with the U.S.’s natural gas supply over the next 1-2 years.
EOG Resources – Revenue Composition – June 2022 (EOG Quarterly Reports)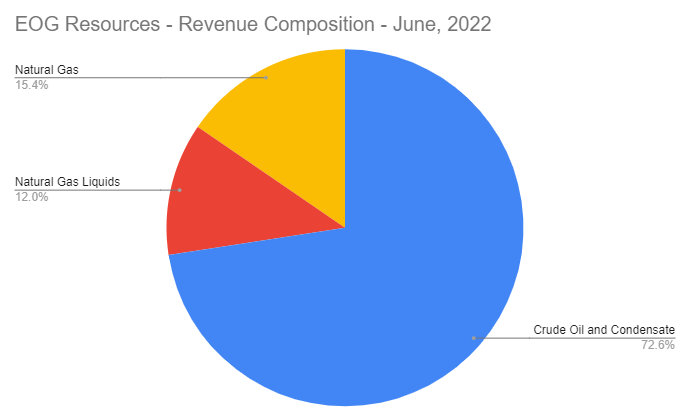
If the downward trend in natural gas production growth continues, we could see EOG’s revenue from natural gas and liquids rise disproportionately faster than revenues from oil.
On the oil side of things, it’s not much better.
Even with the U.S. government releasing supply from the strategic petroleum reserve – SPR – to soften oil prices, the effects were mostly short-term. The chart below shows the rate of change in the SPR drawdown. It increased the drawdown to nearly 1.5% in May-June, which helped alleviate some of the pricing pressure on oil.
WTI vs Drawdown Strategic Petroleum Reserve (US Energy Information Administration)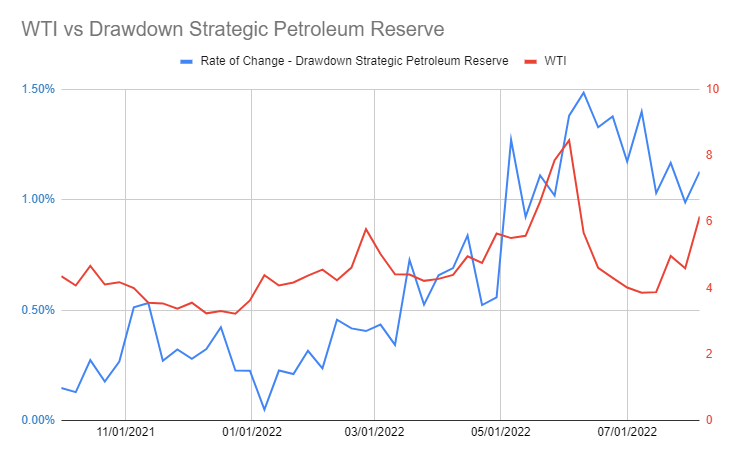
Supply and demand and the pricing of commodities are extremely complex. Many analysts, me included, simplify many of the relationships and processes for the sake of the analysis. The is not just ONE reason for price changes for a universally used and traded commodity.
For the sake of this analysis, I’ll focus on a few aspects but caution the reader to look beyond the scope of this analysis.
Using the information from previous charts and US GDP, we can construct a simplified possible pricing model for oil.
In 1980, oil rallied from $3 to $36 per barrel, the U.S. consumed ~17 mb/d, which amounted to $225bn per year on $2.9tn GDP – Energy made up 8% of GDP.
In 2008, the US consumed ~20 mb/d for $145 resulting in $1tn of $14.5tn of total GDP – Energy made up 6.9% of GDP.
Now, the U.S. consumed 20 mb/d totaling 3.5% of the U.S.’s GDP.
We could easily see a doubling in oil prices and remain below the previous cycle highs. My base case for oil is that it’s likelier to be higher than lower over the next few years.
Conclusion
I’m structurally bullish on oil and gas over the next few years for the reasons discussed in this article.
EOG is a disciplined oil and gas producer that operates cash flow positive and focuses on generating shareholder returns in form of dividends and share buybacks.
EOG’s double premium strategy is working and generates a 60% return at the $40/b oil and $2.50/Mcf gas prices. In EOG’s last quarterly presentation, the company showed that it’s drilling rapidly, reducing the oil price required to generate at least 10% ROCE.
Double Premium Strategy EOG Resources (EOG Resources Quarterly Report)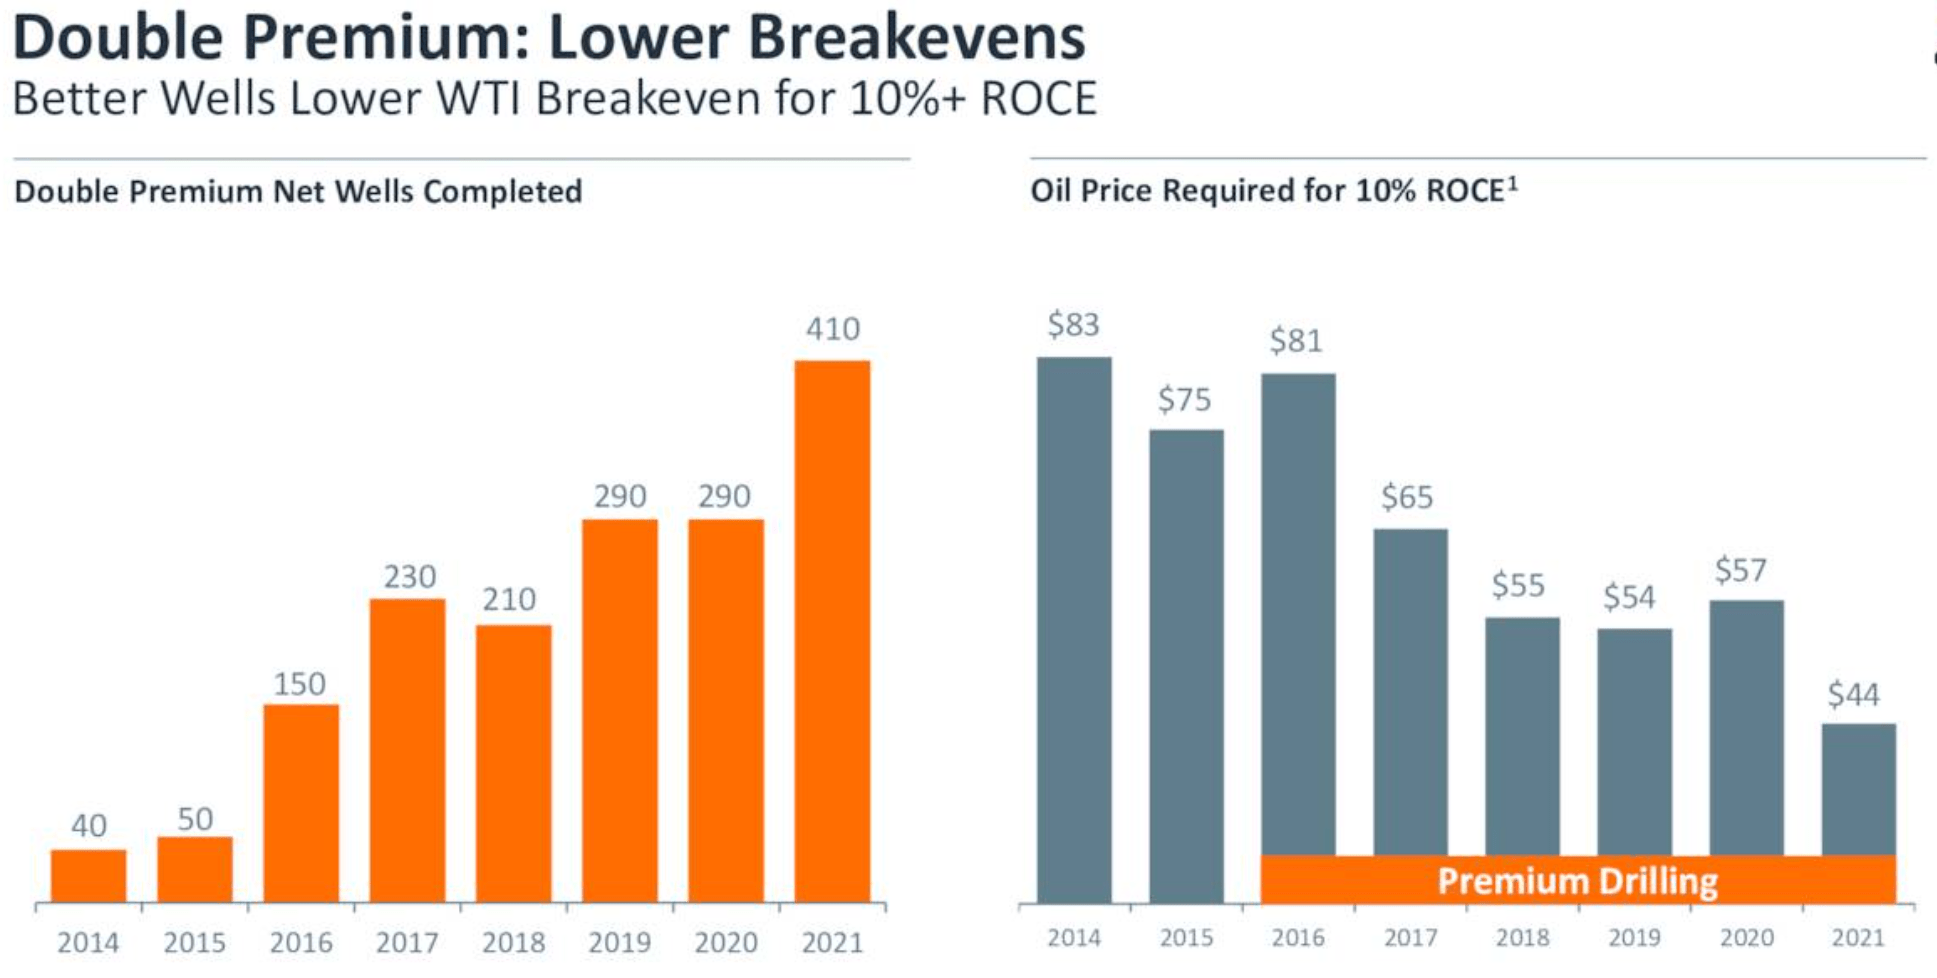
Despite the possibility of a severe recession and oil prices assumably declining to $50-$70, EOG operates profitably and generates shareholder value.
I always welcome constructive criticism and open discussions. Please feel free to comment or PM me about my calculations and/or sources that I use in my articles.
Be the first to comment