

Vitoria Holdings LLC/iStock via Getty Images
Introduction
The Canadian company Wheaton Precious Metals (NYSE:WPM) released its second-quarter 2021 results on August 11, 2022.
Note: This article updates my previous article on Sandstorm Gold, published on May 10, 2022. I have been following WPM quarterly results since Sept. 2018.
WPM has 21 operating mines and 14 development projects predominantly throughout the Americas.
WPM Presentation Assets (Wheaton Precious Metals)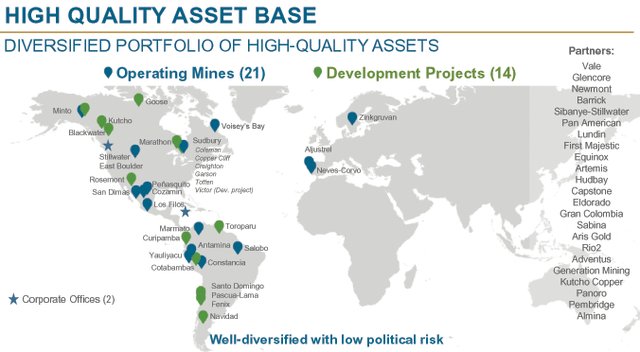
1 – A quick snapshot of the second quarter
The company generated revenues of $302.92 million during 2Q22, down 8.3% year-over-year. The adjusted income was $149.39 million, or $0.33 per share.
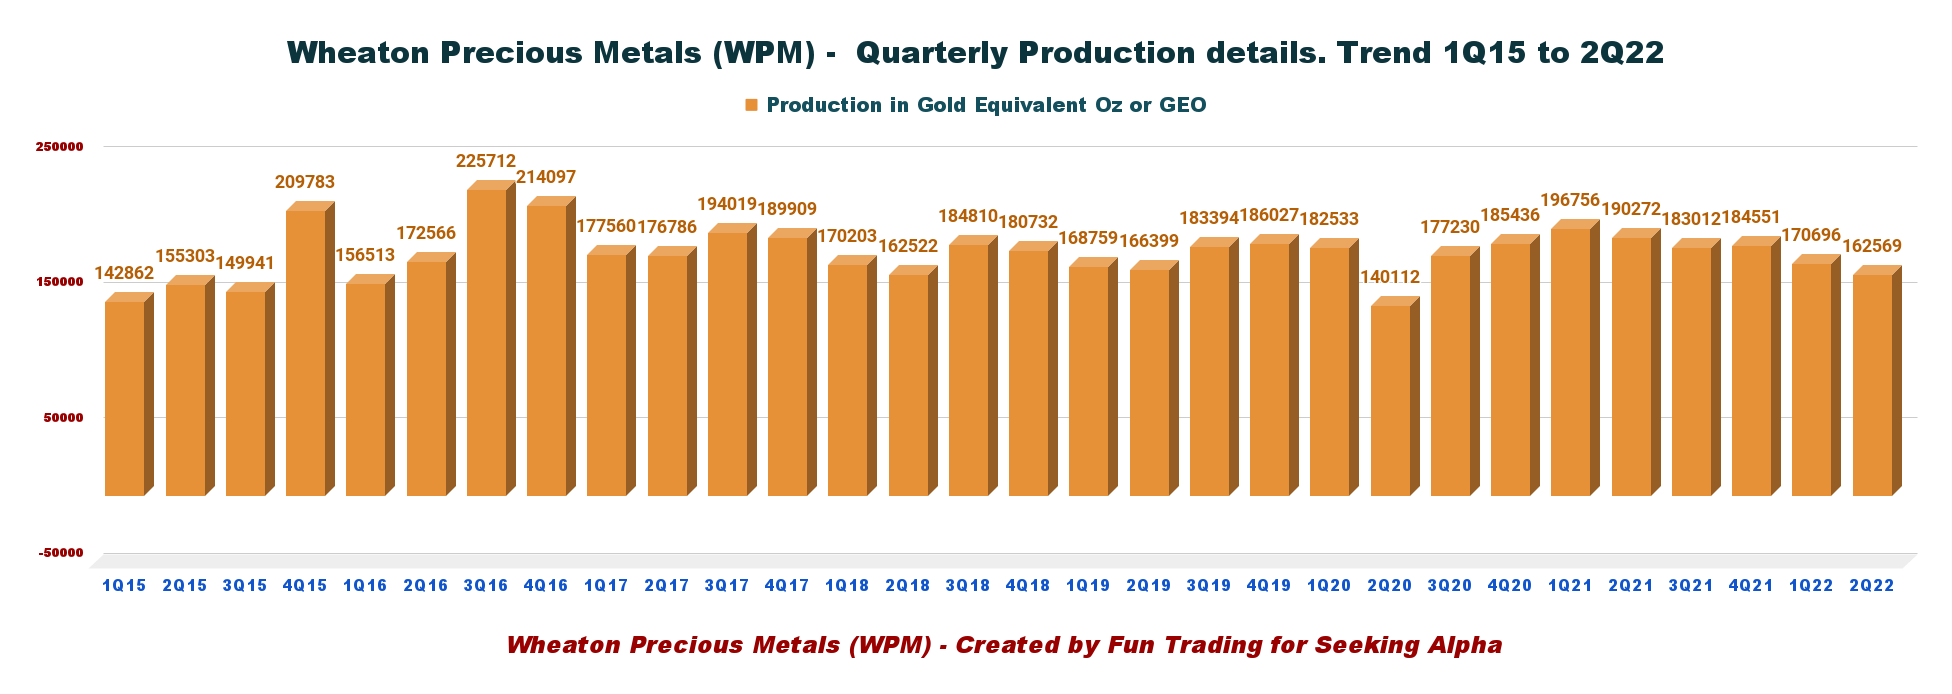
The company produced 162,569 GEOs or 12,193 SEOs in 2Q22 and sold 170,371 GEOs or 12,778 SEOs. Production declined 14.6% year over year.
Production was weak this quarter due to the decline in attributable gold production, primarily due to lower output at Salobo and Stillwater (June flooding issues).
CEO Randy Smallwood said in the conference call:
I am pleased to say that our portfolio once again delivered solid revenue, earnings and cash flow in the first half of 2022, as Gary will discuss later. This solid performance reflects the resiliency of the streaming model to inflationary pressures currently being felt across the global economy and especially amongst the traditional miners. In fact, our average cash cost per gold equivalent ounce actually decreased in the first half of 2022 relative to the first half of 2021.
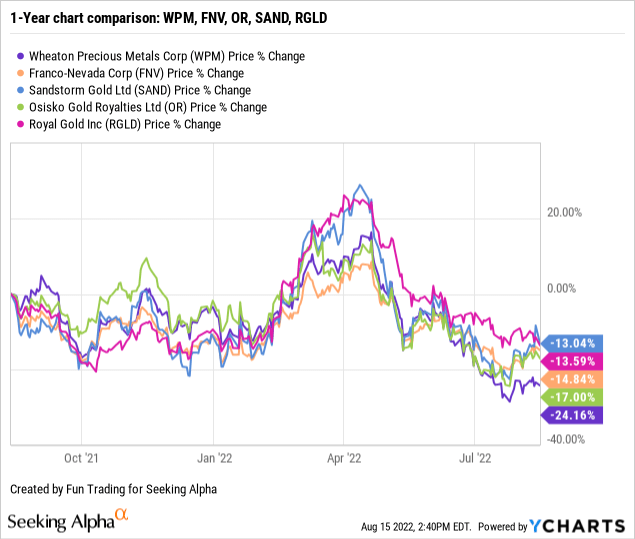
2 – Stock performance
Wheaton Precious Metals is part of my core long-term streamer with Franco-Nevada (FNV). Unfortunately, WPM has underperformed the group on a one-year basis and is down 24%.
3 – Investment Thesis
WPM is one of my long-term investments in the royalties & streams segment with Franco-Nevada. I have recently started a small long-term position with Sandstorm Gold (SAND).
You can read my most recent articles about the 2Q22 by clicking FNV here and SAND here.
The investment thesis has not changed this quarter, and WPM is still part of my core position in the steamer segment. However, one major setback in this industry is the lack of a solid dividend.
WPM is showing a yield of 1.76%, and it is the highest dividend paid compared to FNV (1.24%) and SAND (0.98%).
WPM is a solid long-term investment, but I am not happy with the underperformance. But, the gold sector is highly volatile and unpredictable. Thus, I suggest trading regularly short-term LIFO, a minimum of 30% of your long-term position.
This split strategy has been my dominant strategy in my marketplace, “The Gold and oil corner,” and, I believe, it is the most rewarding strategy while reducing the risk significantly.
Wheaton Precious Metals: Financials And Production In 2Q’22
| Wheaton Precious | 2Q21 | 3Q21 | 4Q21 | 1Q22 | 2Q22 |
| Total Revenues in $ Million | 330.39 | 268.96 | 278.20 | 307.24 | 302.92 |
| Net Income in $ Million | 166.12 | 134.94 | 291.82 | 157.47 | 149.07 |
| EBITDA $ Million | 237.37 | 192.19 | 352.35 | 215.96 | 210.74 |
| EPS diluted in $/share | 0.37 | 0.30 | 0.65 | 0.35 | 0.33 |
| Cash from operating activities in $ Million | 216.42 | 201.28 | 195.29 | 210.54 | 206.36 |
| Capital Expenditure in $ Million |
64.78 |
1.81 |
304.05 |
46.00 |
15.55 |
| Free Cash Flow in $ Million |
151.63 |
199.48 |
-108.76 |
164.54 |
190.81 |
| Total cash $ Million | 235.45 | 372.45 | 226.05 | 376.16 | 448.63 |
| Long-term debt in $ Million | 0.0 | 0.0 | 0.0 | 0.0 | 0.0 |
| Dividend per share in $ | 0.15 | 0.15 | 0.15 | 0.15 | 0.15 |
| Shares outstanding (diluted) in Million | 451.2 | 451.7 | 451.2 | 452.0 | 452.4 |
| Production details | 2Q21 | 3Q21 | 4Q21 | 1Q22 | 2Q22 |
| Production in Gold Equivalent K Oz GEO | 190.3 | 183.0 | 184.6 | 170.7 | 162.6 |
| Production in Silver Equivalent Oz SEO | 13,978 | 13,314 | 13,421 | 12,853 | 12,193 |
| Gold price realized $/Eq. Oz GEO | 1,870 | 1,764 | 1,798 | 1,870 | 1,778 |
| Silver price realized $/Eq. Oz SEO | 25.97 | 24.51 | 23.36 | 24.19 | 23.71 |
| The gold/silver ratio | 67.5 | 72.0 | 77.0 | 77.3 | 75.0 |
Source: Company release
* Estimated by Fun Trading
Note1: Historical data (more than four years) are only available for subscribers.
Analysis: Revenues, Earnings Details, Free Cash Flow, Debt, And Gold Production Details
1 – Revenues: Wheaton Precious Metals posted $302.92 million in revenue for 2Q22
WPM Quarterly Revenues history (Fun Trading) The second quarter of 2022 yielded revenue of $302.92 million, down 8.3% on a year-over-year basis and up 1.4% sequentially.
The adjusted net earnings were $149.29 million, or $0.33 per share, compared to $161.63 million, or $0.36 per share in 2Q21. Cash costs were $440 per GEO, slightly lower than $444 per ounce a year ago.
The decline in attributable gold production was primarily due to lower output at Salobo and Stillwater.
Cash from operating activities for the second quarter of 2022 was $206.36 million compared to $216.42 million in the prior year.
Below is shown the revenue per metal for the last four quarters. Cobalt production started in 1Q21:
WPM Quarterly production per segment from 3Q21 to 2Q22 (Fun Trading)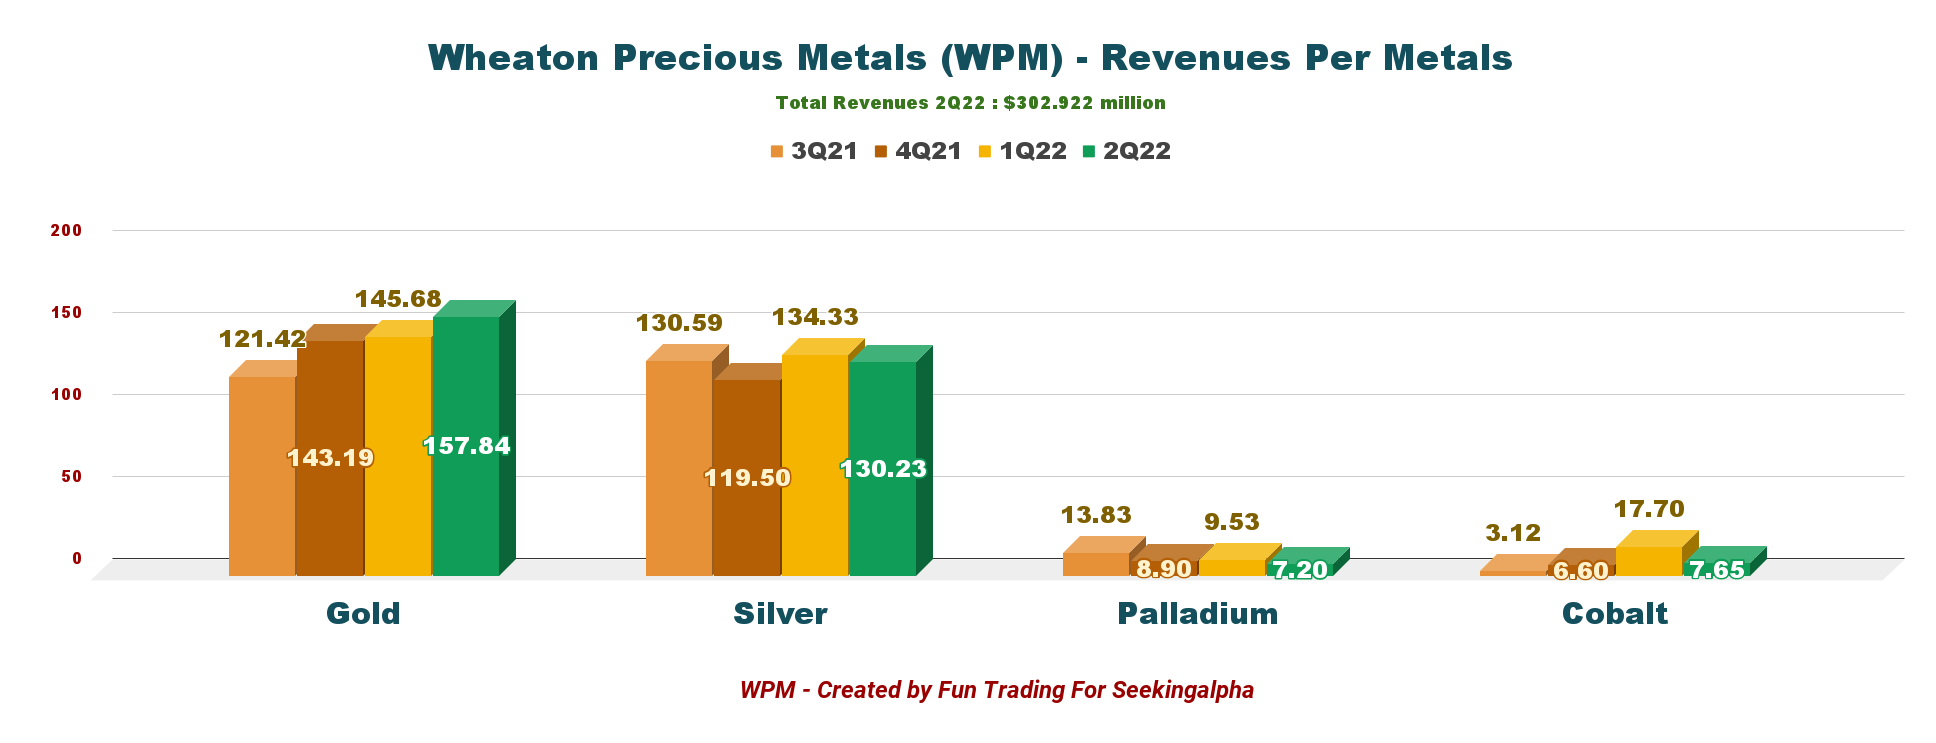
Note: During the three months ended June 30, 2022, Wheaton received its sixth cobalt delivery under the Voisey’s Bay precious metal purchase agreement.
The gold price rose sequentially to $1,778 per GEO, while the silver price was $23.71 per SEO.
Please see the chart below:
WPM Gold and silver price (Fun Trading)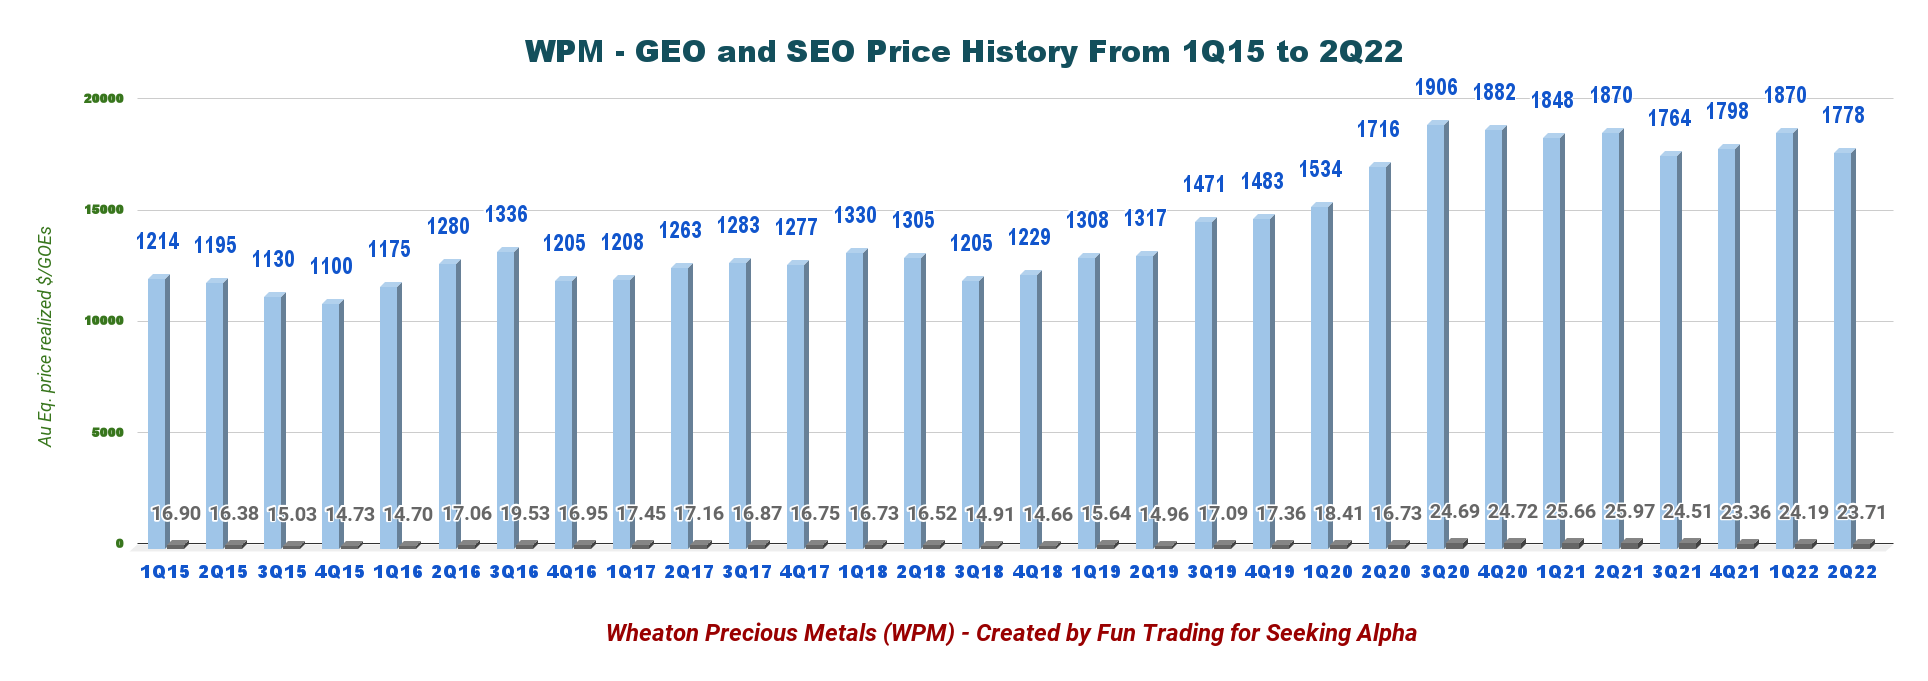
However, the price realized for gold production was sold at $1,872 per ounce, silver production at $22.27 per ounce, Palladium production at $2,132 per ounce, and Cobalt production at $34.01 per pound.
2 – Free cash flow was estimated at $190.81 million in 2Q22
WPM Quarterly Free cash flow history (Fun Trading)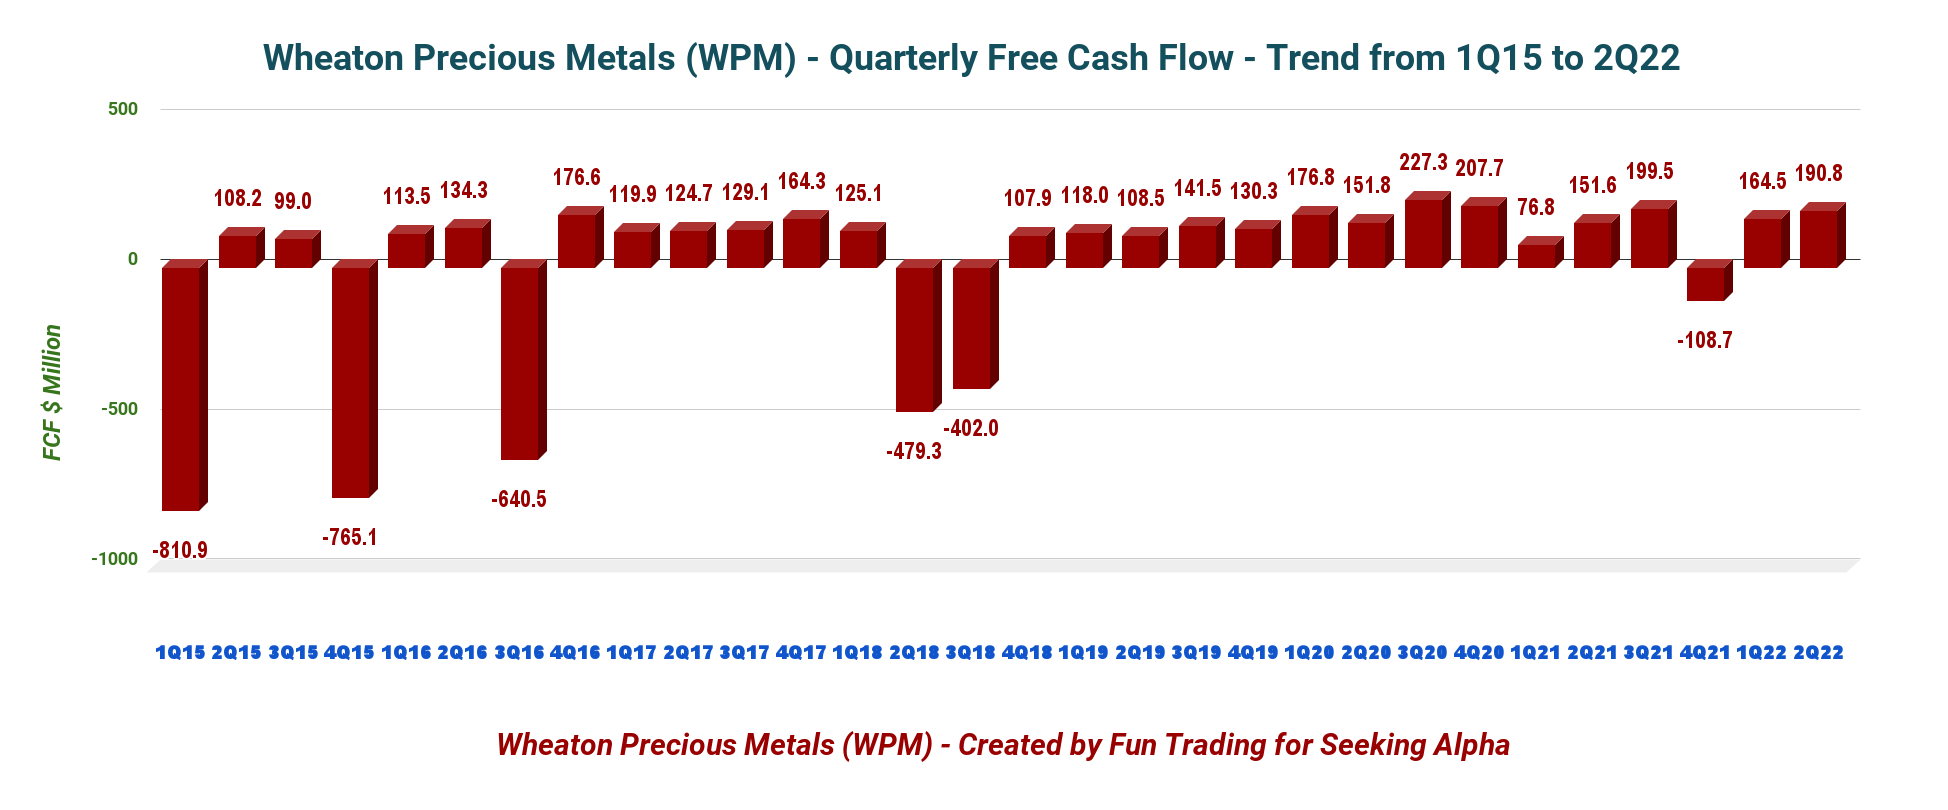
On June 30, 2021, the trailing 12-month FCF was estimated at $446.07 million, and the second quarter of 2022 was estimated at $190.81 million.
The Board of Directors declared a quarterly dividend of $0.15 per common share or a yield of 1.77%. The dividends are linked to operating cash flows.
WPM Dividend policy explained Presentation (Wheaton Precious Metals)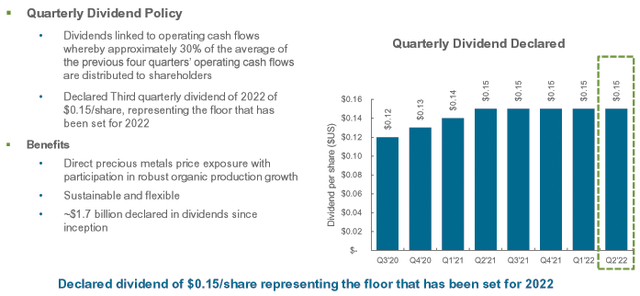
Note: Wheaton Precious Metals is a Canadian company, and dividends are subject to Canadian tax (15%) taken directly for non-Canadian investors, reducing the amount paid to US/EU investors.
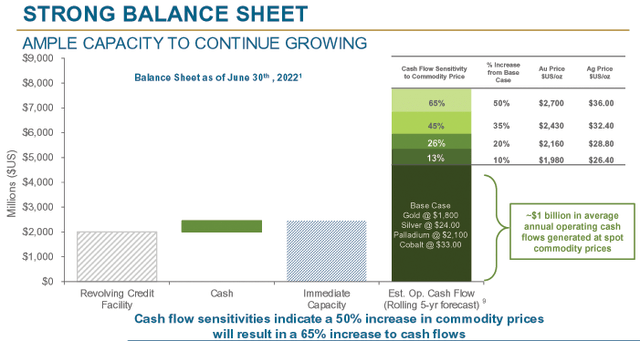
3 – Available capital, no debt, and liquidity
On June 30, 2022, Wheaton Precious Metals had cash and cash equivalents of $448.63 million and no debt outstanding under its Revolving Facility, which is excellent backing from a long-term investor’s perspective.
The company has a $2 billion revolver facility extended to July 18, 2027. Total liquidity of nearly $2.45 billion.
The Company extended its existing undrawn $2 billion revolving term loan (the “Revolving Facility”) with its maturity date now July 18, 2027. As part of the extension, Wheaton added a sustainability-linked element which impacts the interest rate paid on drawn amounts and standby fees. (source)
The chart below shows a significant net cash position:
WPM Quarterly Cash versus Debt history (Fun Trading) Also, WPM owns total long-term equity investments of $60.80 million in 2Q22 (Bear Creek, Sabina, Kutcho, and others). WPM Balance Sheet Presentation (Wheaton Precious Metals) WPM Quarterly Production in GEO history (Fun Trading) This quarter’s gold equivalent production was 162,569 GEOs compared to 190,272 GEOs last year. Production is Silver equivalent ounces SEO was 12,193. The company sold 170,371 GEOs during 2Q22, down 3.5% from the prior-year quarter’s 176,502 GEOs. It was a weak production slowly declining for the last four quarters. Salobo and Stillwater negatively affected production this quarter, and the company had to lower its guidance for 2022.
4 – Production in gold equivalent ounce and trend details
Wheaton’s metals production was:
- 68,365 Au ounces.
- 6,537 Ag K ounces.
- 3,899 Pd ounces.
- 136 Lbs of Cobalt.
WPM Quarterly ratio Gold silver history (Fun Trading) The gold/silver ratio is 1:75.0 this quarter (see chart above).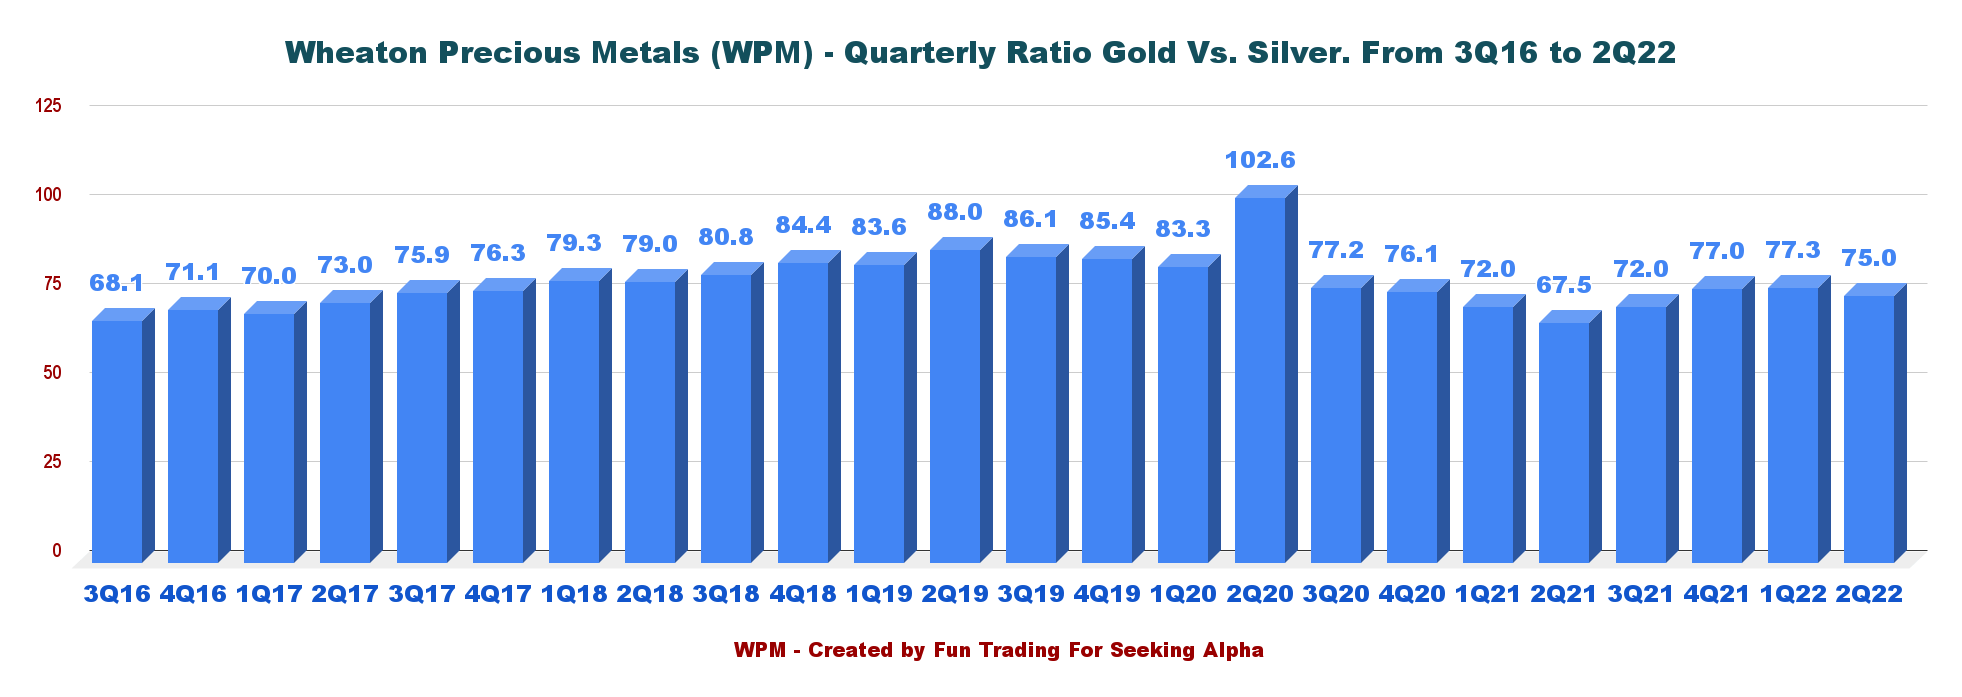
5 – 2021 Reserves (Total Proven and Probable) and 2022 guidance and recent acquisitions
5.1 – Reserves 2021
As indicated in my previous article, the total mineral reserves of P1+P2 are 14.01 Moz of gold, 567.9 Moz of silver, 0.63 Moz of palladium, 0.17 Moz of platinum, and 31.4 Moz of cobalt.
5.2 – 2022 Guidance has been updated. Total GEOs are down 9.6% (mid-point) from the preceding guidance.
The company said that given the proposed termination of the Keno Hill PMPA, lower production from Stillwater due to severe weather and flooding in the state of Montana in June, and lower than expected production at Salobo, it is lowering production guidance by nearly 10%.
WPM 2022 Guidance (WPM release)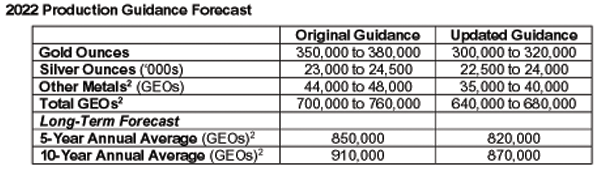
The gold production for 2022 is anticipated to be lower than 2021. However, the company expects a gold equivalent production of 640K to 680K, down from 700K to 760K for 2022.
With the 5-year annual average from 2023 to 2026, WPM guides an average of 820K GEOs per year, down from 850K. The company also indicates a 10-year yearly average from 2022 to 2031, expected to be an average of 870K GEOs, down from 910K.
5.3 – The company is involved with seven projects with growth potential.
- Santo Domingo gold project – Completion 2024
- Fenix Gold Project – Completion Q4 2022
- BlackWater gold and silver project – Completion Q1 2024
- Marathon Gold and Platinum project – Completion Q3 2024
- Curipamba gold and silver project – Completion 2024
- Black River gold project – Completion Q1 2025
- Marmato Gold and silver Project
WPM Marmato Project update Presentation (Wheaton Precious Metals)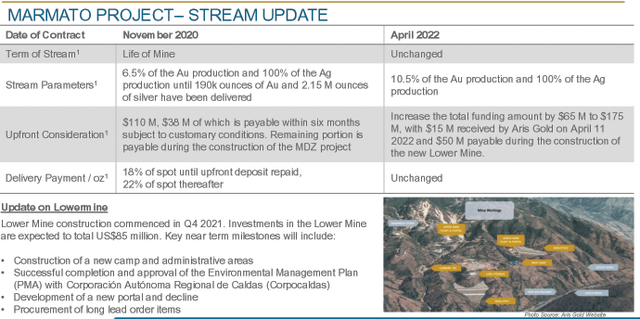
Technical Analysis and Commentary
WPM TA Chart short-term (Fun Trading)
Note: The chart is adjusted for the dividend.
WPM forms a descending triangle pattern with resistance at $34.5 and support at $32.
The trading strategy is to sell about 30%-35% of your position between $34.50 and $36.05 with potential higher resistance at $41.40.
I believe it is safe to accumulate WPM below $32. However, if the stock breaks down, the next lower support is $30.25.
The gold price tumbled today, with the FED turning increasingly hawkish against inflation. On the other side, China is struggling and is cutting interest to stimulate its weakening economy. The market’s response is to sell both oil and gold.
Thus, the dominant strategy that I regularly promote in my marketplace, “The gold and oil corner,” is to keep a core long-term position and use about 30% to trade LIFO while waiting for a higher final price target for your core long-term position between $55 and $60.
Trading LIFO allows you to sell your most recent purchases, assuming a profit while keeping your long-term position until your position has appreciated enough to consider selling it.
Note: The LIFO method is prohibited under International Financial Reporting Standards (IFRS), though it is permitted in the United States to generally accepted accounting principles (GAAP). Therefore, only US traders can apply this method. Those who cannot trade LIFO can use an alternative by setting two different accounts for the same stock, one for the long term and one for short-term trading.
Warning: The TA chart must be updated frequently to be relevant. It is what I am doing in my stock tracker. The chart above has a possible validity of about a week. Remember, the TA chart is a tool only to help you adopt the right strategy. It is not a way to foresee the future. No one and nothing can.
Author’s note: If you find value in this article and would like to encourage such continued efforts, please click the “Like” button below as a vote of support. Thanks.
Be the first to comment