

mesut zengin/iStock via Getty Images
The Wells Fargo Advantage Global Dividend Opportunity Fund (NYSE:EOD), aka Allspring Global Dividend Opportunity Fund, is a closed-end fund I would avoid. I believe it pays an unsustainable distribution yield that causes NAV destruction in the long-run. I prefer the sustainable distribution model of Tri-Continental Corporation (TY).
Fund Overview
The Wells Fargo Advantage Global Dividend Opportunity Fund is a closed-end-fund (“CEF”) that seeks to provide a high level of current income, with a secondary objective of capital appreciation. It was formerly known as the “Wells Fargo Global Dividend Opportunity Fund,” but changed its name when Wells Fargo & Co. (WFC) divested the asset manager, Allspring Global Investments, at the end of 2021. The EOD fund has approximately $200 million in assets as of October 28, 2022.
Strategy
The EOD Fund allocates its assets between two separate investment strategies. Approximately 80% of assets are allocated to an equity sleeve that primarily invests in common stocks and equity securities offering above-average potential for current and/or future dividends. The equity portfolio is broadly diversified among sectors and geographies. The other 20% of assets are invested in high-yield debt. The fund also writes call options on its equity positions to generate additional income and employs leverage to enhance returns.
Portfolio Holdings
As an investor trying to analyze the EOD fund, one complaint I have is that the Allspring website is very sparse and does not contain much useful and/or up-to-date information on the fund except for a data dump of the fund holdings as of August 31, 2022 (almost 2 months out of date).
From Morningstar, we can see this portfolio holding information summarized in a readable format, shown below. The EOD fund’s portfolio is 47% invested in U.S. equities, 32% in international equities, and 19% in fixed income (Figure 1).
Figure 1 – EOD Fund asset allocation (morningstar.com)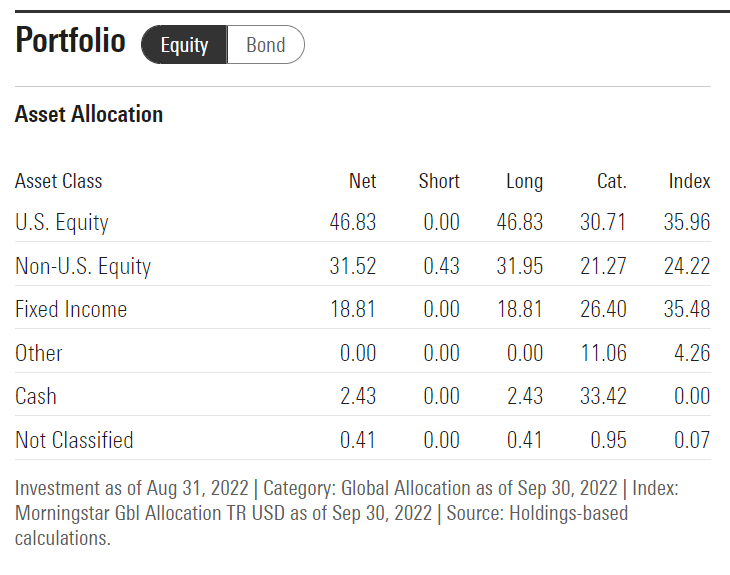
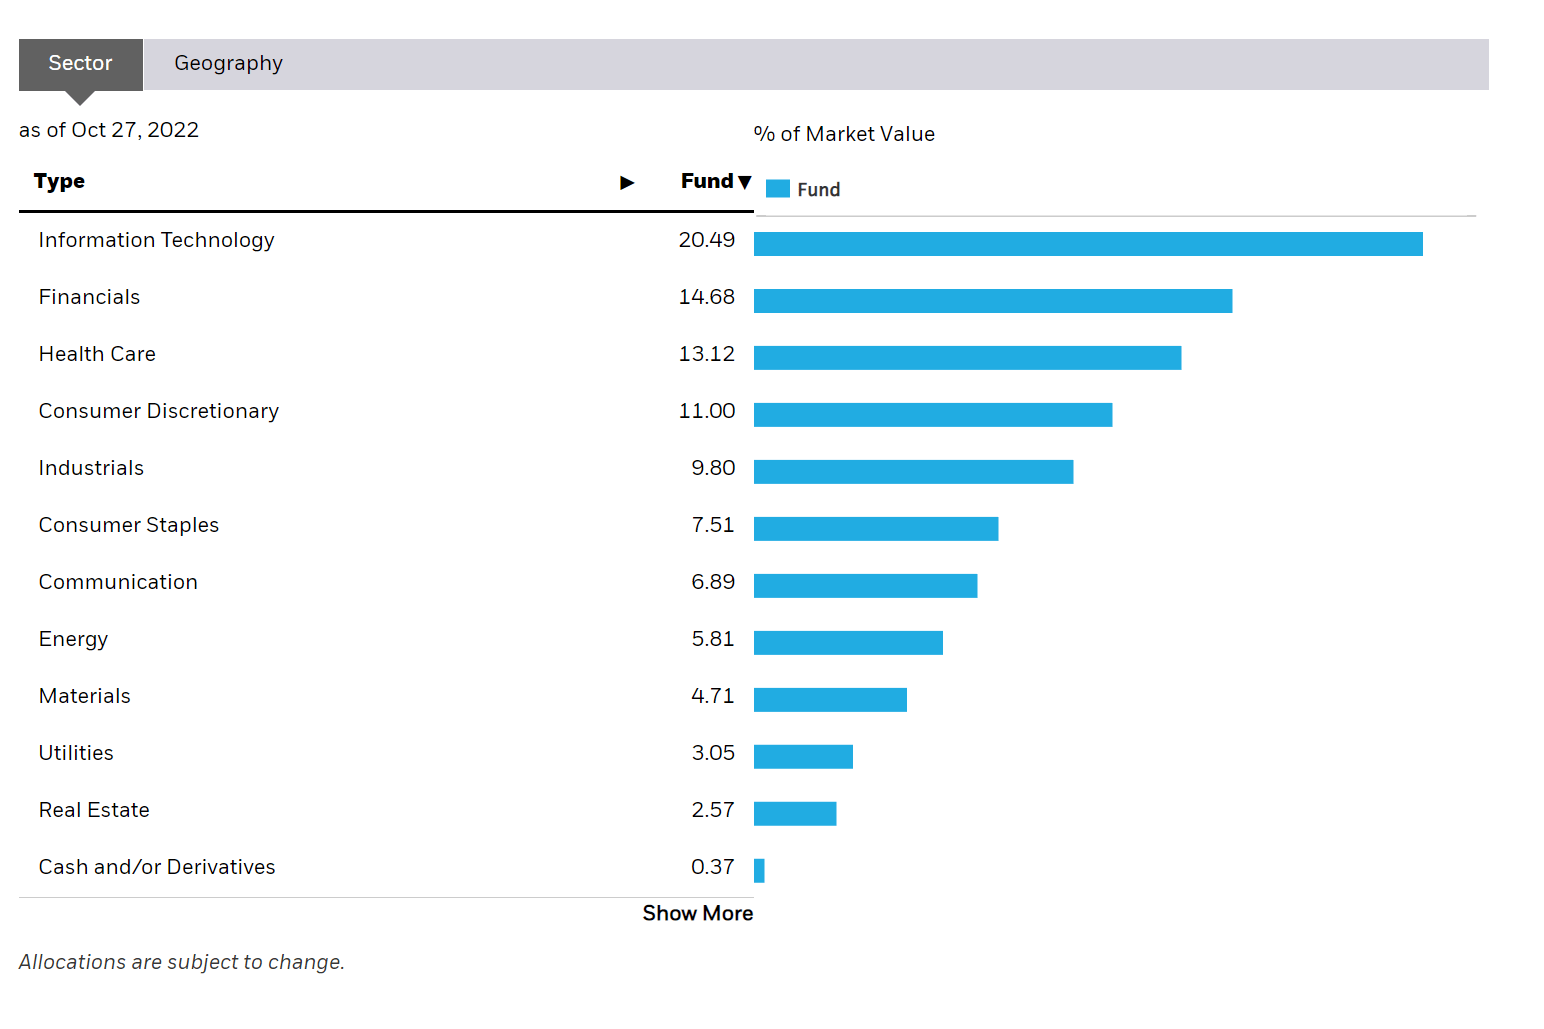
The fund’s equity sector allocation is shown in Figure 2. The EOD fund’s sector weights are generally similar to its benchmark index, as represented by the iShares MSCI ACWI ETF’s (ACWI) sector allocation as shown in Figure 3. The only notable difference is an overweight by the EOD fund in financial services at 18.6% vs. 14.7%.
Figure 2 – EOD Fund sector allocation (morningstar.com) Figure 3 – MSCI ACWI Sector Allocation (ishares.com)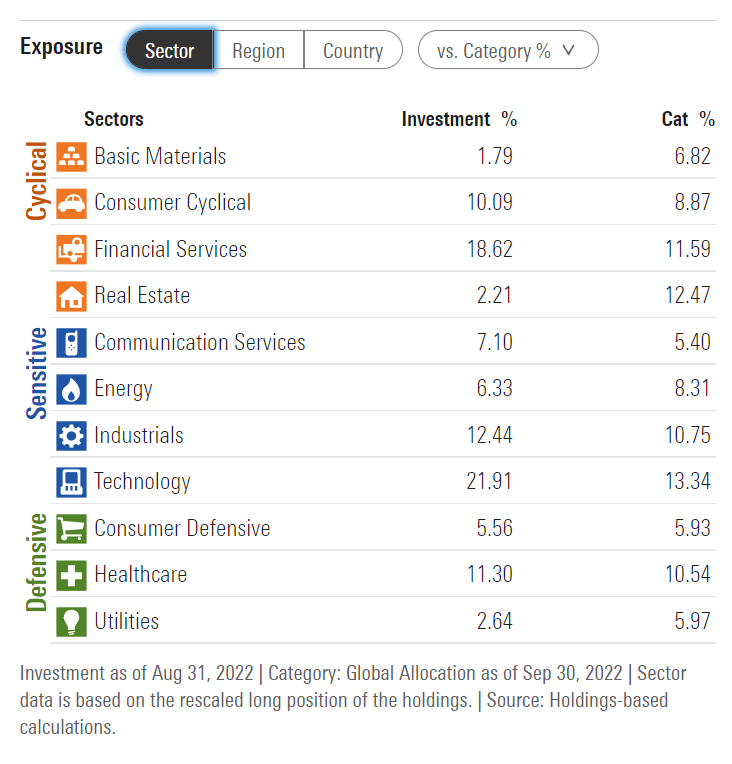
Returns
The Allspring website also does not show any performance data. From Morningstar, we get the performance data shown in Figure 4. On a 3/5/10Yr basis, the EOD fund has delivered generally poor returns of -0.7%/1.0%/2.9% average annualized returns to September 30, 2022. YTD, the EOD fund has returned -25.6%. Note the returns generated by the fund are 3rd and 4th quartile, compared to peers selected by Morningstar.
Figure 4 – EOD Fund returns (morningstar.com)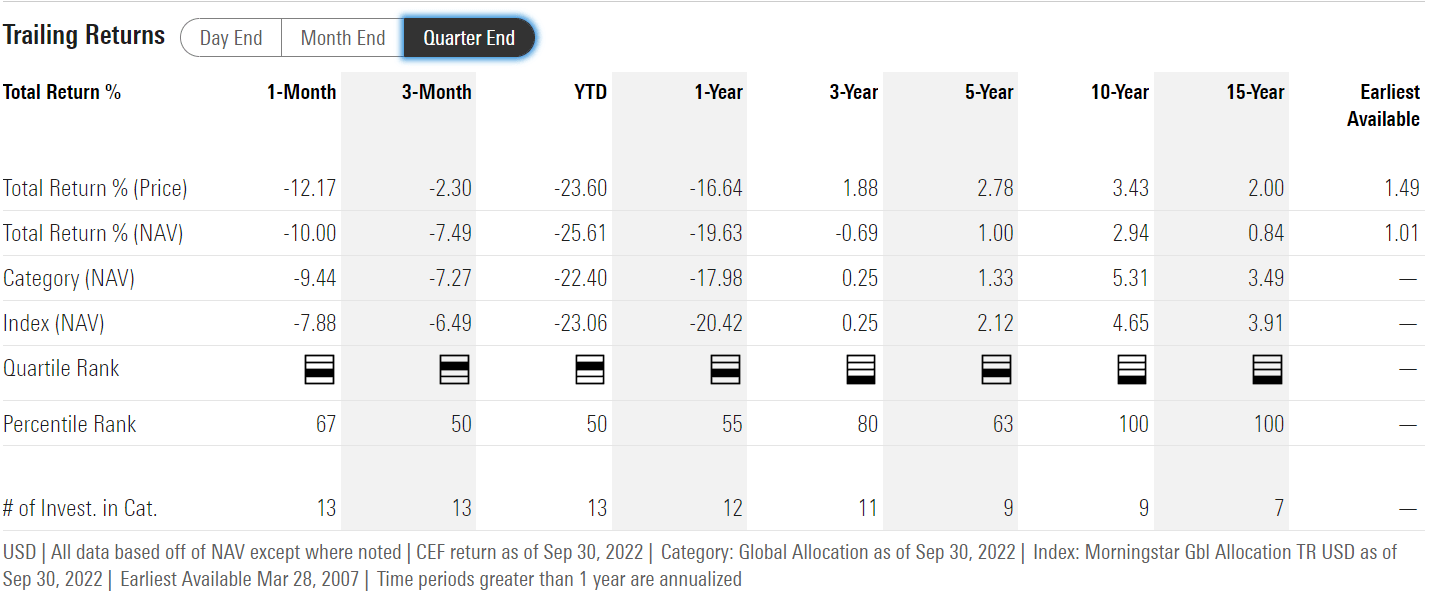
Distribution & Fees
As an income fund, the EOD fund does not disappoint. It has a LTM distribution rate of $0.53 / share, or 11.4% current yield. The EOD pays a quarterly distribution. However, the distribution rate is not fixed.
It is also notable that the fund’s distribution rate has been cut many times in the past. When the fund was first launched, it paid a $0.50 / share quarterly distribution. However, that was cut to $0.28 / share in 2009. In 2012, the distribution was cut to $0.21 / share, then $0.18 / share in 2014, and $0.135 / share in 2016. Since 2017, the fund no longer pays a fixed amount, but rather a variable one that has varied from $0.165 in Q1/2018 to $0.0129 in Q3/2019 (Figure 5).
The most recent distribution amount of $0.1276 / share was paid on October 3, 2022.
Figure 5 – EOD Fund distribution (Seeking Alpha)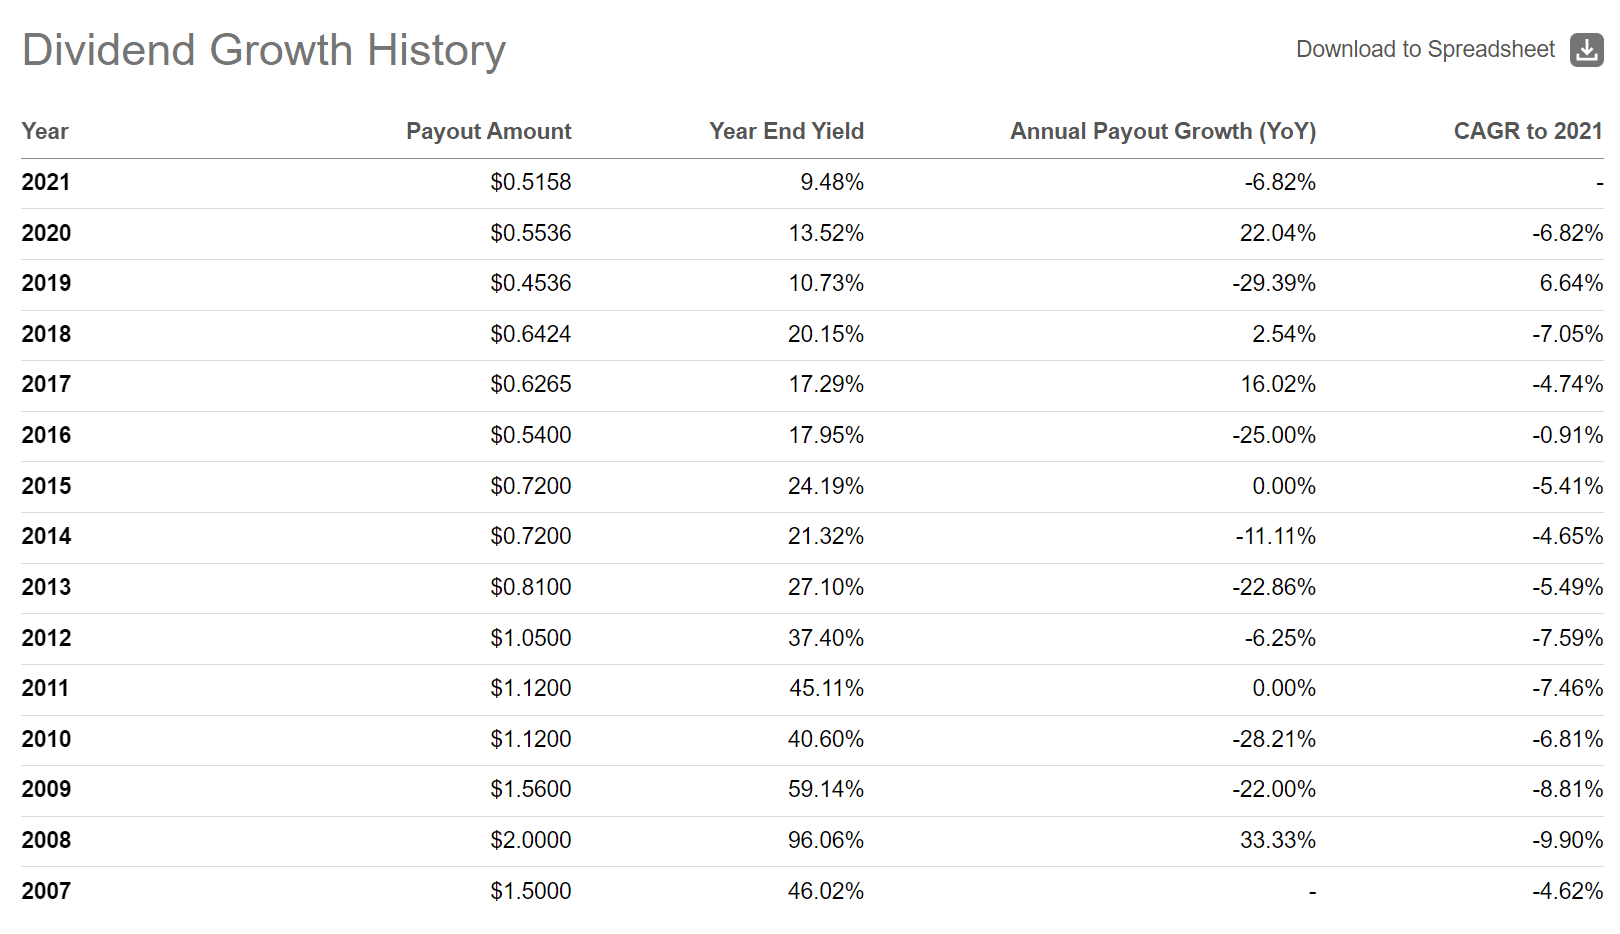
The EOD fund has an automatic dividend reinvestment option that allows investors to reinvest quarterly distributions at the NAV price, up to a maximum of 5% discount to the market price. If the fund is trading at a discount to NAV, the fund will acquire shares on the open market on behalf of investors at the market price.
A final note on EOD’s distribution. Again, a criticism of the Allspring website, but I was not able to find any information regarding the allocation of EOD’s distribution between Net Investment Income (“NII”), Capital Gains, or Return of Capital (“ROC”). Digging through the semi-annual report as of April 30, 2022, I was able to find the financial summary shown in Figure 6. We can see that a significant part of the annual distribution in the past few years has come from ROC (Figure 6).
Figure 6 – EOD Fund Summary (EOD Fund Semi-annual Report April 2022)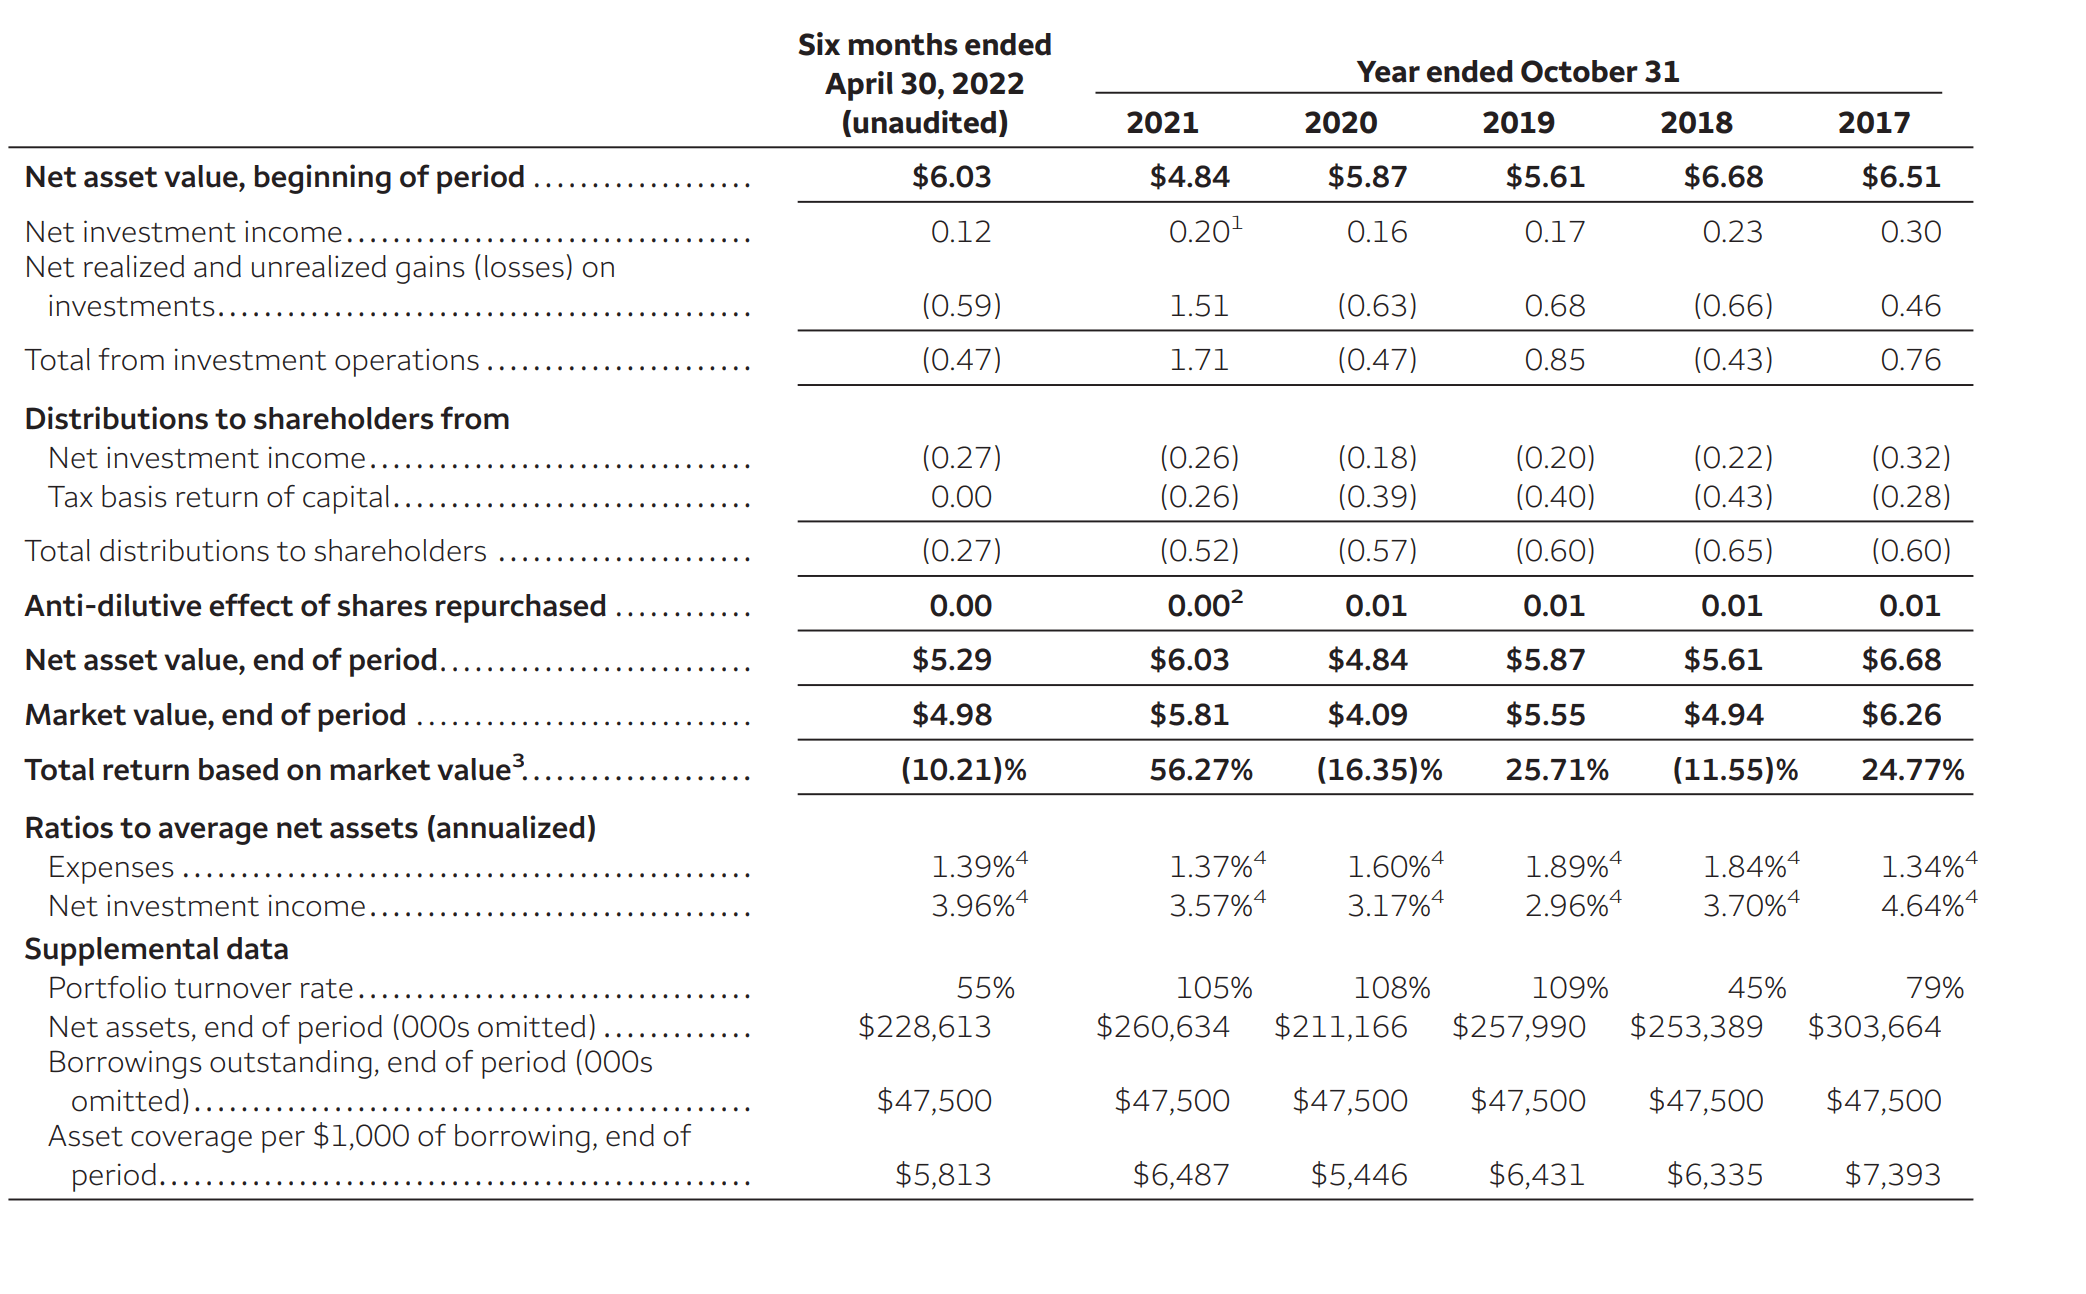
Sustainable vs. Unsustainable Distribution
Recently, I wrote a positive article on Tri-Continental Corporation, praising its strong long-term returns and variable distribution model that provides a high base distribution (~4% yield) and potential for large special payouts in good years. In contrast, EOD seems to be yet another example of closed-end funds that choose to pay unsustainably high distributions that cause NAV destruction.
EOD began life in March 2007 as a $20 IPO with a ~$19 NAV after IPO fees. It initially paid investors $0.50 / qtr in distributions, or a 10% market yield. However, as its average annual return was only 1% of NAV (from Figure 4 above), every distribution paid eats away at the NAV, reducing the fund’s ability to earn income to service the distribution.
Furthermore, every few years (typically during market crises), EOD’s distribution rate is cut, and the stock tanks. Today, EOD’s NAV is only $4.60 / share and it only pays an LTM distribution of $0.53, roughly 75% less than in 2007.
Figure 7 compares the NAV performance of EOD vs. TY. Since inception, EOD has lost 76% of its NAV. Measured in the same time frame, TY’s NAV has gained 18%, from $25.71 on March 30, 2007 to $30.36.
Figure 7 – EOD vs. TY NAV (cefconnect.com)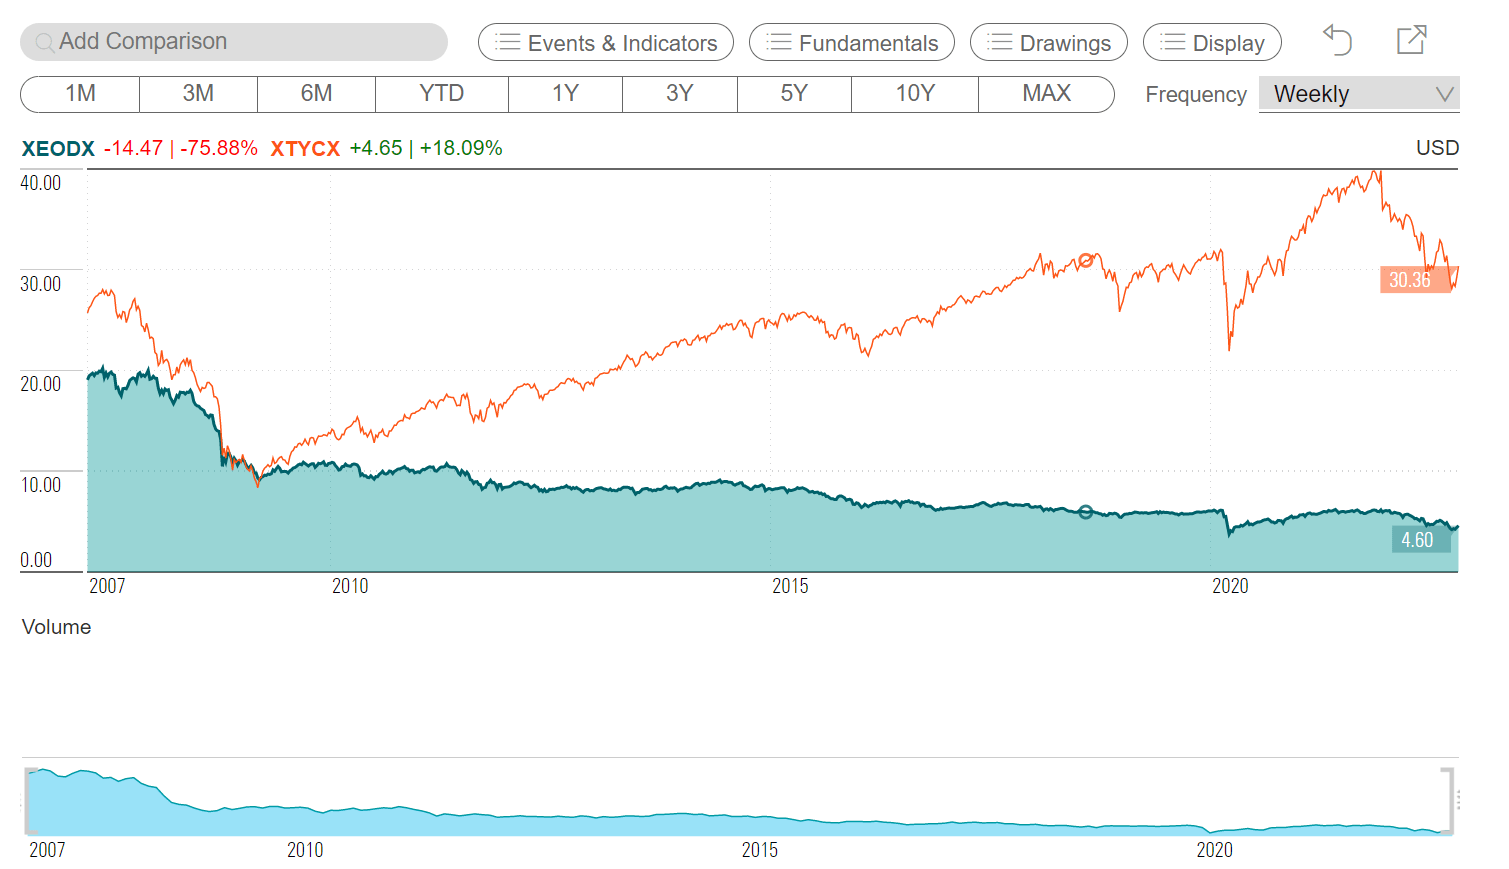
Cumulatively, EOD has paid $14.15 in distribution. From 2007 to 2021, TY has paid $20.35 in distribution.
So in summary, EOD paid investors $14.15 in distribution (71% of initial capital) but lost over $14.47 in NAV. In contrast, TY paid $20.35 in distribution (79% of March 30, 2007 NAV of $25.71) and gained $4.65 (18%) in NAV over the same time frame.
The lesson is that investors focused on the yield alone may suffer massive declines in both capital and income if the fund they choose pays out an unsustainable distribution rate. Investors who judge funds on total returns can actually come out ahead in both.
Fees
The EOD fund charges a relatively high expense ratio of 1.39%. For reference, the TY fund charges 0.61%.
Conclusion
In conclusion, I would avoid the EOD fund. As shown above, it is yet another example of a closed-end fund that pays an unsustainably high distribution yield to attract investors. The high distribution rate eats away at the NAV, such that every few years, the distribution becomes unsustainable and needs to be cut. In the end, investors are left with a NAV haircut and lowered income. I prefer the sustainable distribution model of Tri-Continental.
Be the first to comment