imagining
The ongoing market rout has rerated many stocks. Some quality stocks are still relatively expensive but others are already in the bargain bin. This is precisely where we find Enterprise Products (NYSE:EPD).
Short-term, EPD is often trading in sync with oil pricing in, at least partially, coming recession. Responding to the downward trend in oil prices, investors are selling baskets of oil and gas stocks (in the form of ETFs, mutual funds, or otherwise) that contain EPD. This is exacerbated by the overall pressure on stocks due to Fed actions, recession expectations, and geopolitics.
In fact, EPD’s economic performance is not particularly correlated to the price of oil and gas due to the company’s long-time strategy. From time to time, it creates an opportunity to buy EPD at value.
Enterprise Products’ economic performance and oil price
EPD is gathering, processing, storing, and transporting fossil fuels via its network of gathering and processing plants, pipelines, storage sites, terminals, and petrochemical production facilities. The operations are structured to minimize the bottom line sensitivity to commodity prices by either charging fees for using facilities or capturing spreads between commodity buy and sell prices.
EPD measures its economic performance via the segment gross operating margin or GOM. It is an accrual non-GAAP measure that is derived from the Operating Income. The figure below shows how it is practically done (dollars in this post are in millions except per share):

10-K
GOM is a measure of cash flows similar to EBITDA before adjustments and excluding G&A expenses which are rather flat over many years.
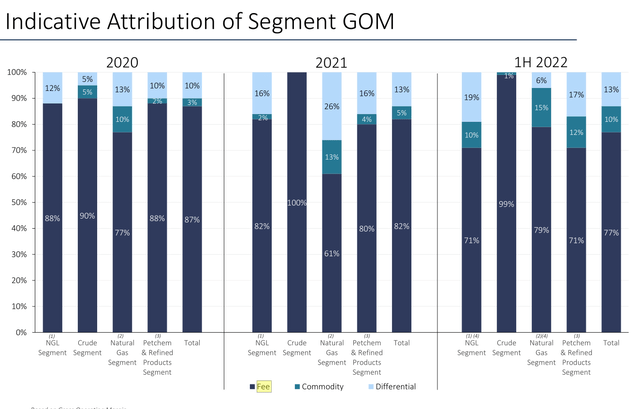
GOM is expected to be rather resistant to the changes in commodity prices as the lion’s share of EPD’s margins is generated via charging fees for services as illustrated below:

Company’s presentation
In reality, the situation is more complicated as some of the fees are volume-dependent and can be indirectly related to commodity prices. One can gain a better understanding by directly checking GOM variability vs commodity prices.

Company’s filings and Statista
Over years, GOM should be growing in response to capital investments and this is precisely what is happening. The drops in oil prices affect this trend only marginally if at all. It is particularly visible when comparing GOM during years of low prices (2015-2017 and 2020) to GOM of 2014 and 2019 respectively.
This exercise demonstrates convincingly that EPD’s business is mostly insulated from variations in commodity prices.
EPD’s distribution growth rate
EPD appears a dividend investor’s dream: the yield is high; distributions are tax-advantaged due to the MLP structure but without its negatives (such as incentive distribution rights, etc.); distribution coverage is secure (~1.9 currently), and the balance sheet is strong (~3.1 leverage and BBB+ credit rating); the payment history is perfect – 24 years of uninterruptible dividend growth at 6+% CAGR; insiders own about one-third of the company.
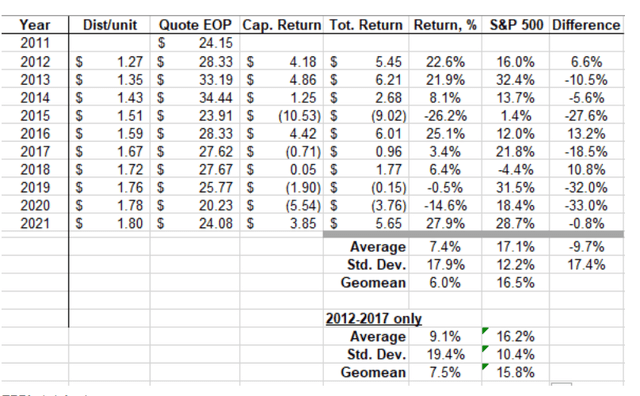
Quite often, investors buy EPD due to the arguments above without doing the valuation exercise. The perils of this approach can be seen in the table below which is reproduced from one of my older articles.

EPD historical returns (Author and company’s filings)
First, please note that in 2015 and 2020 the EPD stock (but not the company!) performed poorly which coincided with drops in barrel prices. At the end of 2020, for example, EPD was yielding 1.78/20.23 ~ 8.8%. The following years – 2016 and 2021 respectively – were very strong. This suggests a simple strategy of buying EPD when the oil price is dropping, precisely as it is now, even without doing further quantitative analysis.
This table also shows that EPD has been a mediocre stock compared with S&P 500 over a long-time period. It was also more volatile than S&P 500. The results are particularly striking for 2012-2017 presented separately. At that time, EPD was financing its expansion by issuing additional units with fewer constraints on its capital than after 2017.
Having communicated with EPD die-hards before, I can imagine their objection: EPD’s distributions are so high and reliable that they fulfill my monetary/retirement needs regardless of the total return. Suitable for certain investors, this argument seems akin to being happy with a $50K salary without attempting to reach, say, a $70K salary when it is probable though not guaranteed.
I presented this line of thinking to prove a rather obvious point: while EPD’s distribution yield is almost always high, it makes sense to invest only when this yield is above a certain threshold. We plan to derive this threshold and will start by estimating EPD’s expected distribution growth.
Several months ago I published a rather detailed article addressing this issue (The Lure Of Enterprise Products Partners’ Distributions). To make this post inclusive, I will present here only its main results in a condensed form.
EPD measures its ROIC as a ratio of GOM and historical costs of assets without adjusting for depreciation. Over many years, this ROIC has remained remarkably stable at 11-13% with 12% on average. There is no reason to think that some future projects will produce a higher ROIC no matter what kind of assets will be put into service. If it were possible EPD would have already achieved a higher ROIC. This is contrary to some investors’ hopes that PDH-2 or oil export terminal or any other project will cause drastic changes as none of them will be free from the gravitational force of sizable capex.
EPD invests only about 34% of its adjusted cash flow from operations into growth projects (adjusted CFFO is equal to GAAP CFFO less changes in working capital). The rest of the adjusted CFFO is needed for distributions, buybacks, and sustaining capex. Without leverage, 12% ROIC can produce 0.34*0.12 ~ 4% of growth in adjusted CFFO and the same 4% growth in distributions.
Applying 50% leverage for growth projects at 6% interest will produce 6% growth in distributions which appears to be the upper limit for the internal financing business model. In fact, EPD has beaten this figure only once in recent history: in 2013, the distribution grew by 7% but at that time, EPD was financing its growth by issuing new units.
We expect that EPD management will use leverage more conservatively than fifty-fifty as strategic safety is worth more than a bit of extra growth. The recent Navitas acquisition of early 2022 was financed without issuing long-term debt even when interest rates were lower than today. Under this scenario, ~5% is a reasonable estimate of the upper limit of the long-term distribution growth.
In 2022, in a rather favorable macro environment and with strong benefits from the Navitas acquisition, distributions will grow at 4.4% if Q4 distributions will be the same as in Q3. This is in line with our model of 4-5% growth.
At what yield EPD is a buy?
Due to its strategy of gradual distribution increases and minor buybacks, EPD is particularly fit for using a simple dividend growth valuation model. But some adjustments are needed to reflect the expectations of finite life for fossil fuels.
Many EPD investors are confident that the company’s infrastructure will remain critical and in short supply forever. I do not know whether they are right or not but I know that I was confident but eventually wrong quite a few times in my life. Warren Buffett often admits his investment mistakes in his annual letters and that should teach the rest of us some caution. In the situation when about half of the population (at least in developed nations) argue strongly against fossil fuels, I believe one has to adjust for the possible finite life of the oil and gas infrastructure REGARDLESS of what one thinks.
Currently, the demand for oil and gas infrastructure is increasing due to the consequences of the war in Ukraine and it should allow EPD to find new profitable projects. But it has nothing to do with the gradual green energy growth and eventual electric vehicle dominance.
It is possible that after modifications, parts of the oil and gas infrastructure will be used for hydrogen and/or carbon dioxide sequestration. Unfortunately at this point, it is just a speculation and we lack data to account for it numerically.
Summing up the discussion above, we come up with the formula to value EPD:
Price = k*distributions/(r-g),
where k is the coefficient to account for the fossil infrastructure finite life, r is the discount rate, and g is the distribution growth. “Distributions” mean forward-looking annual distributions but without losing much accuracy, we can replace them with the last quarter’s annualized distributions.
Rearranging this formula and noticing that distributions/price is yield we come up with the final formula for this post:
Yield = (r-g)/k.
When the current yield is higher than the one calculated via this formula, EPD is a buy.
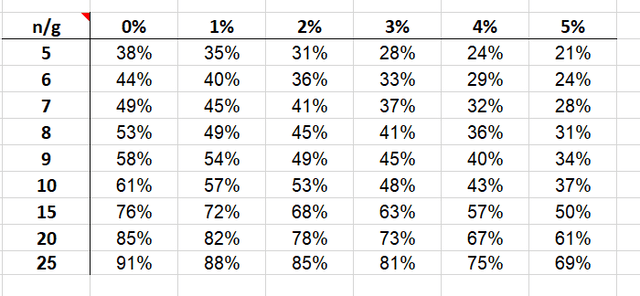
We can estimate the coefficient k by discounting future distributions over finite life as opposed to perpetuity in the dividend growth model. I already did it in one of my older posts on EPD and will reproduce the results here:

Corrections to the dividend growth model (Author)
This table directly calculates k based on the life of assets n and distribution growth rate g. We are interested in the last two columns that correspond to the growth of 4-5%.
EPD consists of four segments – Natural Gas, Natural Gas Liquids, Oil, and Petrochemicals – and they are not equally vulnerable to green initiatives. Perhaps, Oil is the most and Petrochemical is the least vulnerable.
Oil consumption will be in high demand at least for the next 15 years when combustion engine cars are on the road in quantities. Since other segments are expected to be more resilient to changes, I would estimate k to be slightly higher than the figures in the bottom right corner of the table. Specifically, I would estimate k ~ 80% for our rough calculations.
Using a 10% discount rate and the more conservative 4% figure for the distribution growth, we can finally estimate the critical yield from the formula as (0.10-0.04)/0.8=7.5%. Certainly, this result is nothing more than an estimate.
At the time of writing the current yield is 1.90/22.91~8.3%. It is much higher than our conservative estimate of the critical yield and EPD is a strong buy.
Conclusion
Why would one need this crude math with an EPD yield as appealing as 8.3%? One does not. As mentioned in the post, a simple strategy of buying EPD when the oil price is dropping may be sufficient for practical investing.
But since EPD is always yielding high, the knowledge of this critical 7.5% figure under rather conservative assumptions helps to trade EPD more efficiently. It also helps to understand why EPD is always trading at high yields.


Be the first to comment