

Sundry Photography
Thesis
We updated readers in our post-earnings article urging investors to capitalize on rallies in Enphase Energy’s (NASDAQ:ENPH) stock to cut exposure and rotate. In addition, we gleaned that there have been several notable developments in ENPH’s price action over the past couple of months.
As a result, we find it appropriate to return with a timely update as we present the progress in ENPH’s price action. We noted that its upward momentum stalled decisively in September, corroborating the signals in August.
Therefore, yesterday’s steep selloff should not stun investors, despite some negative commentary from Muddy Waters’ CEO Carson Block on Sunrun (RUN) and Hannon Armstrong (HASI). He slammed the sustainability of their business models and believed their investors could be in for serious trouble. But, investors should note that Block’s commentary is not new, as the firm had already released a bearish report in early August on “The Shade of Sunrun.“
Notwithstanding, we believe the market could have used yesterday’s opportunity as an “excuse” to force out some recent ENPH buyers. Moreover, as we highlighted earlier, ENPH’s upward momentum has already failed resolutely since August.
ENPH could likely consolidate at the current levels in the near term. However, we believe the subsequent selloff is far from over and urge investors still sitting on massive gains to lock in their profits now and cut more exposure.
We reiterate our Sell rating on ENPH.
Investors Need To Be Wary Of The Second Significant Rejection
ENPH price chart (monthly) (TradingView)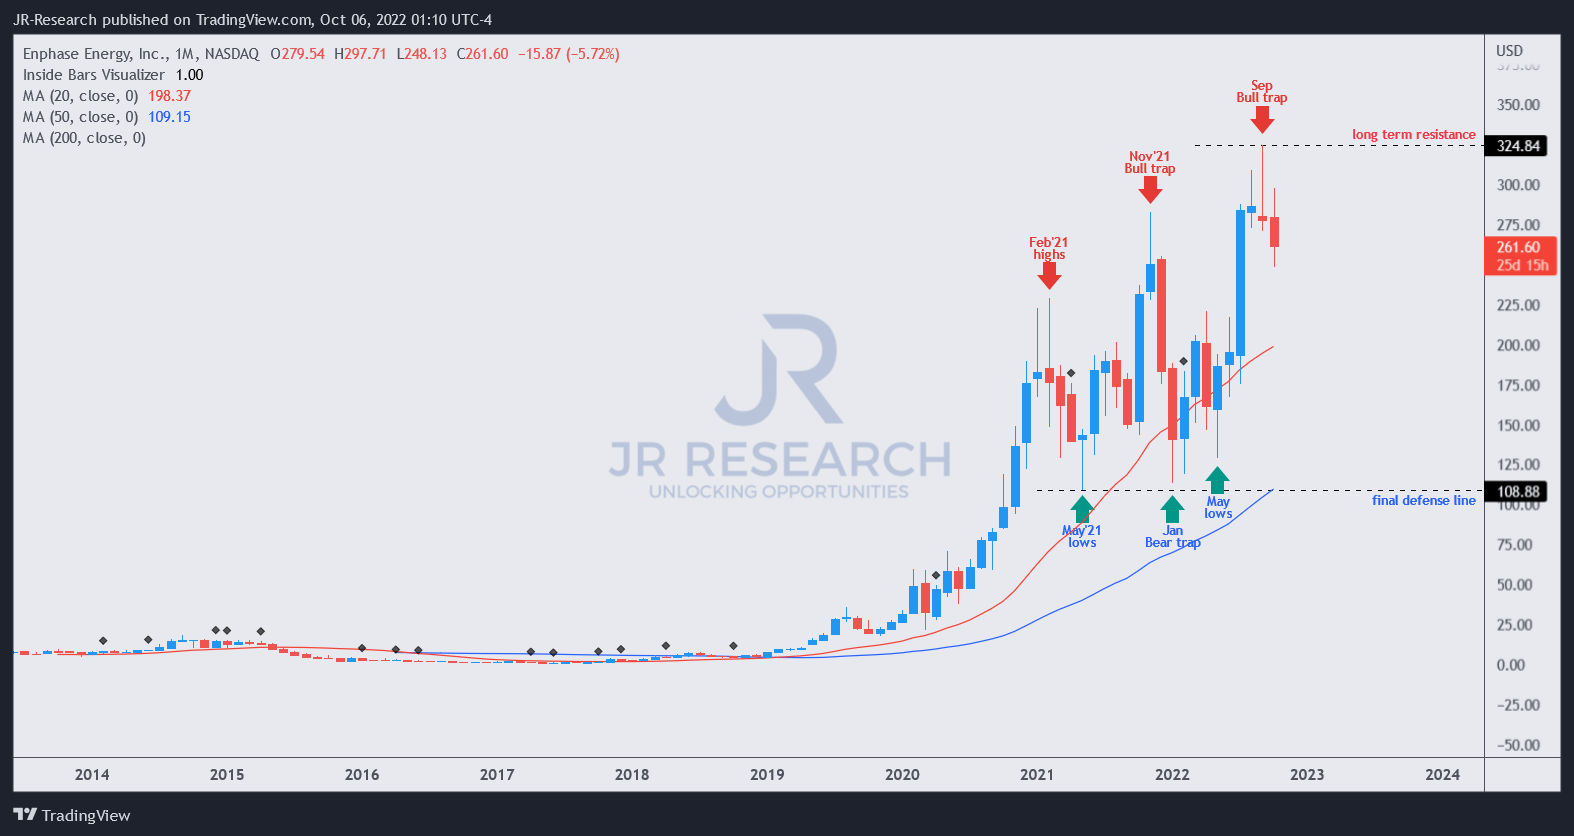
As seen above, the market forced another massive bull trap (indicating the market denied further buying upside decisively) in September, which is a re-entry on the August rejection.
Also, it’s the second significant bull trap after November 2021’s topping action that sent ENPH tumbling nearly 60% to its January lows within two months. Therefore, it’s reasonable to expect ENPH to stage a robust bottom then, predicated on May 2021’s lows.
Consequently, we postulate that the “final line of defense” would be robustly defended by buyers moving ahead. As such, investors looking to add exposure should wait patiently for a potential re-test of that defensive line before moving forward.
Notably, the recovery from its May lows led to a massive surge in July and August, before the market showed its true intentions, as it formed another bull trap taking out November highs.
Investors need to know that these price structures don’t forebode good things ahead. As such, we urge investors to consider getting down that mountain face expeditiously before the market rapidly launches its avalanche of sell orders decimating gains. Need a recent example? Here you go.
BYDDF price chart (monthly) (TradingView)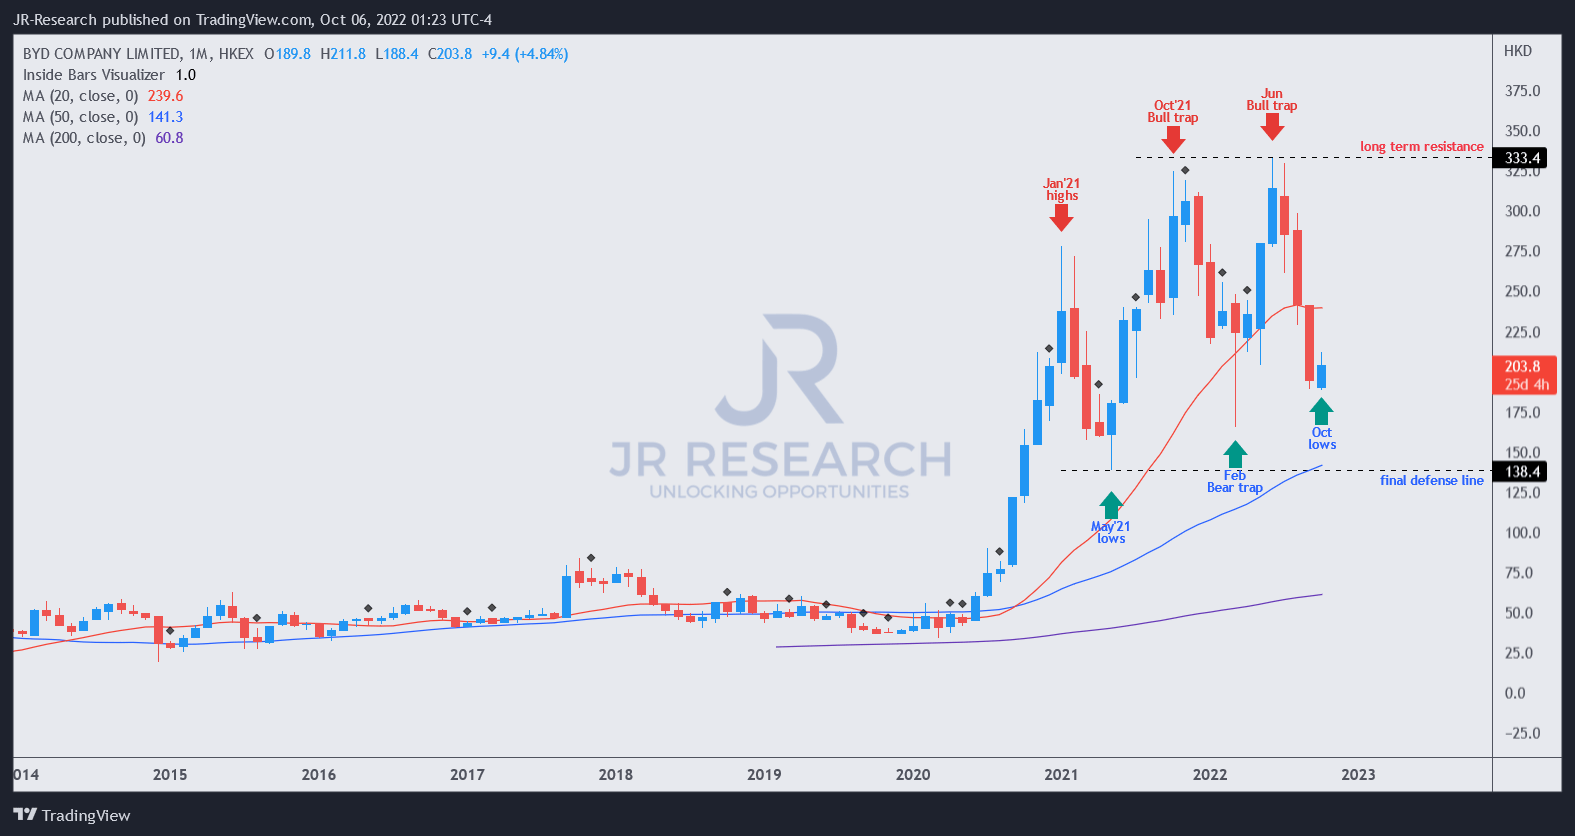
We gleaned that BYD Company’s (OTCPK:BYDDF) stock has a strikingly similar price structure on its long-term chart as ENPH, which we capitalized on previously. We also highlighted to members of our service in late August:
We have closed all our short positions on BYD as it has reached our profit target, thanks to the negative sentiments over XPEV’s recent earnings. (Ultimate Growth Investing – August 24)
As seen above, BYD formed its initial double-top bull trap in October 2021, leading to a subsequent steep selloff to form its February 2022’s lows. It then recovered rapidly toward its July 2022 highs, taking out October 2021’s highs, and similarly formed another validated bull trap like ENPH.
And the selloff after that, you can see for yourself, as the market sent it spiraling down nearly 45% to its recent lows. Does it necessarily mean ENPH would follow the steep selloff in BYDDF? Absolutely not, but we urge investors to consider the clues afforded by such critical price action signals in their assessment.
ENPH’s Valuation Is Expensive
ENPH NTM EBITDA multiples valuation trend (koyfin)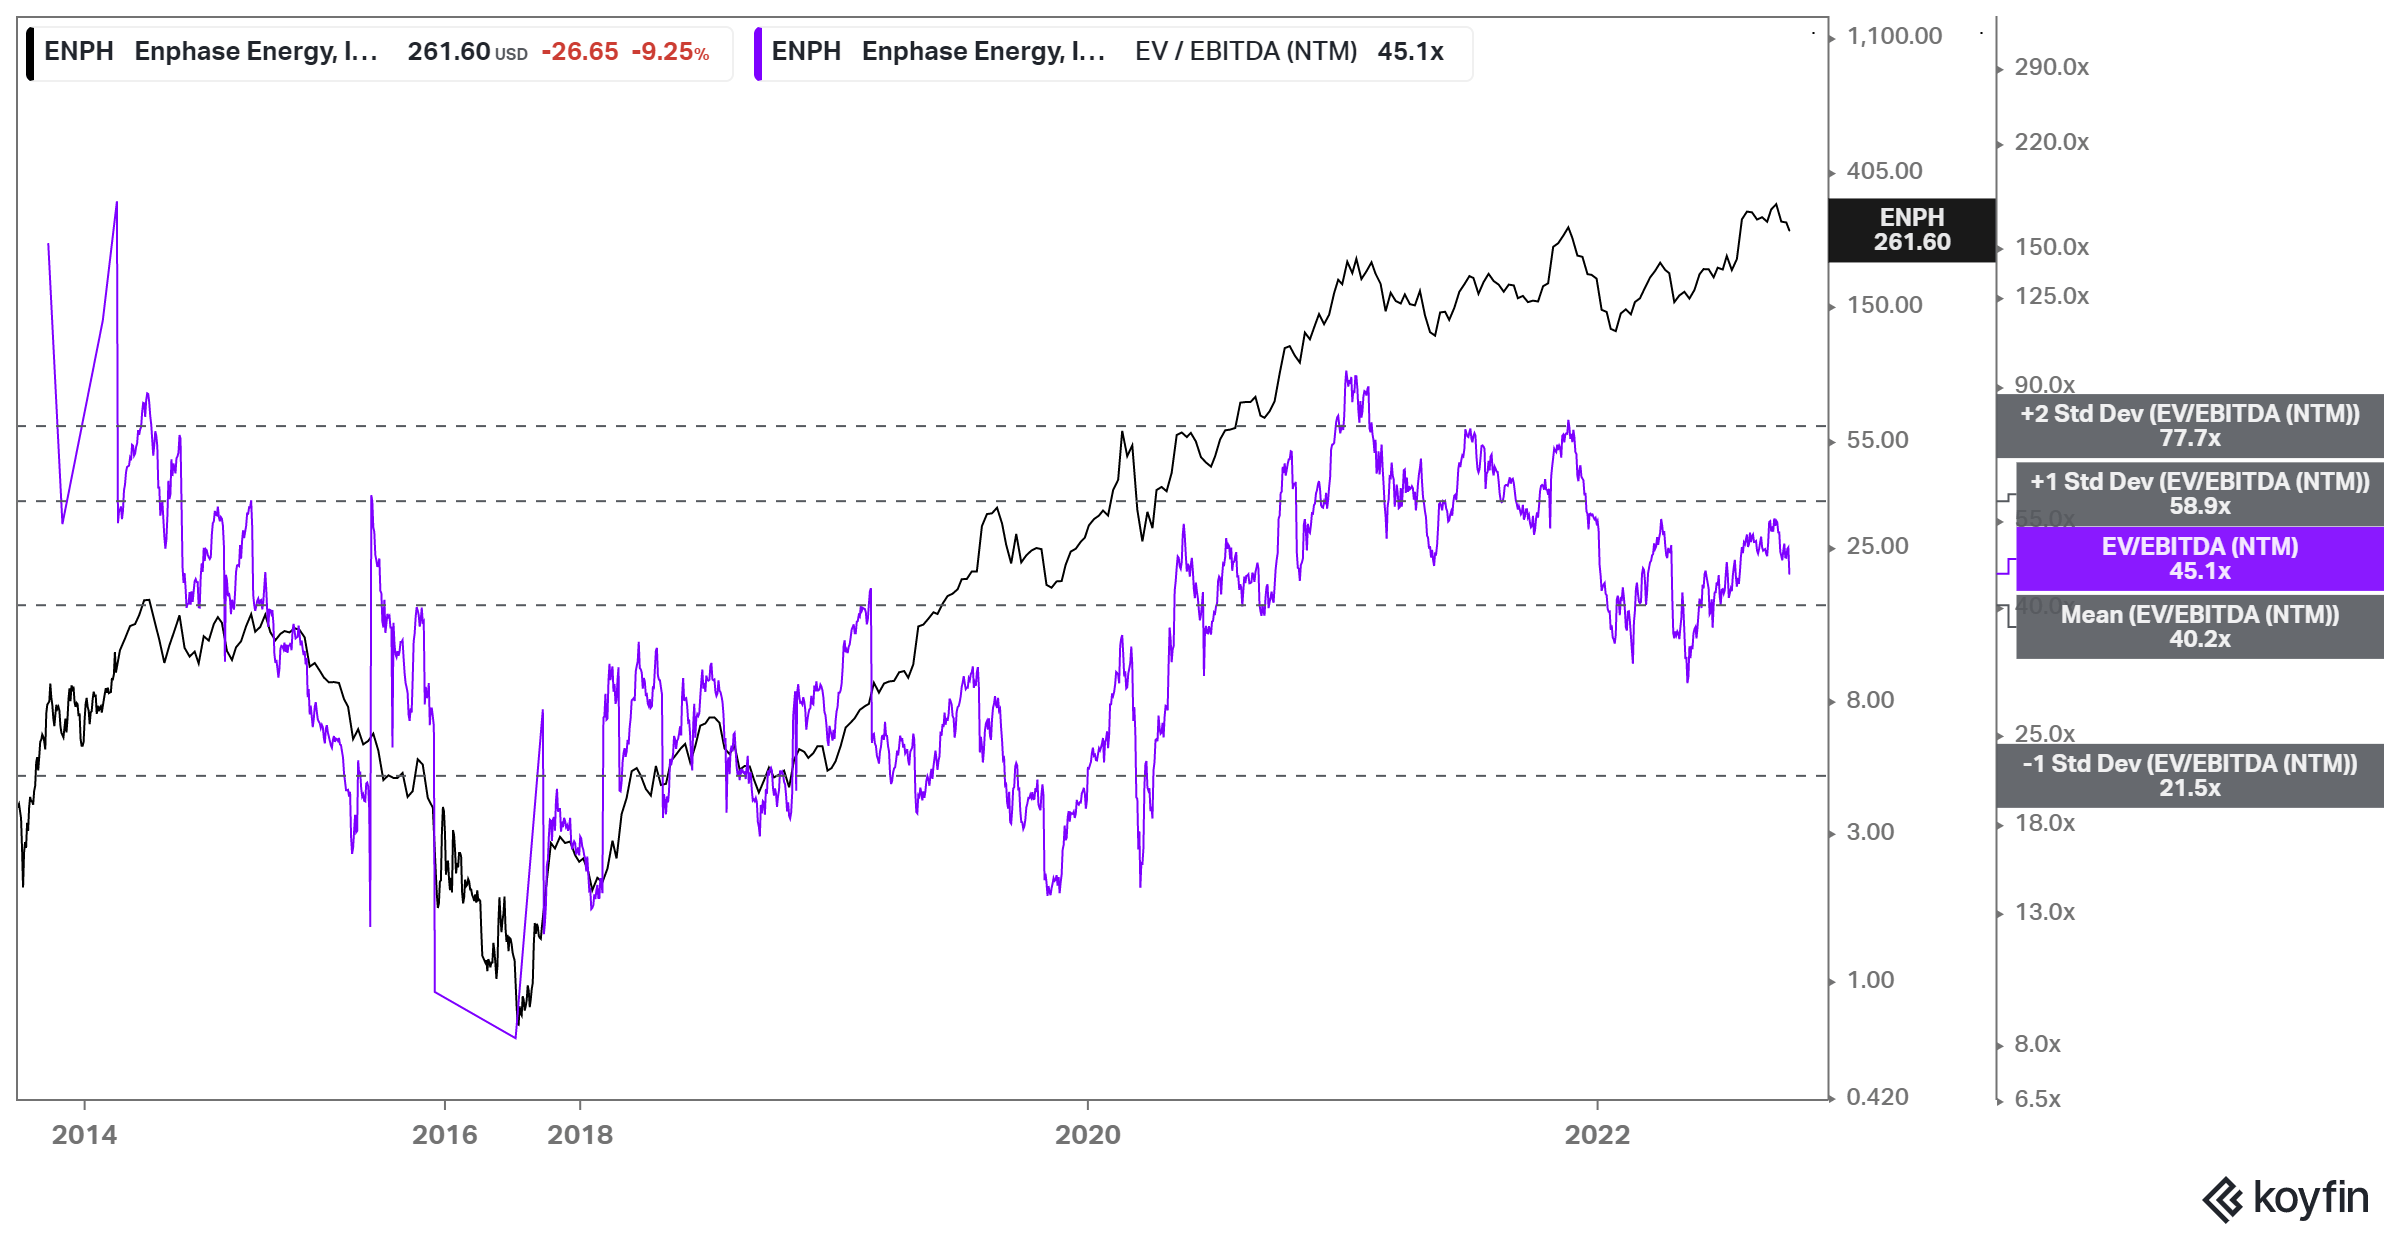
As seen above, the market has clearly de-rated ENPH after its NTM EBITDA multiples closed in on the two standard deviation zone above its 10Y mean in November 2021. ENPH last traded at an NTM EBITDA multiple of 45.1x, above its mean of 40.2x. But, we urge investors to be wary about thinking it’s more attractively valued now.
As highlighted above, ENPH has trouble moving above the one standard deviation zone over its 10Y mean, suggesting the market could de-risk it further.
As such, we urge investors looking to add exposure to apply a generous margin of safety and wait for the mountain to collapse first. We see the zone below the one standard deviation zone under its 10Y mean as a potential opportunity to consider adding exposure. Currently, ENPH seems miles away from that zone, so investors are encouraged to bide their time.
Is ENPH Stock A Buy, Sell, Or Hold?
We reiterate our Sell rating on ENPH.
Investors need to untether emotions from their investing process and consider ENPH’s ominous-looking price structures in their decision-making.
We believe investors ignoring the clues offered by the market could be in for some significant digestion if they continue to sit on their gains without cutting exposure.
It’s time to get out before ENPH comes tumbling down again.
Be the first to comment