

CHUNYIP WONG/E+ via Getty Images
Of all the dividend/distribution companies I follow, Energy Transfer (NYSE:ET) is certainly in the discussion for being the most undervalued. It doesn’t matter where a company’s share price came from, only where it may go in the future. Many companies have fallen during the 2022 bear market/correction, but ET has been undervalued and underappreciated for years. Based on a history that continued to haunt them as a company, ET couldn’t break out of Kelcy Warren’s shadow as long-term shareholders still held a grudge. The pandemic only intensified ET’s decline as it was already declining since the beginning of 2017. ET’s latest attempt to remain above the $10 mark continues to flirt with disaster as units dipped below $10 several times between 6/16/22 and 7/1/22.
Units of ET look to be extremely discounted compared to their peers. I will never understand why the stock market is the one place where shoppers are afraid to buy during sales. Normally people love sales at their favorite retail outlets. Over the past month, units of ET have declined by -15.23% without a good reason. Unlike other sectors, ET’s infrastructure is critical to our way of life. If you were to read through the BP p.l.c. (BP) 2022 Statistical Review of World Energy which was just released, you would find that more natural gas is being used than ever before. Renewables haven’t made a dent in the global energy mix, and regardless of the hype, fossil fuels will be here for decades to come. ET’s assets are almost irreplaceable, and as more contracts get signed to export liquified natural gas (LNG), ET is securing itself on the global stage as an energy infrastructure powerhouse. Today units of ET are at bargain prices, and the yield has been pushed just past the 8% level. It’s almost unthinkable that you’re getting an 8% distribution from a company with tremendous upside potential as their deep discount is based on an unfair biased.
Seeking Alpha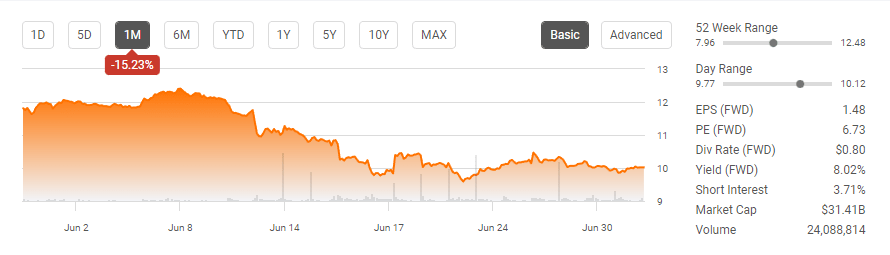
Units of Energy Transfer are still deeply discounted compared to their peers.
We’re headed into Q2 earnings, and while energy infrastructure companies have recently sold off, units of ET are extremely inexpensive compared to their peers. Many investors look toward MLPs as a source of income, and today units of ET represent a valuation play while collecting large distributions. In my peer group, I will use Enterprise Products Partners (EPD), Kinder Morgan (KMI), and MPLX LP (MPLX). For anyone wondering, I will not be using Enbridge (ENB) as they have a full-scale utility company and $8-$9 billion renewable portfolio within their operations.
Market Caps:
- MPLX: $30.02 billion
- ET: $30.92 billion
- KMI: $38.5 billion
- EPD: $53.7 billion
When I evaluate MLPs I like to look at the following metrics to determine if their units are undervalued compared to their peers:
- Adjusted EBITDA to Market Cap Ratio
- DCF to Market Cap Ratio
- Debt to Adjusted EBITDA
- Price to Sales
Adjusted EBITDA, or Earnings Before Interest, Taxes, Depreciation, and Amortization, basically tells you how much cash is left over after paying the operating costs of running its business and excluding one-time charges. I always like to start by looking at the Adjusted EBITDA to Market Cap Ratio to see what type of valuation the market is placing on an MLPs Adjusted EBITDA. In the TTM, ET has generated $11.35 billion in Adjusted EBITDA while MPLX generated $5.6 billion, KMI $7.1 billion, and EPD $6.14 billion. The market has placed a 2.72x multiple on ET’s Adjusted EBITDA while MPLX received a 5.36x multiple, KMI 5.42x multiple, and EPD’s 8.75x multiple. $1 of Adjusted EBITDA is $1 of Adjusted EBITDA no matter how you look at things. Having such a large range is perplexing and what may be even more perplexing is that MPLX and KMI have received basically 2x multiples compared to ET, while EPD’s multiple is more than 3x.
Steven Fiorillo, Seeking Alpha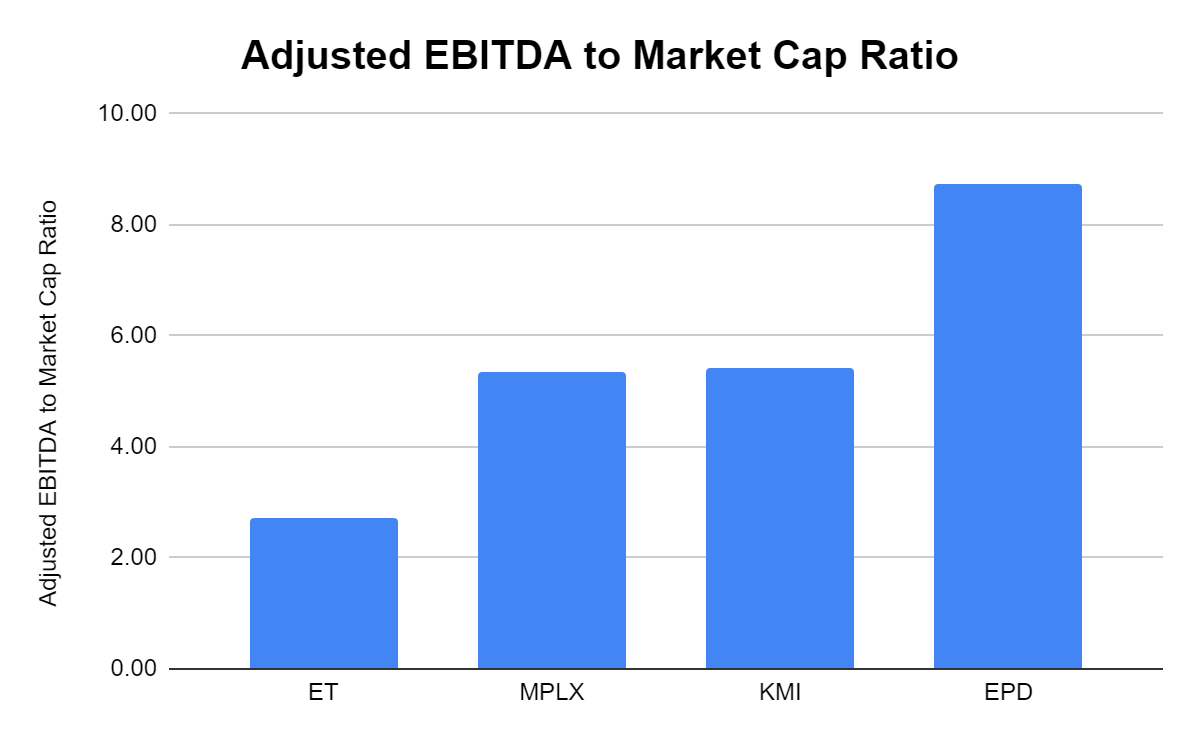
Distributable Cash Flow (DCF) is one of the most important metrics for MLPs and energy infrastructure companies that report on a form 1099. This is the pool of capital which distributions are paid from and capital is retained. I want to pay the lowest multiple for a company’s DCF as this signal’s value. Once again, ET has the lowest valuation at 3.92x its DCF. ET has generated $7.9 billion in DCF while MPLX generated $4.86 billion, KMI $4.59 billion, and EPD $6.71 billion. The market has placed a 6.18x multiple on MPLX’s DCF while EPD has an 8.01x multiple and KMI trades at an 8.4x multiple. Today you’re paying an incredibly low price for ET’s DCF.
Steven Fiorillo, Seeking Alpha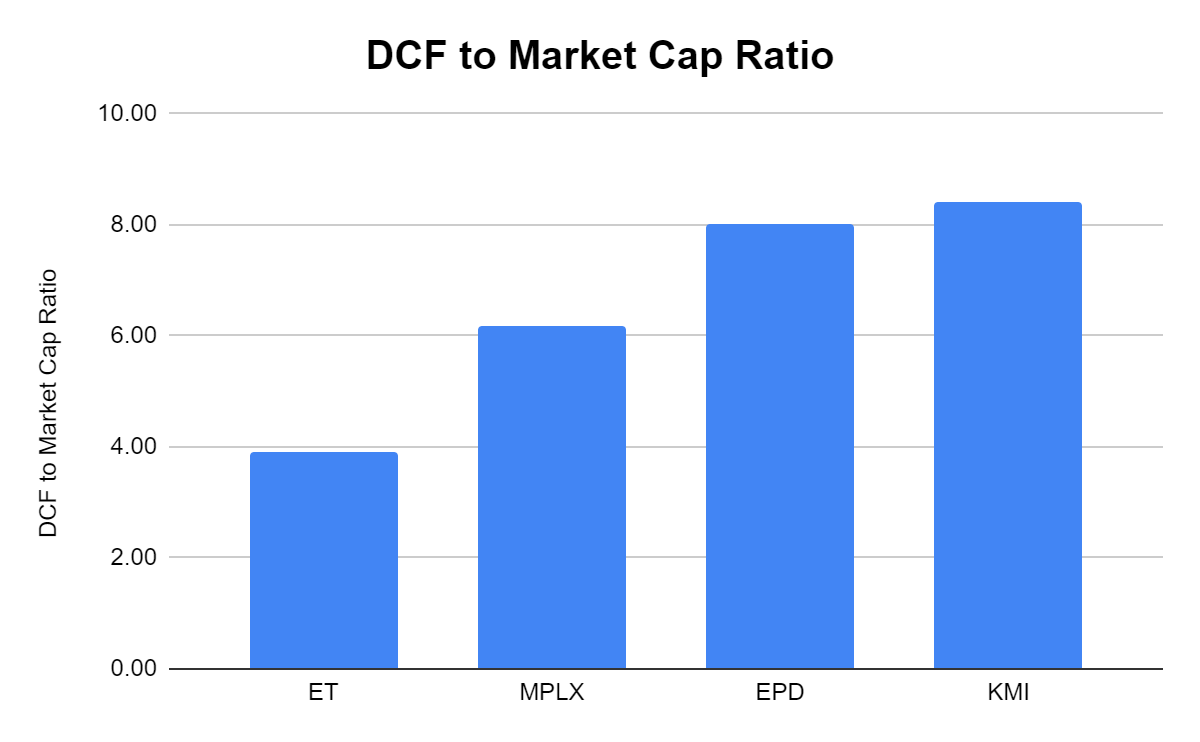
The surprising thing is that I would expect ET’s Debt to Adjusted EBITDA multiple to be off the charts since they have such a low multiple for their DCF to market cap and Adjusted EBITDA to market cap. This is an important metric to look at because the debt to Adjusted EBITDA metric indicates if a company is generating enough earnings to service its debt load and ensure its debt level isn’t detrimental. ET has been criticized for its debt load in the past, but I am not seeing a problem based on this metric. ET has $49.64 billion in total debt, but it has a 4.37x debt to Adjusted EBITDA multiple. This means that if every penny of Adjusted EBITDA was allocated to reducing debt, it would be eliminated in 4.37 years. MPLX has a 3.67x multiple, which is the lowest of the group, but KMI has a 4.53x multiple while EPD has a 4.87x multiple. This indicates that based on the amount of Adjusted EBITDA ET generates that its debt level isn’t egregious.
Steven Fiorillo, Seeking Alpha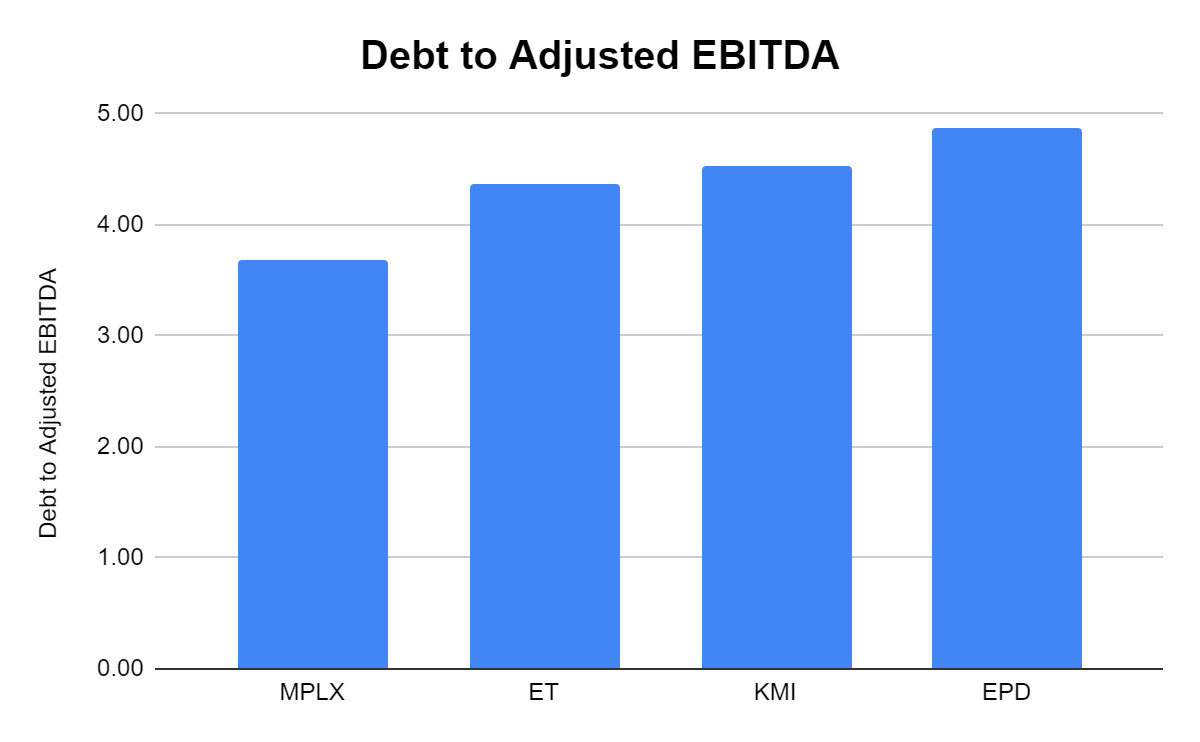
Price to Sales (P/S) normally isn’t looked at in the MLP space, but it may be the clearest metric in regards to how the market looks at ET. The market has paced a 1.2x multiple on EPD’s revenue, 2.45x multiple on KMI’s revenue, and a 3.02x multiple on MPLX’s revenue. ET trades at 0.44x its revenue. The market isn’t even valuing ET at 50% of its revenue. I view this as a clear indication that ET is being undervalued.
Steven Fiorillo, Seeking Alpha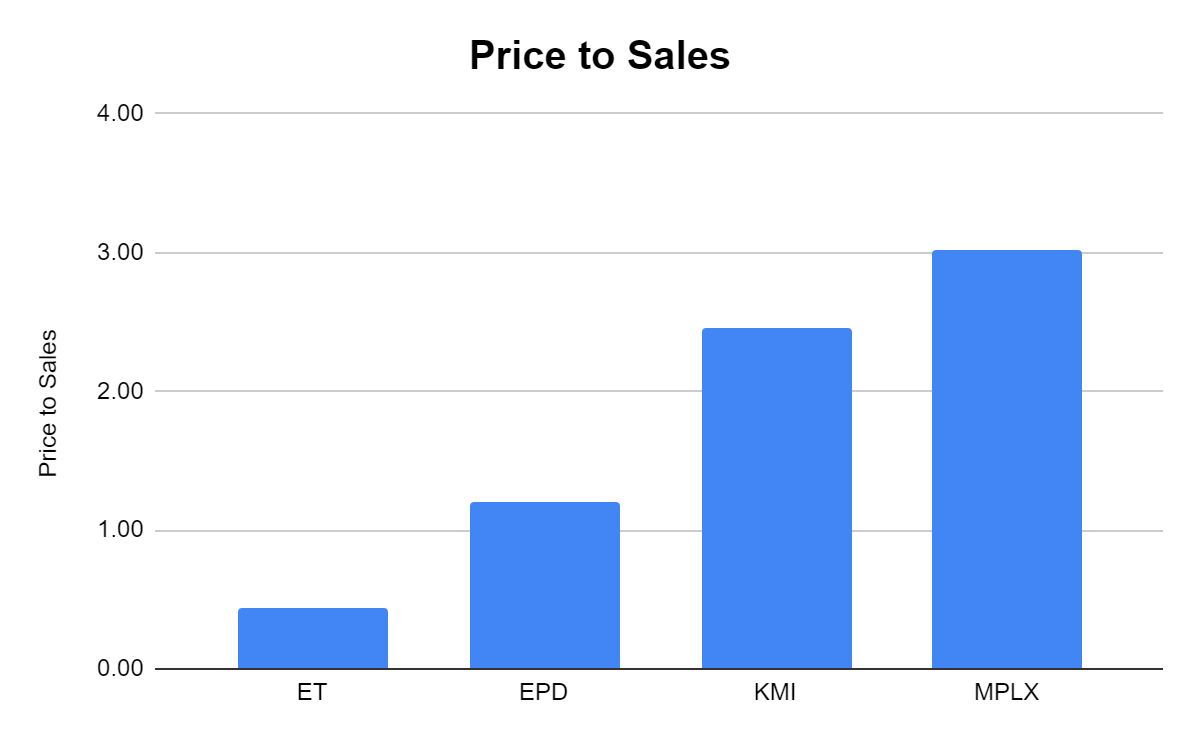
The market isn’t reasonable, and sometimes companies are misvalued for years. I don’t believe ET is doing a good job at telling its story because there is clearly still a dark cloud hanging over them. Based on the numbers, a realistic argument could be made that ET is discounted by at least 100%. MLPs are traditionally income plays, so I will start my reasoning with its DCF. Yes, you want to pay the cheapest valuation for a company’s DCF that you can, but that doesn’t mean its current DCF multiple is correct. If ET’s market cap was to double, its DCF to market cap ratio would increase from 3.92x to 7.83x, still making it cheaper than EPD and KMI based on this metric. EPD, KMI, and MPLX are all at least valued on a 1:1 ratio from the revenue they generate, and in MPLX’s case, they trade at 3.02x revenue. In a scenario where ET’s market cap doubled, it would still be valued at less than a 1:1 ratio based on revenue generated. ET generated the most revenue, Adjusted EBITDA, and DCF in its peer group while having heavily discounted valuations based on Adjusted EBITDA to Market Cap, DCF to Market Cap, and P/S multiples. I think units of ET should trade at a minimum of $20 per unit based on how its peers are valued and the amount of revenue, DCF, and Adjusted EBITDA ET generates.
Steven Fiorillo, Seeking Alpha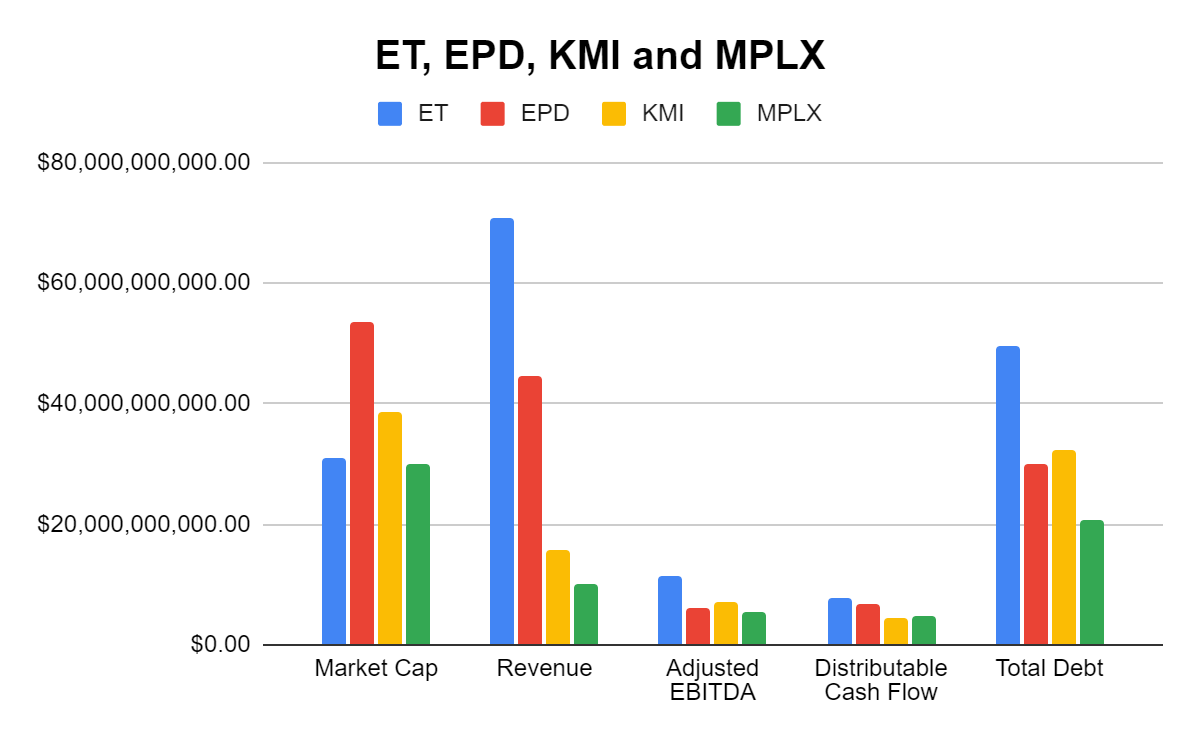
The 2021 energy statistics are in and they are bullish for Energy Transfer
All the hype around renewables has been just that, hype. BP plc just released its 2022 Statistical Review of World Energy 71st edition and should serve as a complete eye-opener for anyone who believes an energy transition to renewables is occurring. In 2021, renewables made up roughly 20 exajoules of the world’s energy consumption from roughly 590 exajoules which is 3.39%. I am pro-renewables, but I am also realistic, and they are not yet making a dent in global energy consumption. The projections are that renewables will experience the most growth over the next several decades but will not come close to displacing oil & gas.
BP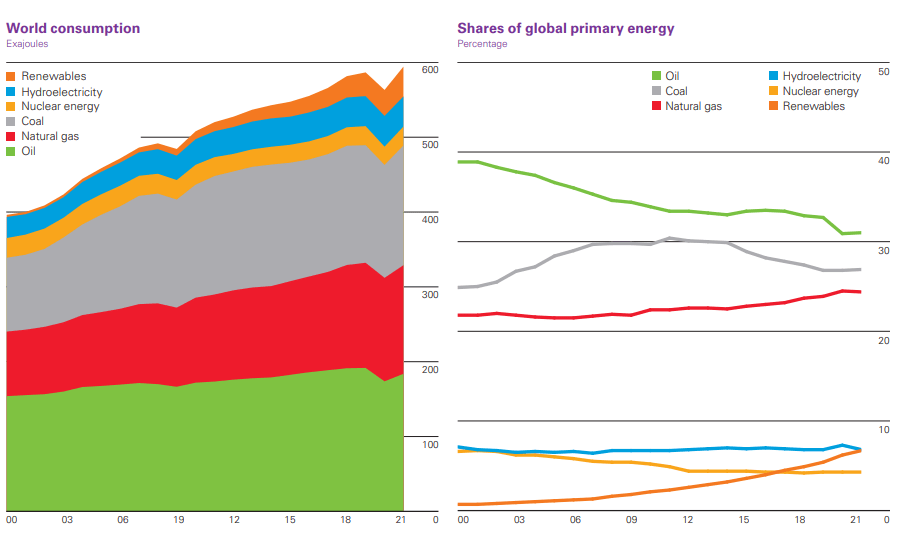
ET is one of the largest and most diversified energy infrastructure companies in North America, with 120,000 miles of pipeline. ET, to my knowledge, has the largest pipeline infrastructure within the U.S, and it connects most of the major basins to critical refining, terminaling, and exporting infrastructure. In the natural gas segment, ET provides natural gas gathering, compression, treating, transportation, storage, and marketing services for natural gas, using about 89,800 miles of pipeline, 235 Bcf of working storage capacity, and more than 75 natural gas processing and treating facilities.
In 2021 there were 4036.9 billion cubic meters of natural gas produced, which was a 4.8% YoY increase. Since 2011 there has been a 2.2% YoY growth rate. The United States accounted for 23.1% of the natural gas produced as 934.2 billion cubic meters were produced. Looking at consumption, the global economy consumed 4,037.5 billion cubic meters of natural gas, creating a slight deficit of 0.6 billion cubic meters. The YoY growth rate in consumption of natural gas was 5.3%. The United States consumed 826.7 billion cubic meters of natural gas in 2021, leaving a surplus of 107.5 billion cubic feet to be exported or stored.
BP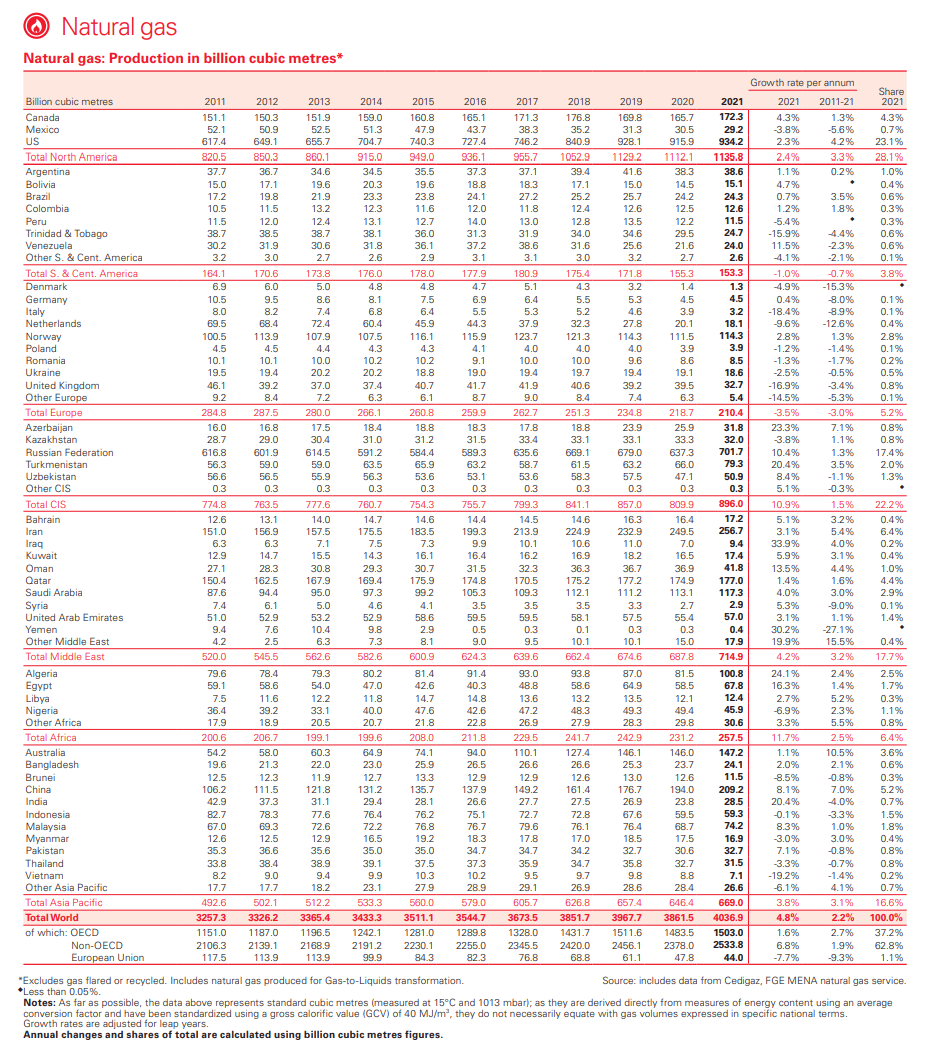
The EIA released its international energy outlook on 10/6/21. In their baseline case, the global energy demand would increase by 50%, growing from 600 quadrillion BTUs in 2020 to 900 quadrillion BTUs in 2050. U.S. exports of liquefied natural gas (LNG) set a new record high in 2021, averaging 9.7 billion cubic feet per day (Bcf/d)-an increase of 3.2 Bcf/d (50%) compared with the 2020 annual average, according to our recently published Natural Gas Monthly. The increase in U.S. LNG exports was driven by increased demand in both Europe and Asia (particularly China), as well as by expanding U.S. liquefaction capacity. U.S. LNG exports to Asia increased by 1.5 Bcf/d (51%) compared with 2020 and accounted for the largest share of all U.S. LNG exports at 47% (4.6 Bcf/d). The United States became the third-largest LNG supplier to Asia, accounting for 12% of total LNG imports into Asia, after Australia and Qatar, which supplied 10.3 Bcf/d (29%) and 7.4 Bcf/d (21%).
EIA
The EIA released its international energy outlook on 10/6/21. In their baseline case, the global energy demand would increase by 50%, growing from 600 quadrillion BTUs in 2020 to 900 quadrillion BTUs in 2050. In a low economic growth environment, there would be a 25% increase to 750 quadrillion BTUs, and in a high economic growth rate scenario, the global energy demand would increase to 1,100 quadrillion BTUs (83.33%). The EIA is also projecting that liquid fuels will remain the largest source of primary energy by 2050. Renewables will experience the most growth and increase their share of primary energy consumption by source, but petroleum and other liquids and natural gas.
EIA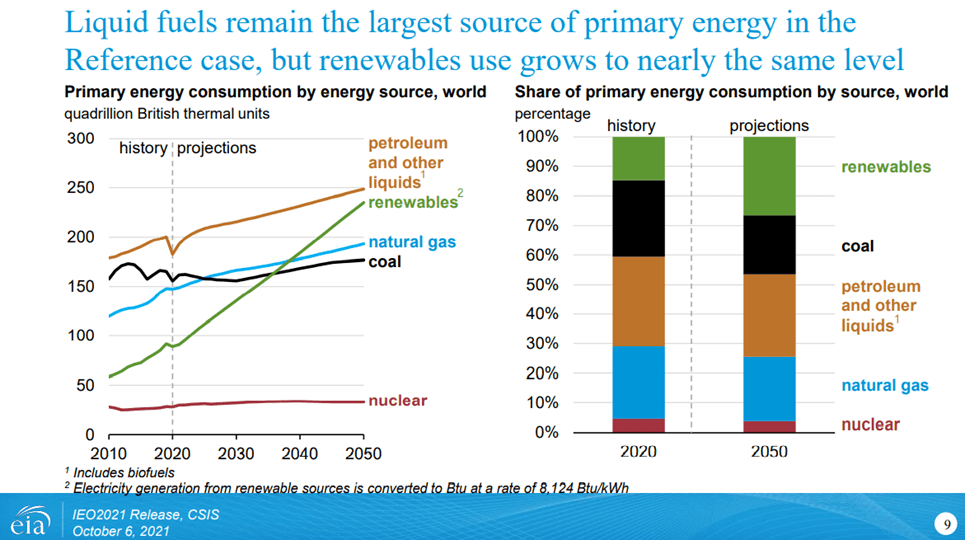
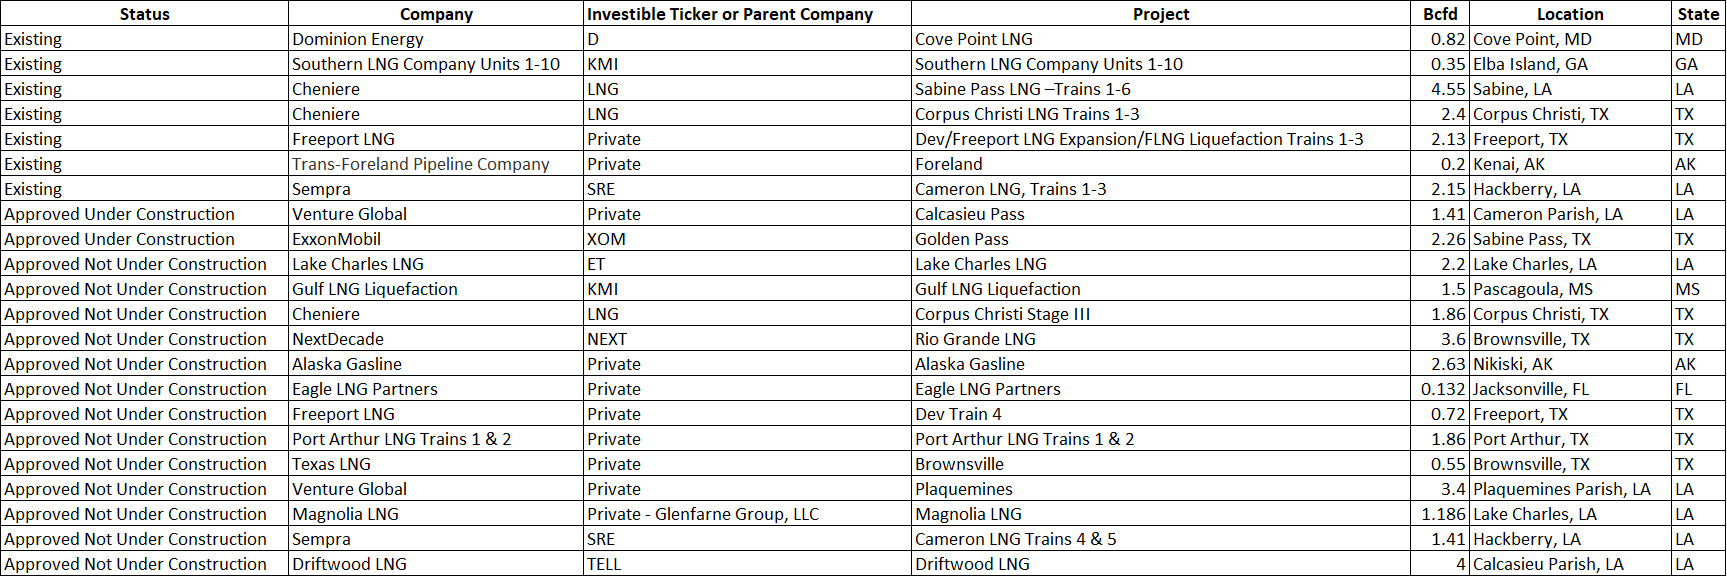
The global setup is bullish for ET. I went through the data from FERC and identified every investible company for LNG export facilities. In my table below, I have existing facilities, approved facilities that are under construction, and approved facilities where construction hasn’t started. I identified the parent company of each facility, listed the investible ticker symbol or if the company is private, and listed some other critical information.
FERC Steven Fiorillo, FERC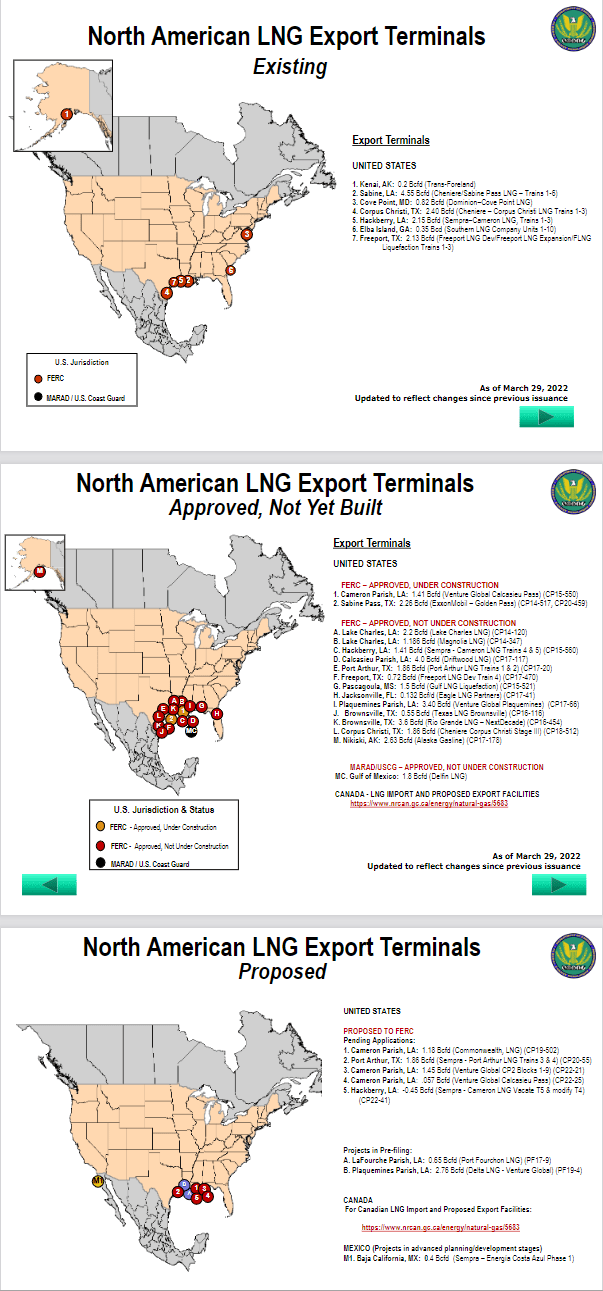
Based on LNG export capacity, the following companies will become the LNG exporting champions:
- Cheniere (LNG)
- Tellurian (TELL)
- NextDecade (NEXT)
- Sempra (SRE)
- Exxon Mobil (XOM)
- Energy Transfer (ET)
- Kinder Morgan (KMI)
Steven Fiorillo, FERC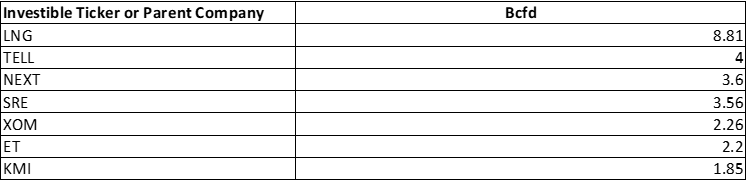
I have often said that I believe exporting will be a critical growth component for energy infrastructure companies. The United States is the largest oil & gas producing nation in the world and as energy consumption increases, so will production, and ET will benefit from increased transportation activity. ET will have the sixth largest exporting capacity out of the Lake Charles facility from the publicly traded companies that have approved LNG export facilities. In addition to future LNG exports, ET has three current export facilities generating currently operational. The Houston Terminal has 500,000 bbls/d of crude export capacity, Nederland has 600,000 of crude and 700,000 bbls/d of LPG, ethane, and gasoline export capacity, while the Marcus Hook facility can export 400,000 bbls/d of LPG and ethane. As the global demand for energy grows, ET’s exporting facilities will become more critical to meeting the global demand for energy.
Energy Transfer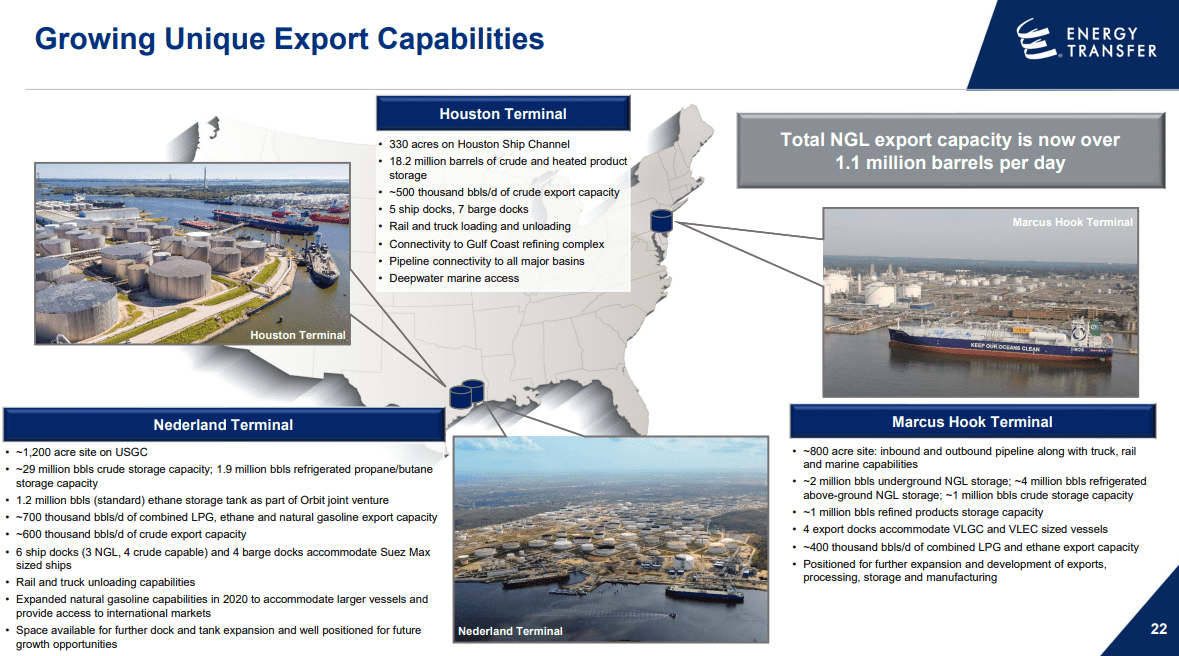
Energy Transfer is starting to grow its distribution again and its decreased unit price has pushed its yield past 8%
In 2020 ET reduced its annual distribution from $1.22 to $0.61 per unit to focus on its financial health. Management has provided investors with 2 consecutive increases, and the annual distribution is now $0.80 per unit. Over six months, ET has provided a 33.33% increase to its quarterly distribution. Management reassured investors that future increases to the distribution level would continue to be evaluated quarterly with the ultimate goal of returning distributions to the previous level.
ET is generating more than enough DCF to continue its incremental distribution increases. I believe ET is positioned to continue its growth as the production and consumption of fossil fuels increase. In the TTM, ET has paid $1.82 billion in common distributions and $2.1 billion in total distributions when preferreds are factored in. ET currently has a payout ratio of 26.57% of its DCF in the TTM. I think that we will see ET increase its distribution and bring it past the $1 range before over the next several quarters.
Seeking Alpha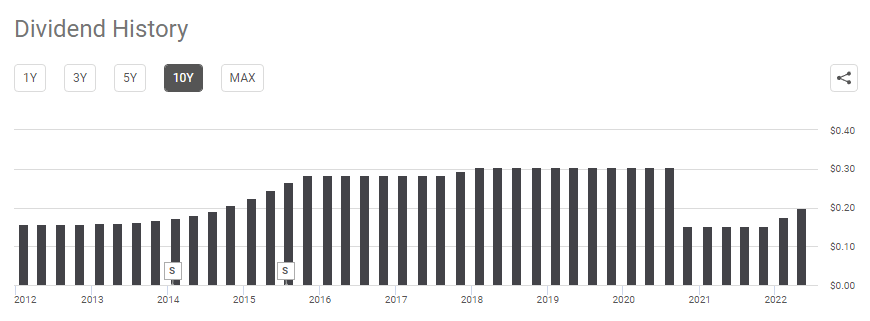
Conclusion
The bottom line is that I believe units of ET are mispriced, and their fair value is around $20. I have been wrong, but the math indicates that its multiples are too low based on its peers. Today ET is trading at an attractive valuation, and it’s not realistic for units to continue falling into the single digits. I think ET is a bargain, and there is an 8% distribution to go along with it. The energy landscape sets up well for ET, and as the next several year’s progress, ET should benefit from the global energy consumption expansion.
Be the first to comment