

NeonShot/iStock via Getty Images
Over the last year, I have argued that there are a series of interrelated dynamics pulling at markets, and identifying them ‘correctly’ depends largely on how you slice the markets up and then how you put the pieces back together. First is a long-term secular rotation towards energy and cyclicals (i.e., industrials and basic materials) and away from tech. I wrote about this last October in A Primer On Long-Term Sector Rotations And Where We Are Now. Overhanging this secular rotation is the unsustainable levels of both stock valuations and earnings growth. Historically, when both long-term earnings growth and valuations have been high, this has been followed by secular bear markets of either the deflationary (a long-term earnings contraction) or inflationary (a long-term valuation contraction) variety. In fact, every secular bear market over the last century in the US was preceded by such imbalances (and a sectoral imbalance in tech and energy). I updated this view most recently in the article SPY: Long-Term Outlook Remains Unchanged. And, another level above this are the undulations and interactions of technology, global political order, inflation, and yields, which I covered in Conjunction & Disruption: Technology, War, And Asset Prices. Although these interactions are too complicated to describe or summarize adequately here, this analysis suggests that, for now, we remain in a low-yield, low-inflation, tech-saturated period of relative (but waning) global stability. If we drop down to the cyclical level of analysis, there is the surge in commodity prices and earnings of the last two years. The magnitude, style, and timing of this ‘upside’ shock has been suggesting a subsequent ‘downside’ growth/inflation shock. This view appears to be confirmed by the recent behavior of agricultural commodities and, more critically, industrial metals.
It is in this context that I will frame my outlook for the large-cap Consumer Staples ETF (NYSEARCA:XLP). Basically, this view comes down to the following points:
- In terms of timing, either over cyclical or ‘secular’ timeframes, the staples sector trades with the broader market. It would be unusual for the sector to break free of the pack.
- The staples sector is trading at a high multiple relative to historical dividends (for which there is ample historical data) and, likely, earnings (for which there is less). This analysis is complicated by the shift away from dividends and, especially over the last forty years, towards buybacks (in which companies pay cash for the promise of possible future dividends), which will depress dividend yields. Below, I will try to make adjustments for some of that, but ultimately, a comparison of current XLP PE ratios and those for the S&P 500 suggest unsustainable levels.
- In a tech-driven bear market, staples have a consistent history of outperforming that sector. This suggests that, depending on one’s desired mix of risk and volatility, an overweight position in staples might be warranted. That is, staples might be a good hedge against a long-term bearish outlook. Their relative lack of volatility might appeal to those who hesitate to use energy and similar cyclicals as a hedge.
Let me be clear about this third point, since these kinds of arguments can be easily misunderstood. For example, when I wrote last year that energy would likely outperform the tech sector over the long term (in the “Primer” article linked above) but that the energy sector would likely also be in a long-term bear market, some readers seem to have only seen the word “outperform”. One of the reasons I wrote a bearish article on the energy sector, Why I Am A Reluctant Bear On The Energy Sector, was to reemphasize this overall bearish outlook. Nonetheless, in the comment sections of subsequent articles, when I have argued that small-cap energy will likely outperform over the long term, some have linked back to the title of that article as some sort of “gotcha”, that is, as if I had secretly changed my position.
So, to be as clear as possible, I expect that the staples sector will experience depressed long-term returns, that it will also decline substantially over the next two years and will likely underperform Treasuries over that period. It will likely outperform tech stocks over the long term, and although it may not outperform the energy, industrials, and basic materials sectors, it will likely provide less volatility. On balance, I regard this as a ‘sell’, but XLP and some of its constituents may have a role to play in certain portfolios, for example, as a way of reducing exposure in a portfolio too heavily oriented towards tech or, on the opposite end of the spectrum, as a way of hedging against the extremely negative outlook outlined in my articles. Ultimately, I can only give my view on what outcomes seem likely and then make certain suggestions as to how readers might incorporate these views into their own portfolios. Fortunately, God, in His infinite wisdom, has only seen fit to give me power to destroy my own trading account and not anybody else’s.
Now that we have said grace, let’s begin with the meal.
The Construction of the XLP
I am going to briefly go through the construction of the XLP, and then look at the long-term historical performance of proxies of the sector and constituent industries. This ought to support the three points mentioned above, specifically the notions that the staples sector is likely to trade with the market as a whole, that staples collectively are probably ‘overvalued’ on a historical basis, and that they are likely to outperform most sectors but especially the tech sector.
After that, I am going to argue that on a relatively short-term basis, Clorox (CLX) is likely to outperform the XLP despite its very high PE level and that Molson Coors (TAP) also has long-term potential to outperform XLP in the event of a more serious meltdown but that that potential is not likely to be unlocked until after such a meltdown. In fact, I would not be surprised to see TAP underperform (relative to the XLP) in the immediate future as investors sought refuge in the high-quality stocks that currently rule the roost as a cyclical breakdown materializes. There are likely other stocks within the staples sector with similar profiles (both within the XLP and among the smaller-cap confederates) that also have potential to outperform, but since this article is intended to initiate coverage of the sector generally, a closer look will have to wait.
In the following table, I have listed all 33 of the XLP’s holdings, their respective weights, their respective GICS industrial classifications, and their Fama-French classifications. These indexes are arranged according to the relatively new-fangled GICS methodology, but the Fama-French data sets go back much further and will have to serve as proxies.
|
The Consumer Staples Select Sector SPDR® Fund holdings as of June 27, 2022 |
||||||
|
Name |
Ticker |
Weight % |
Cumulative weight |
GICS Industry |
Fama-French Sector/Industry |
|
|
Procter & Gamble Company |
15.3 |
15.3 |
1 |
Household Products |
Household |
|
|
Coca-Cola Company |
10.9 |
26.2 |
2 |
Beverages |
Nondurable |
|
|
PepsiCo Inc. |
10.2 |
36.4 |
3 |
Beverages |
Nondurable |
|
|
Costco Wholesale Corporation |
9.5 |
45.9 |
4 |
Food & Staples Retailing |
Shops |
|
|
Walmart Inc. |
4.5 |
50.4 |
5 |
Food & Staples Retailing |
Shops |
|
|
Philip Morris International Inc. |
4.4 |
54.8 |
6 |
Tobacco |
Nondurable |
|
|
Mondelez International Inc. Class A |
4.4 |
59.3 |
7 |
Food Products |
Nondurable |
|
|
Altria Group Inc |
4.0 |
63.3 |
8 |
Tobacco |
Nondurable |
|
|
Colgate-Palmolive Company |
3.4 |
66.7 |
9 |
Household Products |
Household |
|
|
Estee Lauder Companies Inc. Class A |
3.1 |
69.8 |
10 |
Personal Products |
Household |
|
|
Kimberly-Clark Corporation |
2.3 |
72.1 |
11 |
Household Products |
Manufacturing |
|
|
Sysco Corporation |
2.2 |
74.3 |
12 |
Food & Staples Retailing |
Shops |
|
|
Archer-Daniels-Midland Company |
2.2 |
76.5 |
13 |
Food Products |
Nondurable |
|
|
General Mills Inc. |
2.2 |
78.7 |
14 |
Food Products |
Nondurable |
|
|
Constellation Brands Inc. Class A |
2.1 |
80.8 |
15 |
Beverages |
Nondurable |
|
|
Monster Beverage Corporation |
1.8 |
82.6 |
16 |
Beverages |
Nondurable |
|
|
Hershey Company |
1.6 |
84.2 |
17 |
Food Products |
Nondurable |
|
|
Kroger Co. |
1.6 |
85.8 |
18 |
Food & Staples Retailing |
Shops |
|
|
Walgreens Boots Alliance Inc |
1.5 |
87.4 |
19 |
Food & Staples Retailing |
Shops |
|
|
Kraft Heinz Company |
1.4 |
88.8 |
20 |
Food Products |
Nondurable |
|
|
Keurig Dr Pepper Inc. |
1.4 |
90.1 |
21 |
Beverages |
Nondurable |
|
|
Tyson Foods Inc. Class A |
1.3 |
91.4 |
22 |
Food Products |
Nondurable |
|
|
Church & Dwight Co. Inc. |
1.1 |
92.6 |
23 |
Household Products |
Household |
|
|
McCormick & Company Incorporated |
1.1 |
93.7 |
24 |
Food Products |
Nondurable |
|
|
Kellogg Company |
0.9 |
94.6 |
25 |
Food Products |
Nondurable |
|
|
Clorox Company |
0.9 |
95.5 |
26 |
Household Products |
Household |
|
|
Conagra Brands Inc. |
0.8 |
96.3 |
27 |
Food Products |
Nondurable |
|
|
J.M. Smucker Company |
0.7 |
97.0 |
28 |
Food Products |
Nondurable |
|
|
Hormel Foods Corporation |
0.7 |
97.7 |
29 |
Food Products |
Nondurable |
|
|
Brown-Forman Corporation Class B |
0.7 |
98.4 |
30 |
Beverages |
Nondurable |
|
|
Lamb Weston Holdings Inc. |
0.5 |
98.9 |
31 |
Food Products |
Nondurable |
|
|
Molson Coors Beverage Company Class B |
0.5 |
99.5 |
32 |
Beverages |
Nondurable |
|
|
Campbell Soup Company |
0.5 |
99.9 |
33 |
Food Products |
Nondurable |
|
The following table, from S&P Global, shows how the sector is broken down by GICS classification. The table above identifies these companies by “Industry” rather than “Industry Group” or “Sub-industry”.
Chart A. The Consumer Staples is made up of six industries. (S&P Global)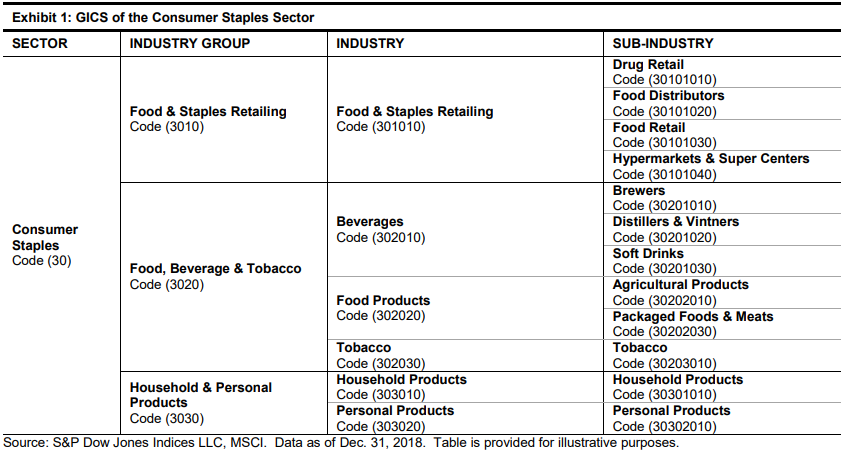
Over time, these industries and industry groups tend to constitute relatively stable proportions of the index, as the following chart illustrates.
Chart B. Industry and Industry Group Weights have tended to remain constant over last 20 years. (S&P Global)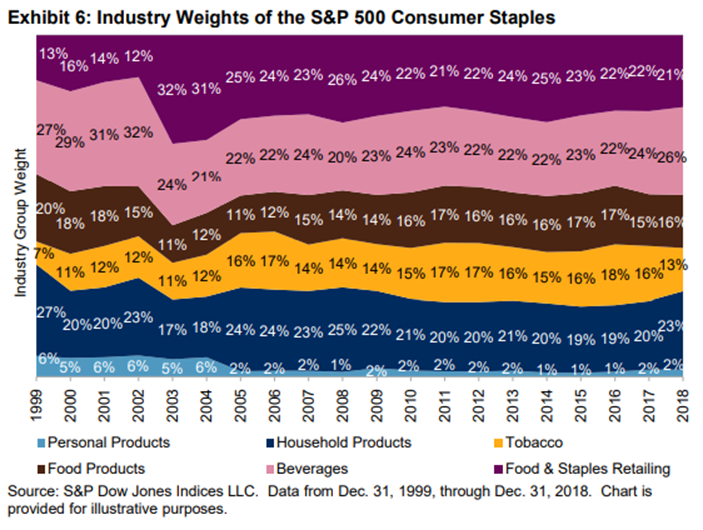
The following more up-to-date chart from State Street Global Advisors suggests the same, although Tobacco’s share has declined significantly, largely at the expense of Food Products and Personal Products.
Chart C. Apart from Tobacco’s smaller position, industry allocations remain stable. (State Street Global Advisors)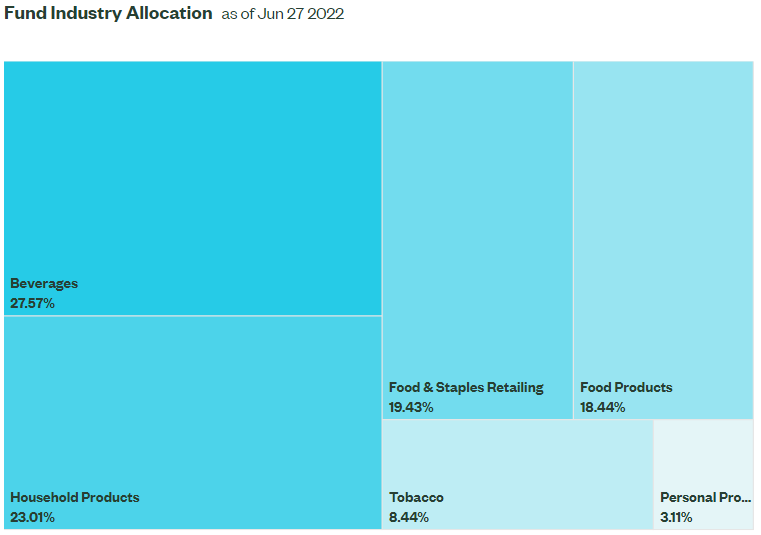
Food Products, Beverages, and Tobacco, which collectively make up about 54% of the XLP, are all classified as “Nondurables” in the Fama-French 12-industry dataset, as can be seen in the table of XLP holdings above. Household Products and Personal Products, which make up 24% of the index, are classified as “Household” in the Fama-French 49-industry dataset. Food & Staples Retailing, which make up 19% of the index, are equivalent to the “Shops” index in the Fama-French 12-industry dataset.
Unfortunately, this Shops index is composed of a large swathe of stocks that are classified as Consumer Discretionary (XLY) in the GICS system, most notably Amazon, whose market cap dwarfs that of both Costco and Walmart (which make up a good 75% of the staples retailers), but also Target, McDonald’s, Starbucks, and others (a list can be found in my XLY article from earlier this year). The cap-weighted Shops index, therefore, is not an entirely satisfactory proxy for these Consumer Staples retailers.
Using the Fama-French data alone, we can cover, therefore, at least 78% of the XLP and try to imagine how it might have performed over the last century under various conditions (secular booms and busts; cyclical booms and busts; and periods of high, moderate, and low inflation). For the remaining retailers, I will have to be more cautious. Ultimately, I am going to argue that it is unreasonable to expect that these retailers will deviate much from other staples industries, especially, considering that it makes up less than a quarter of the index, enough to significantly alter the outcome.
Since the Fama-French Nondurables sector overlaps with over half of the XLP’s holdings, this will form the core of the historical analysis, although if and when the other Fama-French categories substantially differ from this basic outlook, we will examine them more closely.
Ideally, even if readers disagree with my overall outlook and conclusions, some of this will inform whatever conclusions they arrive at about the sector.
The Fama-French Nondurables index
In the following chart, we can see the respective price performances of the S&P Composite (in orange), the value-weighted Nondurables index (in blue), and a historical commodity price index (in green) that I have pieced together using a variety of historical data.
Chart D. The Nondurables index has tended to track the S&P Composite over the last century. (Fama-French; Robert Shiller data; World Bank; St Louis Fed; Warren & Pearson )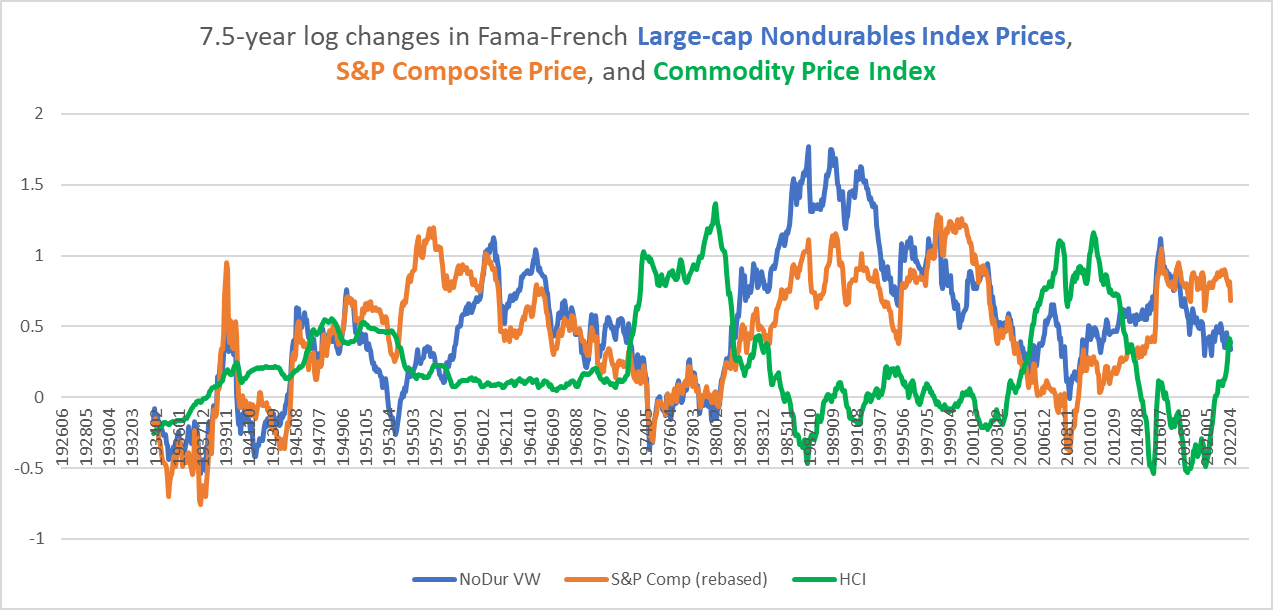
Nondurables have tended to move with the S&P Composite index over the long term. Periods in which Nondurables substantially underperformed the broader market (the early 1950s, late 1990s, and late 2010s) were typically periods of strong tech performance. Periods where Nondurables outperformed were typically periods of very weak tech performance, especially the 1980s and 2000s. The following chart shows 7.5-year log changes in a ratio of total returns in Nondurables to those of the S&P Composite index.
Chart E. Nondurables have typically underperformed the S&P Composite during tech booms. (Fama-French, Shiller)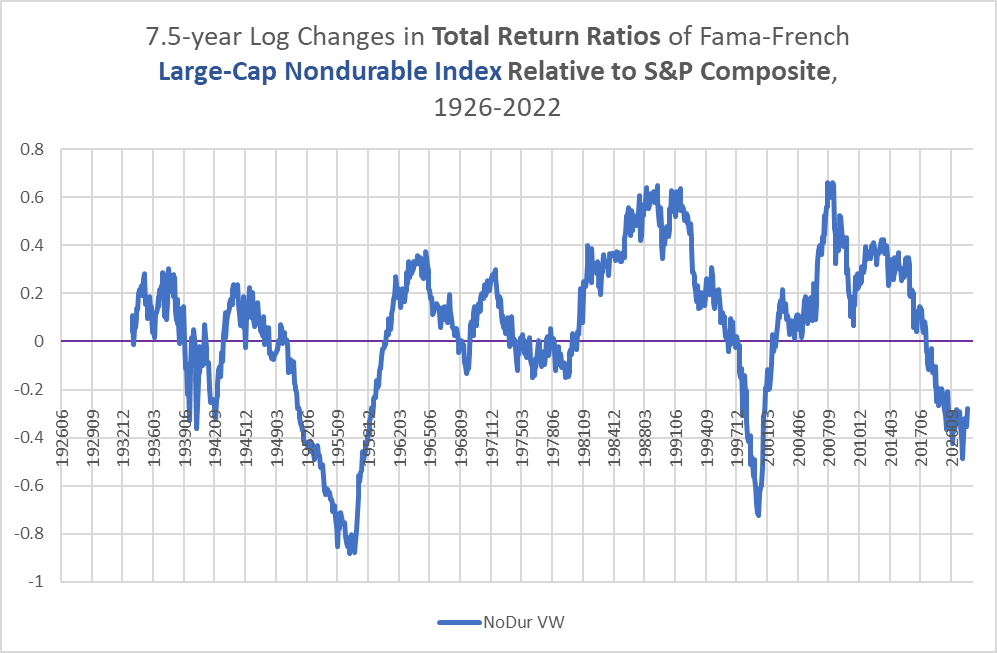
The chart suggests (to me at least) the potential for a long-term reversal in the strength of the Nondurables sector relative to the market as a whole. In the “Primer to Long-Term Sector Rotations” mentioned at the beginning of the article, the apparent catalyst for a rotation is a change in the long-term momentum of the energy space (both equities and commodities) and a shorter-term energy “shock”. As outlined in previous articles, both of these things have been underway for over a year. Unfortunately, both developments typically suggest lower returns over the long- and short-term, respectively.
Notice in Chart D that there is also a tendency for stocks (including Nondurables) to be inversely correlated with commodity inflation. The only occasion when this was not true was the Depression of the 1930s. Part of my overarching argument in the first paragraph is that the current boom in commodity inflation is, for lack of a better word, a “cyclical anomaly” rather than a “commodity supercycle”. That is, historical patterns and relationships suggest that we remain in a fundamentally low-inflation/low-yield world and that the cyclical shock is not only likely to recede, but it may trigger a cascade of deflationary pressures (essentially via a growth shock). Again, we only have one example of a secularly deflationary bear market in what is otherwise a sea of inflationary waves that shift from one sector and asset class to another, but my reading of history is that we currently come as close to checking off all of the boxes for a Depression-like outcome as can be imagined.
Over cyclical durations (defined here as log changes over 36-month moving averages), Nondurables have marched in near lockstep with the broader market. The only clear divergence was during the 1999-2002 period when Nondurables sold off ahead of the S&P 500, then rallied as the broader market crashed, and then reconverged with the market.
Chart F. Over cyclical durations, the relationship between Nondurable index and S&P Composite is even stronger. (Fama-French, Shiller)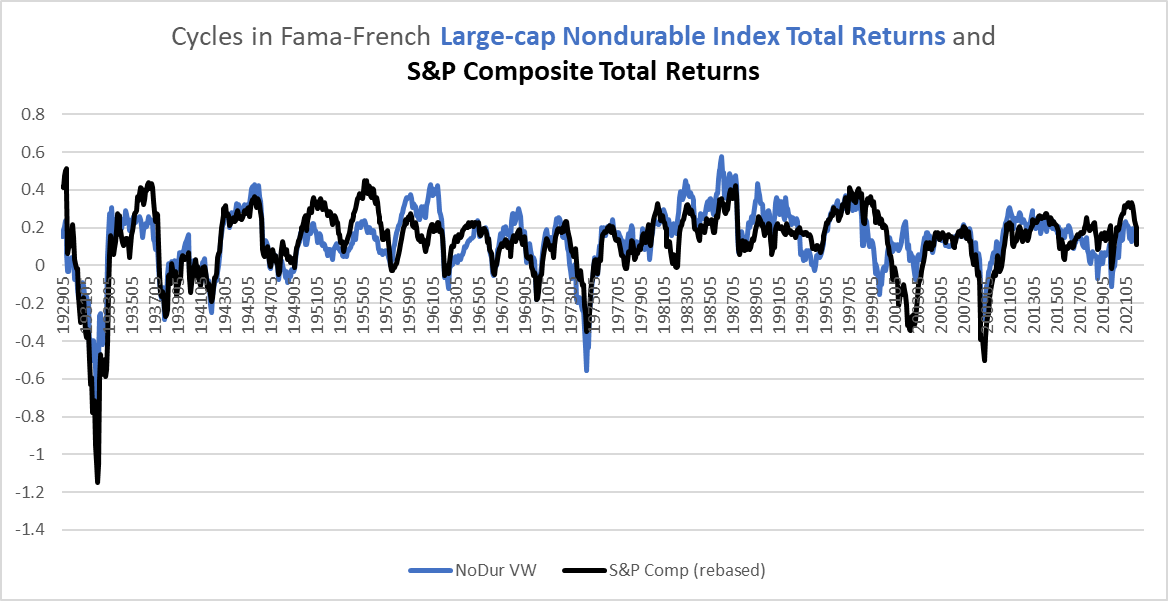
Generally, stocks move together, but especially over the long term there is a lot of relative divergence that can get lost in the minute-to-minute chaos of the market. The following chart shows the total return performance of the Nondurables sector (relative to an equal-weighted index of all Fama-French 12 Sectors) and the total return performance of the Business Equipment sector (relative to that same index) since the 1930s. For reference, the equal-weighted index would be something like the ALPS Equal Sector Weight ETF (EQL), and the Fama-French Business Equipment index is nearly identical to the XLK (see XLK: Apple And Microsoft Likely To Weigh The Index Down for an historical analysis of the tech sector).
Chart G. Nondurables and tech stocks are inversely correlated with one another on a relative basis. (Fama-French)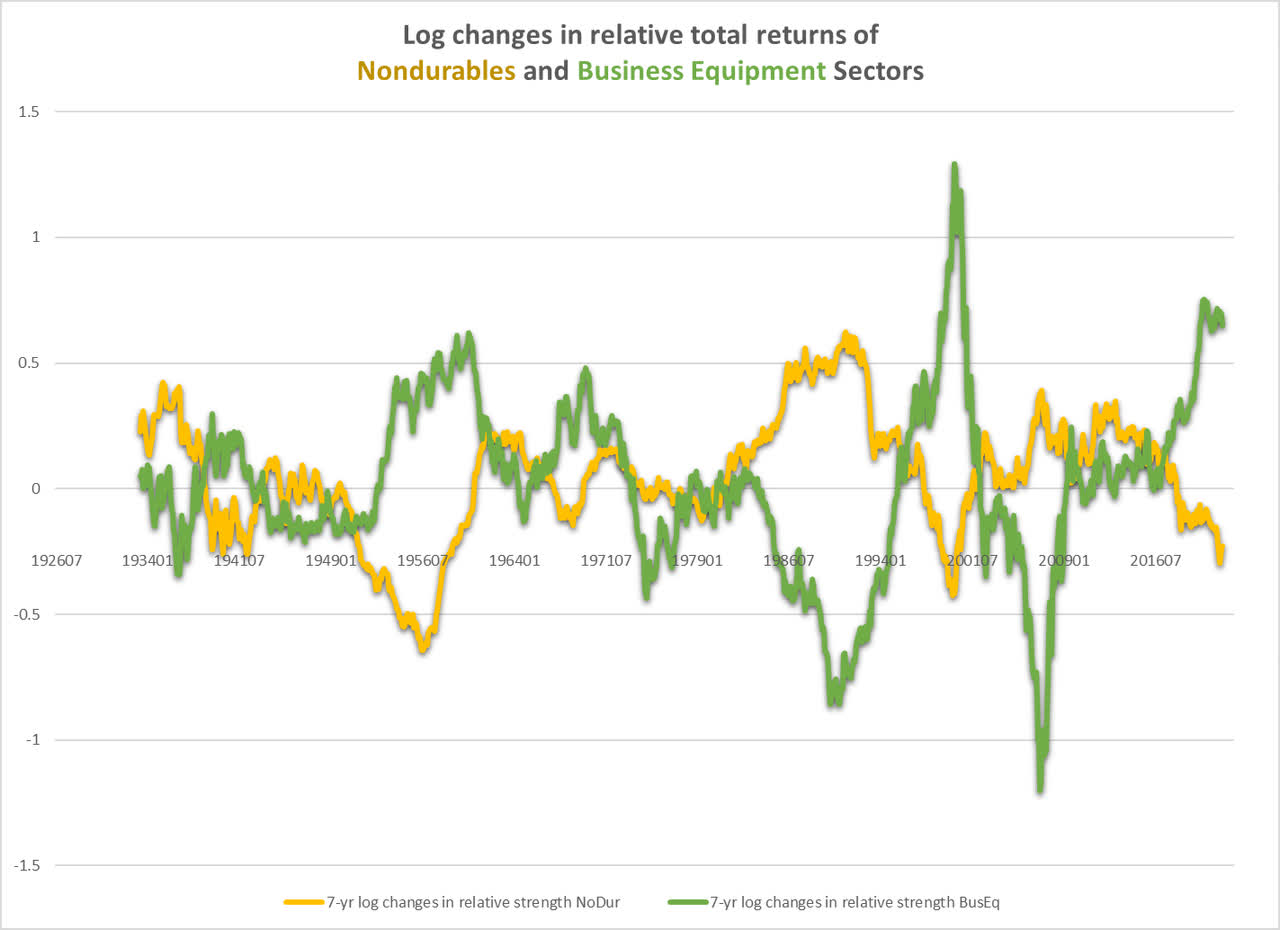
They are strongly negatively correlated with one another. In fact, this is the single strongest negative correlation that I could find in terms of relative performance and one of the strongest correlations (negative or positive) among the Fama-French sectors. A decline in tech stocks relative to all sectors has almost always been matched by a relative rise in Nondurables. Outperformance, of course, is not identical to “bullish”, however.
By contrasting the price returns with the total returns of the Nondurables index, we can estimate the historical dividend yield for the sector. The chart below shows the relationship between the historical implied dividend yield (in blue) and the subsequent price return (in orange).
Chart H. The dividend yield appears to anticipate subsequent returns. (Shiller)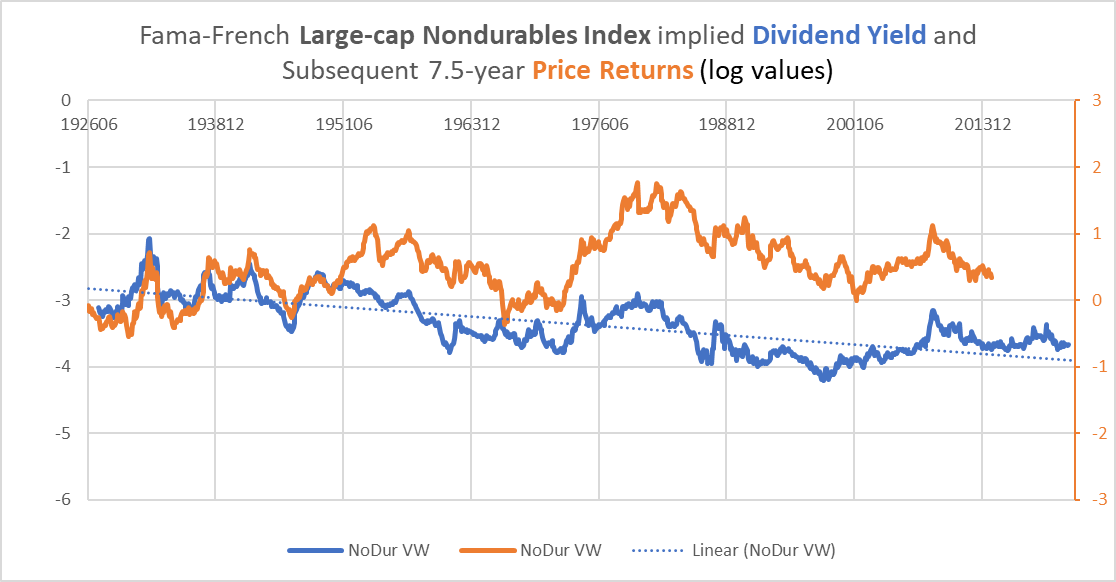
As mentioned earlier, markets have moved away from dividends over the last half-century, perhaps as early as the aftermath of World War II, and this accelerated, it seems, with the popularity of buybacks in more recent decades. My assumption is that the split between dividends and buybacks has found an equilibrium and that the dividend yield would be perhaps 1-2 times as high as it is today (currently around 2.5% for both Nondurables and the XLP) and thus closer to levels of the late 1920s or mid-1940s.
Deviations from a simple linear regression of the dividend yield have been fairly strongly correlated with subsequent total returns (0.53), but if an equilibrium between buybacks and dividend payouts has been found, then a linear regression would likely underestimate the level of the dividend yield’s equilibrium level. Thus, even though the dividend yield is above the value implied by a linear regression, this is likely to underestimate how ‘overvalued’ Nondurable stocks are.
Chart I. After accounting for buybacks, the Nondurables index and the S&P Composite’s dividend yields may be near par. (Fama-French, Shiller)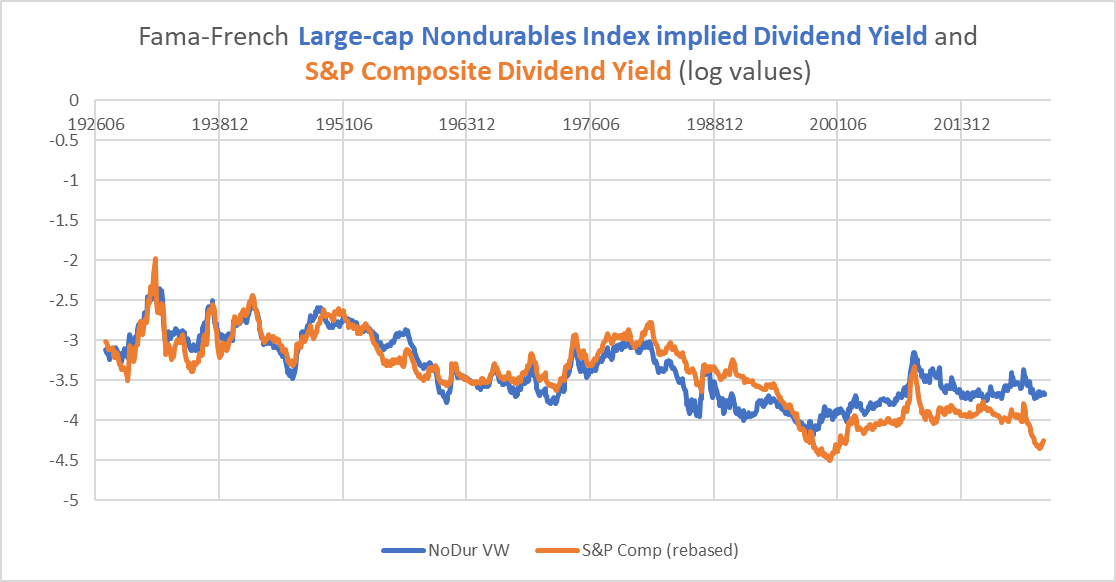
Yardeni Research regularly breaks down historical dividends and buybacks for each S&P 500 sector going back a decade or more. It seems to suggest that the ratio of dividends to buybacks in the Consumer Staples sector is currently something like 2:1 (whereas in the S&P 500 it is closer to 1:2), which would imply a relatively low adjusted dividend yield (and thus a higher price/dividend multiple) in Consumer Staples.
The impression of a high valuation relative to historical dividends seems to be backed up by the relationship between the PE ratios of the Consumer Staples Sector and S&P 500. The chart below, based on data from S&P Global, suggests that the two are roughly at par. To be clear, the point here is not the difference in the relative levels but the proximity.
Chart J. The Consumer Staples PE ratio is at par with the S&P 500’s. (S&P Global)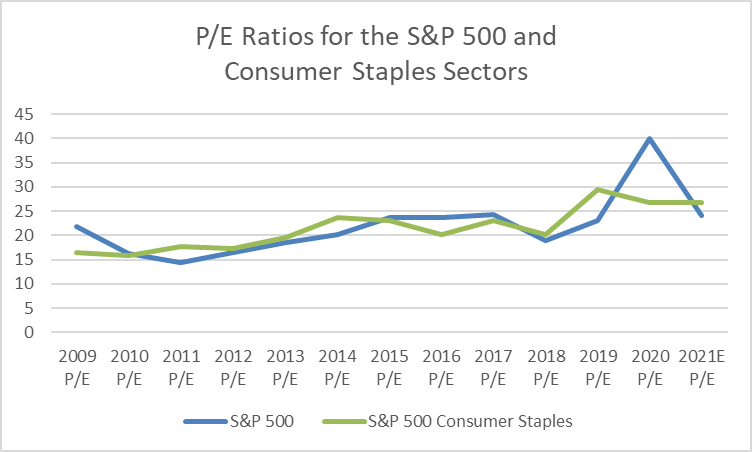
In sum, although valuations in Consumer Staples may not have been stretched quite as far as they were in the Information Tech, Consumer Discretionary, or Communications sectors, they have been stretched nonetheless, and historically in Nondurables, when price has become too far removed from earnings and dividends, long-term returns have been depressed. It is unlikely that they will be as depressed as might be expected in the high-flying sectors of the last decade, but they are likely to be depressed nonetheless.
But, will they beat bonds? In the chart below, I compare total returns in both the value-weighted and equal-weighted Nondurable indexes with Treasury returns since 1926.
Chart K. Large-cap Nondurables stocks have outperformed Treasuries except in ‘secular’ bear markets. (Fama-French)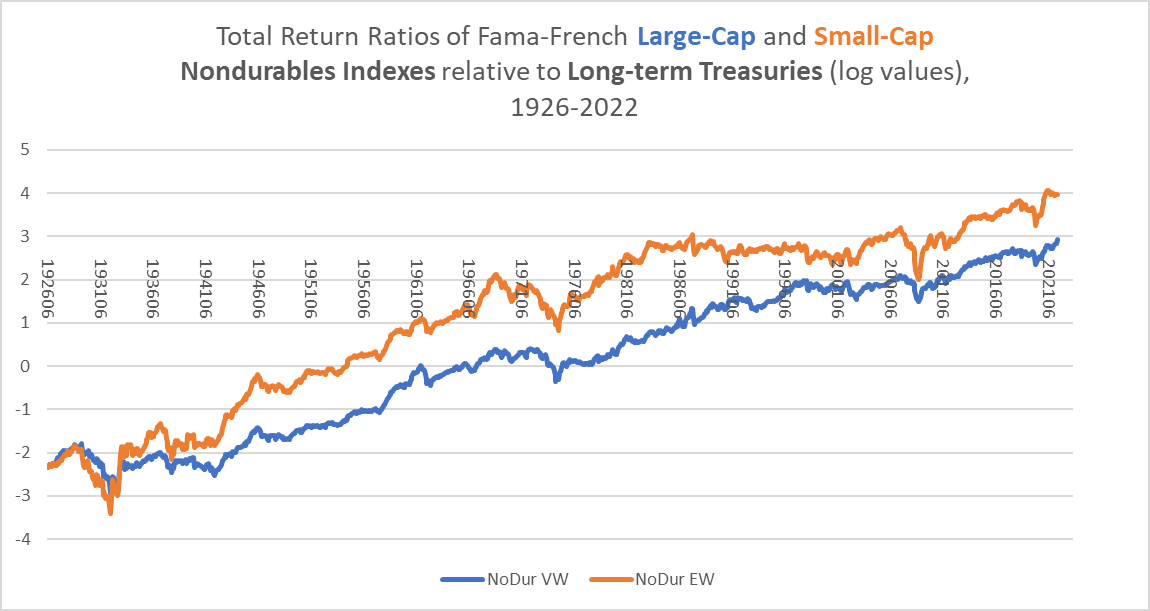
The chart suggests patterns similar to what we saw earlier in terms of absolute performance in Chart D. Large-cap Nondurables consistently outperform Treasuries for decades (1940s-1960s, 1980s-1990s and 2010s-present) and then struggle to keep up with them during bear markets (particularly in the 1930s, 1970s, and 2000s). Presumably, were Nondurables to indeed enter a “secular” bear market, they would also struggle to keep up with Treasuries. If it were a deflationary bear market, they might significantly underperform. Small-cap Nondurables, however, have shown a capacity to outperform bonds during bear markets. Thus, for example, the ratio of total returns in small-cap Nondurables to Treasury returns was higher in 1934 than it had been in the market peak of 1929 and would go higher still after that. As long as you could successfully track such an index and tolerate the downside pressure during the worst years of the selloff, you would be in the green again within a few years. If you could anticipate such a cyclical selloff, all the better.
Since cyclical selloffs seem to occur immediately after energy shocks, in the early stages of long-term sector rotations, and during “secular” bear markets, I believe these selloffs can be anticipated to some degree. That is a more general argument, however, which is addressed in the articles linked to in the first paragraph.
Let’s move on to the Fama-French Household and Shops indexes. The patterns are generally similar to those found in Nondurables, although the strength of the (negative) correlation with tech stocks might not be quite as strong.
The Fama-French Household index
First, the Household industry. A low dividend yield points to lower returns.
Chart L. The Household Products index’s dividend yield has generally anticipated long-term performance. (Fama-French)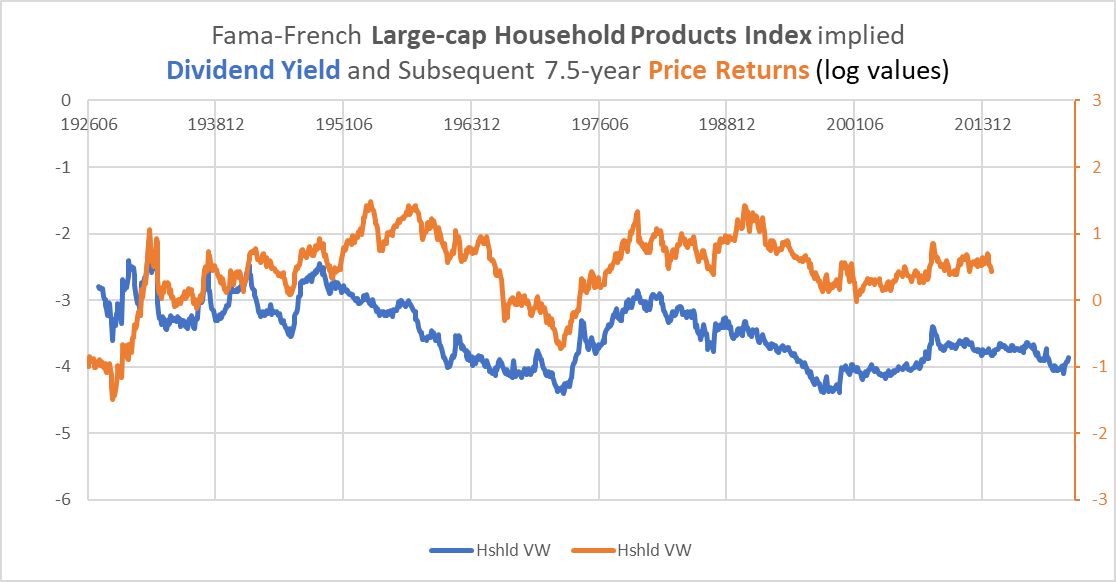
The following chart compares the price performances of the Household index, the S&P Composite and a commodity index.
Chart M. Household products stocks are more closely aligned with the S&P Composite than are Nondurables. (Fama-French; Shiller; World Bank; St Louis Fed; Warren & Pearson)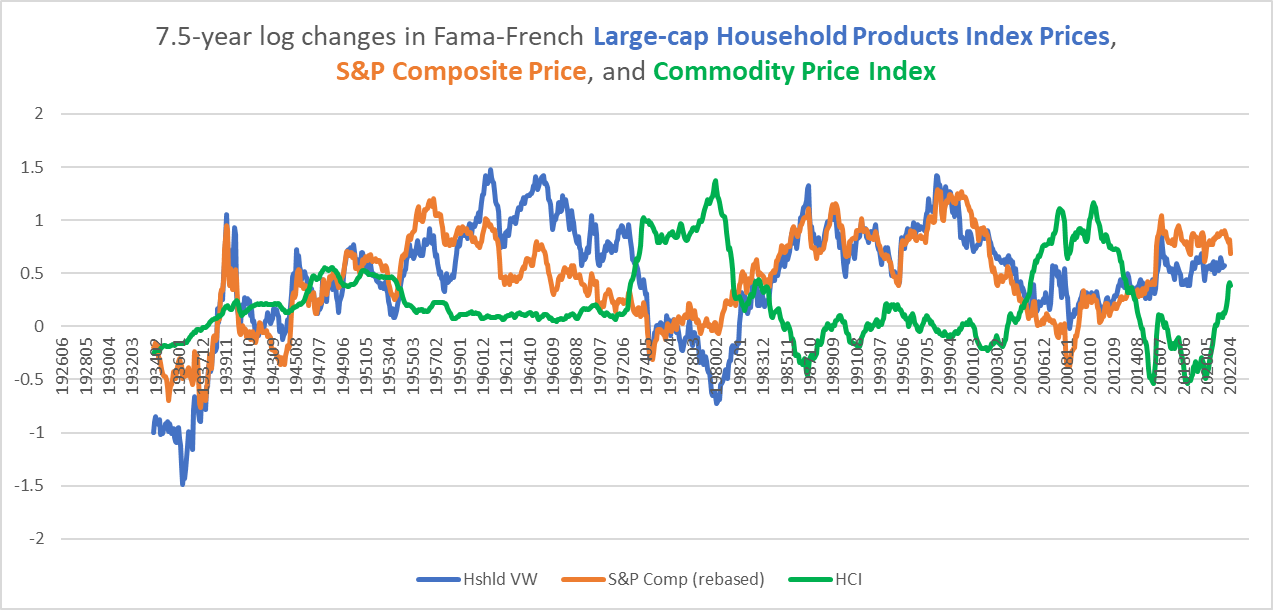
Household stocks are generally more aligned with the market as a whole. Curiously, they severely underperformed the broader market during the Depression.
Chart N. The Household product index has underperformed the broader market for the last decade. (Fama-French; Shiller)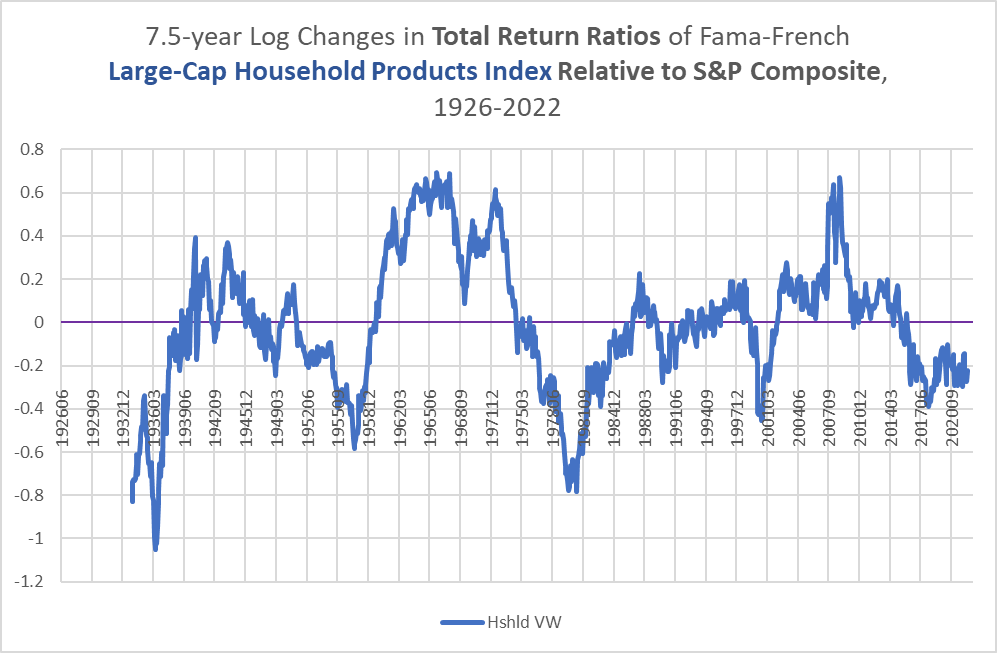
This underperformance occurred despite there being no appreciable difference in the levels of the dividend yield of Household stocks and the S&P Composite, as seen in the following chart.
Chart O. The dividend yield on Household Products trades at roughly the same level as that for the S&P Composite. (Fama-French; Shiller)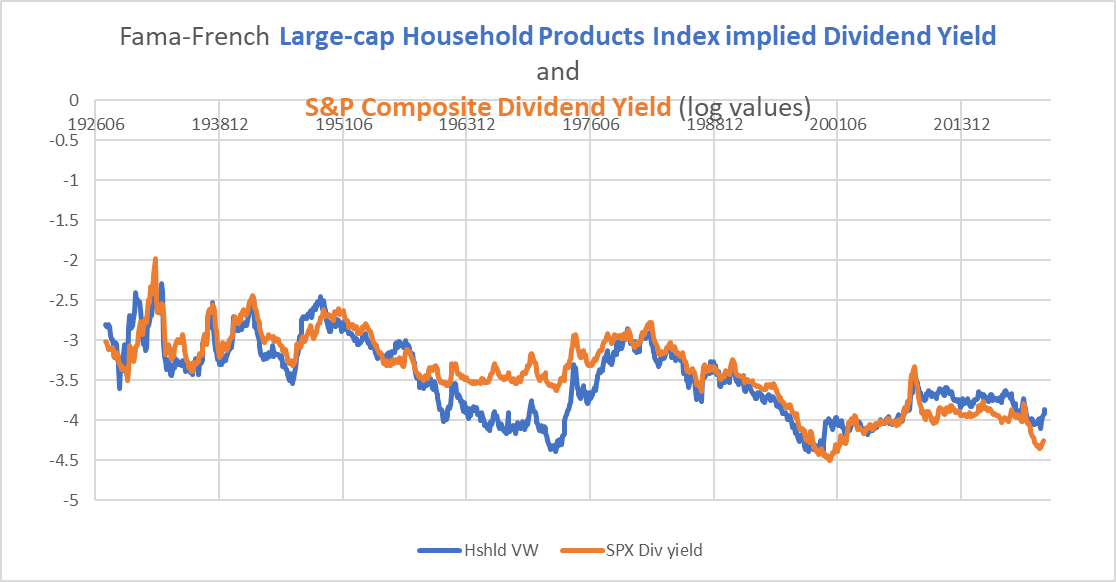
This seems to have been linked to an otherwise uncharacteristic collapse in dividends, as can be seen in the following chart.
Chart P. During the Depression, there was an especially unusual collapse in dividends. (Fama-French, Shiller)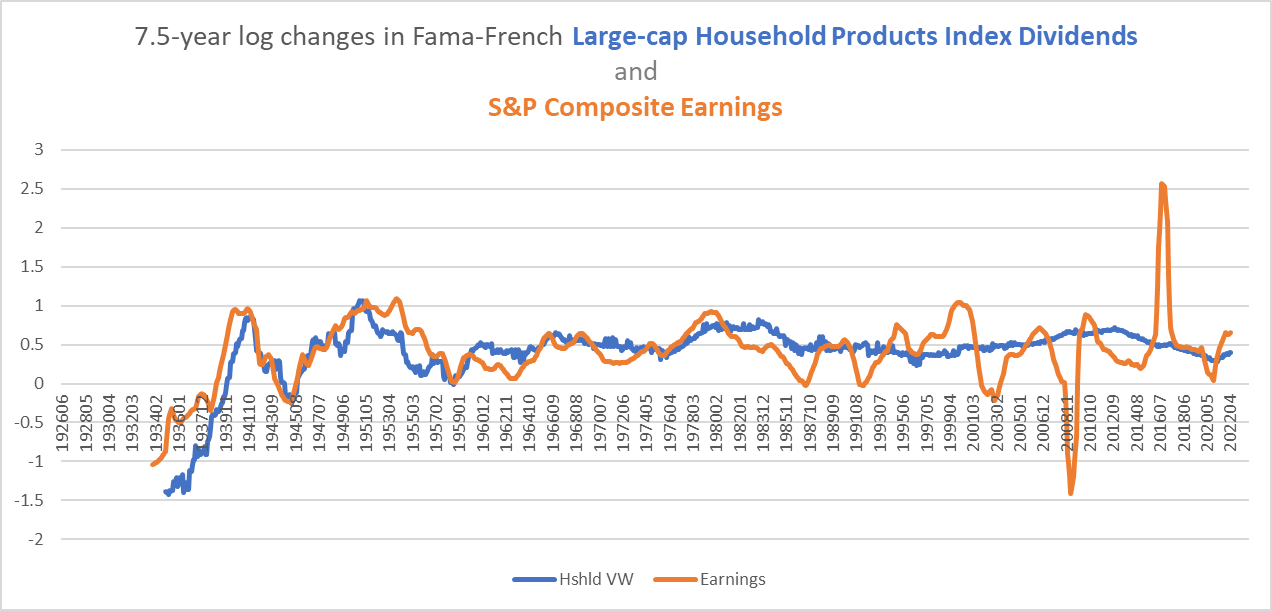
As long as the Household index’s dividends have grown faster than long-term commodity inflation, the price performance of those stocks has remained buoyant, as the following chart illustrates.
Chart Q. Household Products stocks have done well as long as dividend growth has remained higher than commodity inflation. (Fama-French; World Bank; St Louis Fed; Warren & Pearson)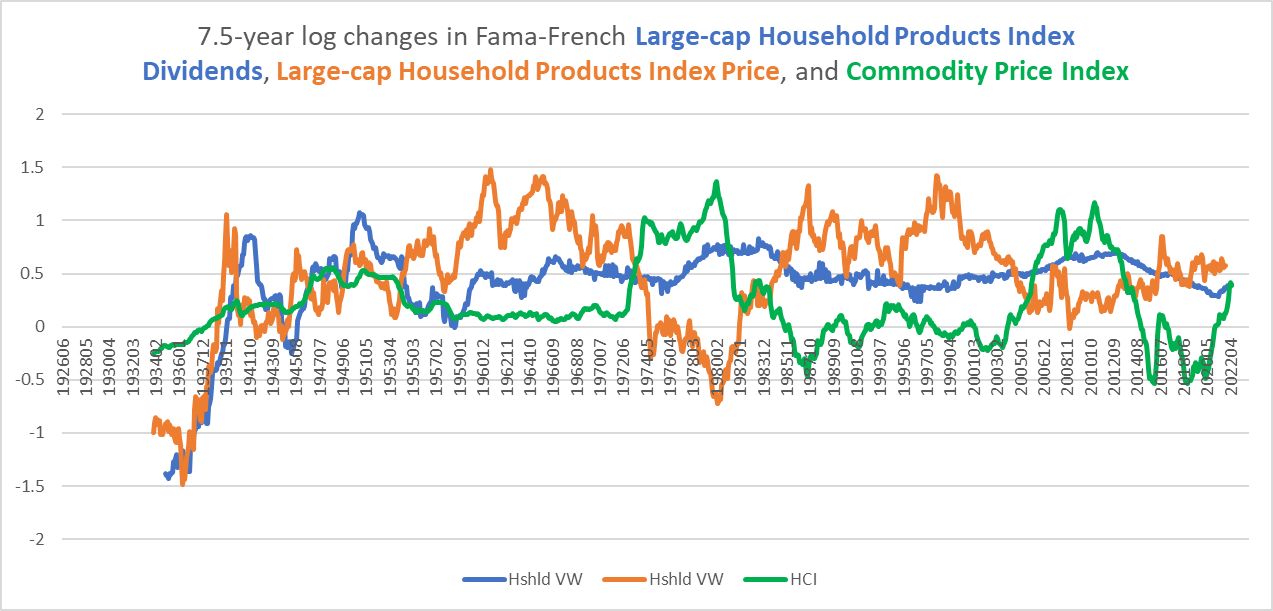
In order for the absolute totality of my outlook to prove right, therefore, we would have to see the first long-term decline in dividends in the Household index since World War II. Sixty percent of the Household index portion of XLP is made up by a single stock, Procter & Gamble, which has increased its dividend for 64 consecutive years. The deductive conclusion, therefore, would be that P&G has a substantial risk of a cut in its dividend sometime over the remainder of the decade, despite its dividend-paying bona fides. Again, for such an outcome to occur, every aspect of the outlook outlined in these articles would have to materialize.
Let’s move on to the retailers.
Consumer Staples retailers
Seven-year log changes in the Fama-French Shops index has a 0.90 correlation with the same rates of change in the Fama-French Nondurables index, the strongest correlation between any two of the Fama-French sectors in terms of absolute performance. It is therefore unlikely that the Shops index, even if it is primarily composed of stocks in the Discretionary sector, is likely to deviate too markedly from the behavior of Consumer Staples retailers over the long term.
The correlation in their respective relative performances against the S&P Composite is 0.70.
Chart R. The Shops index has a recognizable profile, but it has not underperformed during the late tech boom. (Fama-French; Shiller)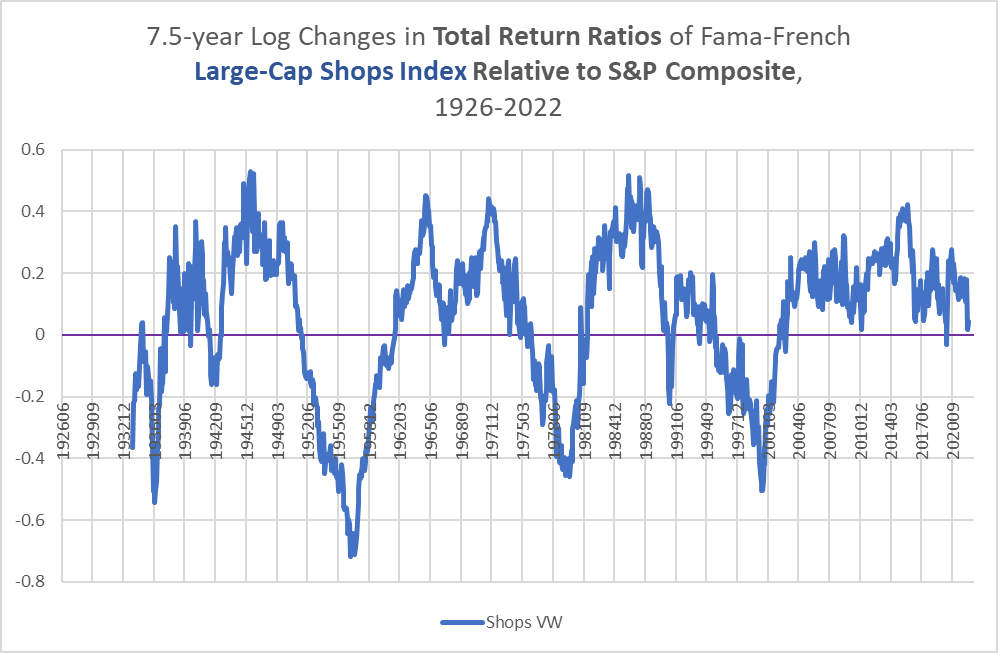
It is clear, however, that the Shops index has not suffered as much under the rule of the tech sector over the last decade as it did in the 1990s, for example. Much like the auto sector, the retail industry has been swept up in the tech boom. In the 1990s, boring telecoms were also swept up in the tech frenzy.
Based on a single chart, we cannot determine which portion of the Shops index ought to be attributed to retail stocks in the Consumer Staples index as opposed to retailers and restaurants in the Consumer Discretionary index.
Chart S. The Fama-French Nondurable and Shops Indexes have historically been closely intertwined. (Fama-French)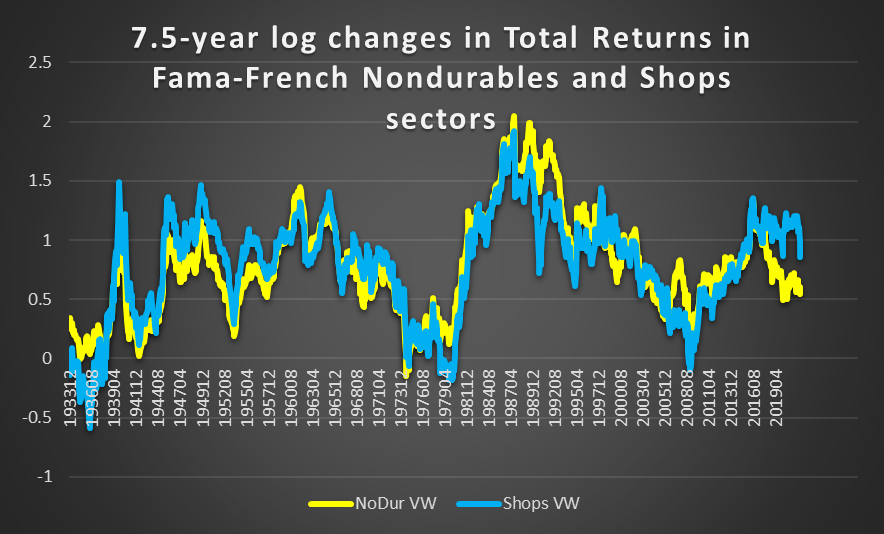
But, the likeliest explanation for the most recent deviation in Nondurables and Shops indexes is a ‘tech infection’ of the latter, and this seems to be primarily attributable to online retailers like Amazon, just as valuations of the auto sector as a whole were largely distorted by Tesla. If the Consumer Staples retailers have been bitten by this bug to some degree as well, then it is more likely that they are going to suffer from a reversal in the tech sector (relative to other Staples stocks). If they have been relatively immune, then the more they are likely to conform to the patterns laid out by the Nondurables sector.
The chart below from Seeking Alpha shows PE ratios for Costco and Walmart as well as two other members of the top five XLP holdings, P&G and Coca-Cola. Costco has indeed been priced a bit higher than the others, but I am not sure this is indicative of a strong influence of technophilia.
Chart T. There is not a great deal of evidence that staples retailers’ PEs have been strongly distorted by the tech boom. (Seeking Alpha)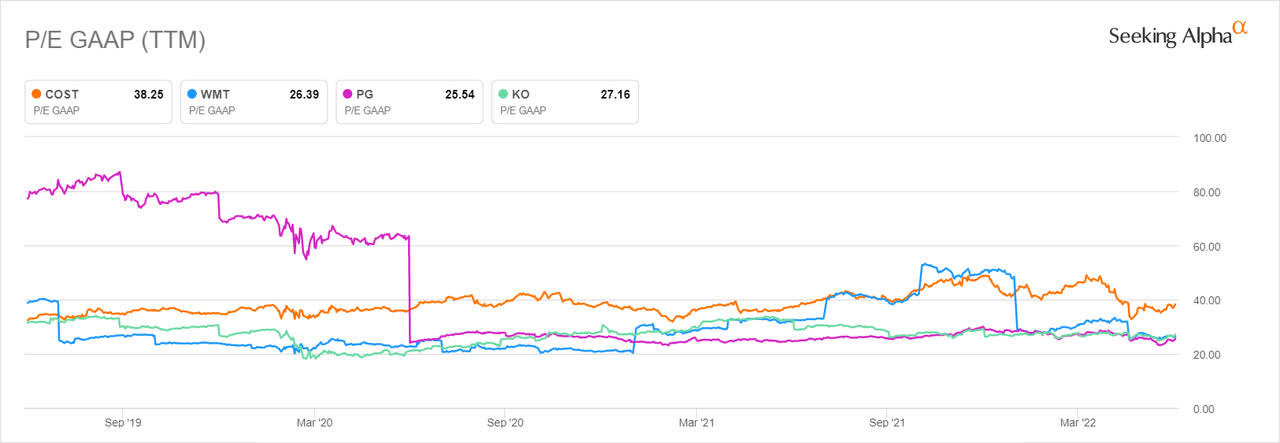
Basically, we see the same historical patterns in the Shops index that we have seen in the Nondurables and Household indexes, except that deviations, most likely driven from the Consumer Discretionary side, have knocked the relationship in the Fama-French indexes somewhat out of whack over the last couple years.
Apart from that, the messages are the same. The dividend yield on the Shops index as of May 2022 was 1.12%. For Costco and Walmart, it is currently 0.67% and 1.81%, respectively. History seems to suggest that the markets are due for a major reset, and this includes each segment of the Consumer Staples sector.
Chart U. The Shops index’s dividend yield suggests low future returns. (Fama-French)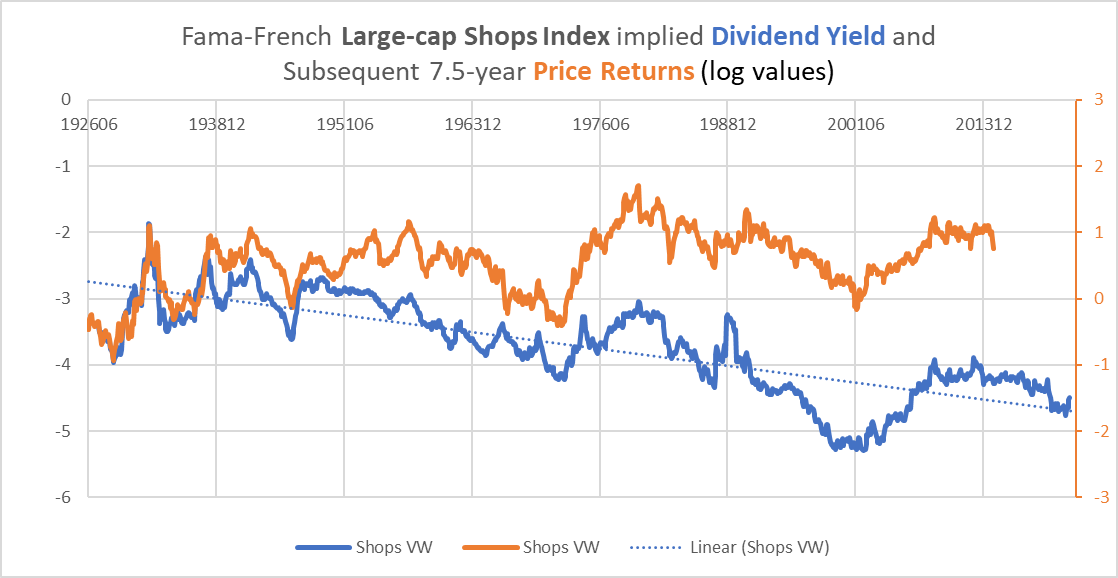
Inevitably, there will be relative performance within the sector, as well.
Opportunities in the sector
Over the remainder of the decade, we should not be surprised to see a number of companies that currently inhabit the XLP to be kicked out and for others to move in in their place. I think there is some indication that Nondurables are likely to thrive the most in a ‘secular’ bear market (relative to producers of consumer household goods or retailers) and that small-cap Nondurables could conceivably thrive in such an environment.
But, first it is likely that markets will have to endure a significant cyclical downturn, and these have often been quite difficult on small caps of any sector. In the following chart, I calculated drawdowns in monthly Nondurable stock/Treasury ratios relative to a 36-month high. Particularly where there is a strong, cyclical deflationary impulse (as in the early 1930s, late 1930s, and 2008-2009), small-cap Nondurables have been quite severely punished.
Chart V. Small-cap Nondurables equities have sold off hard relative to Treasuries during previous deflationary shocks. (Fama-French; Shiller; St Louis Fed)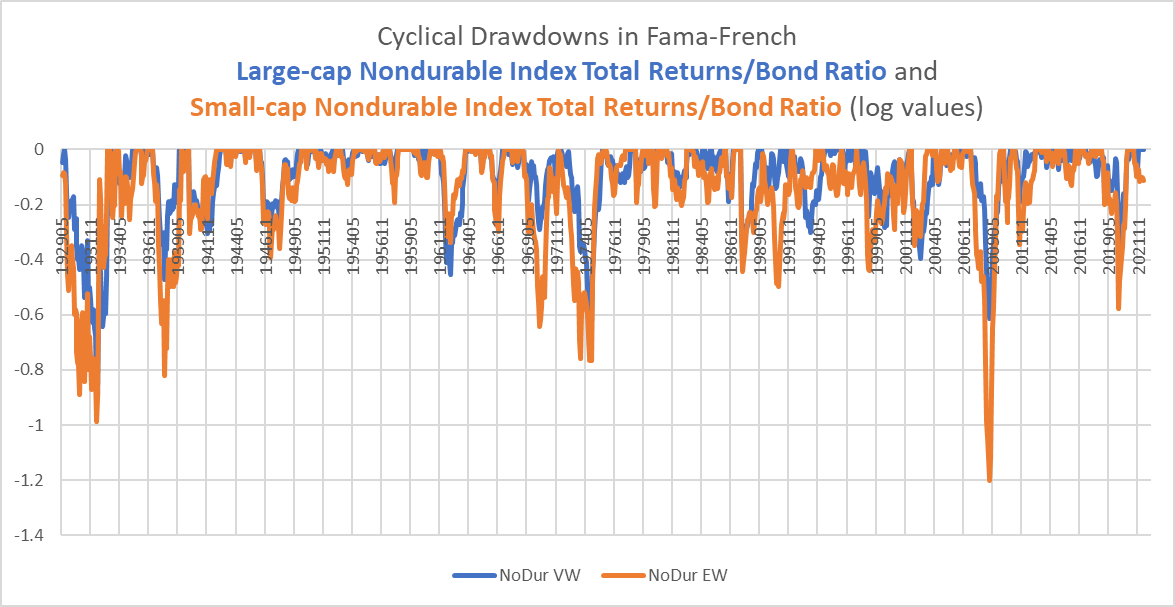
The large caps have been slower to fall. I expect to see a similar dynamic this time, as well. The well-run behemoths at the top like P&G, Costco, Walmart, Coca-Cola, and Pepsi are likely to prove safe relative to most other consumer staples companies and to the S&P 500 as a whole in the event of a deeper and prolonged cyclical selloff, even though they will likely not be immune to that selloff. They have negotiated a very difficult cycle marked by a pandemic, supply-chain chaos, and inflation, and they are extremely well run, but they are also priced for perfection.
Companies like P&G and Clorox have had their margins squeezed, especially the latter as it was first dragooned into the war on Covid and then forced to pay through the nose for supplies.
Chart W. Clorox’s margins ought to improve as supply chain and inflationary pressures recede. (Seeking Alpha/YCharts)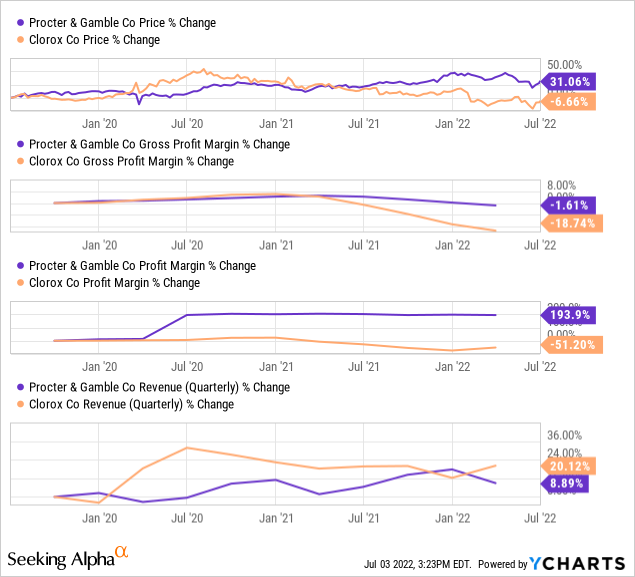
As supply chains untangle, demand normalizes somewhat, and commodity prices ease, I expect Clorox’s margins will recover and this will drive a relative resurgence in the stock’s performance, despite the high PE ratio (34.8, according to Seeking Alpha), and even if this might occur due to a fall in the XLP rather than a rise in Clorox.
Chart X. Clorox has underperformed the XLP since mid-2020. (Seeking Alpha/YCharts)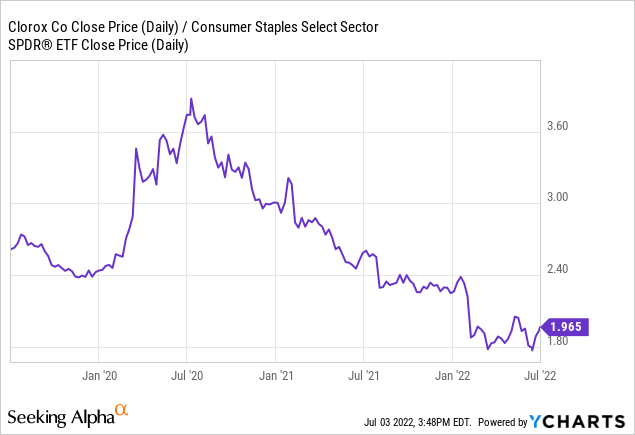
That it also has US-centered revenue streams is likely to be a plus in a currently stable but increasingly fragmented world order.
Chart Y. Clorox’s domestic orientation might provide additional relative resilience in a deglobalized economy. (Clorox 4Q21 earnings presentation)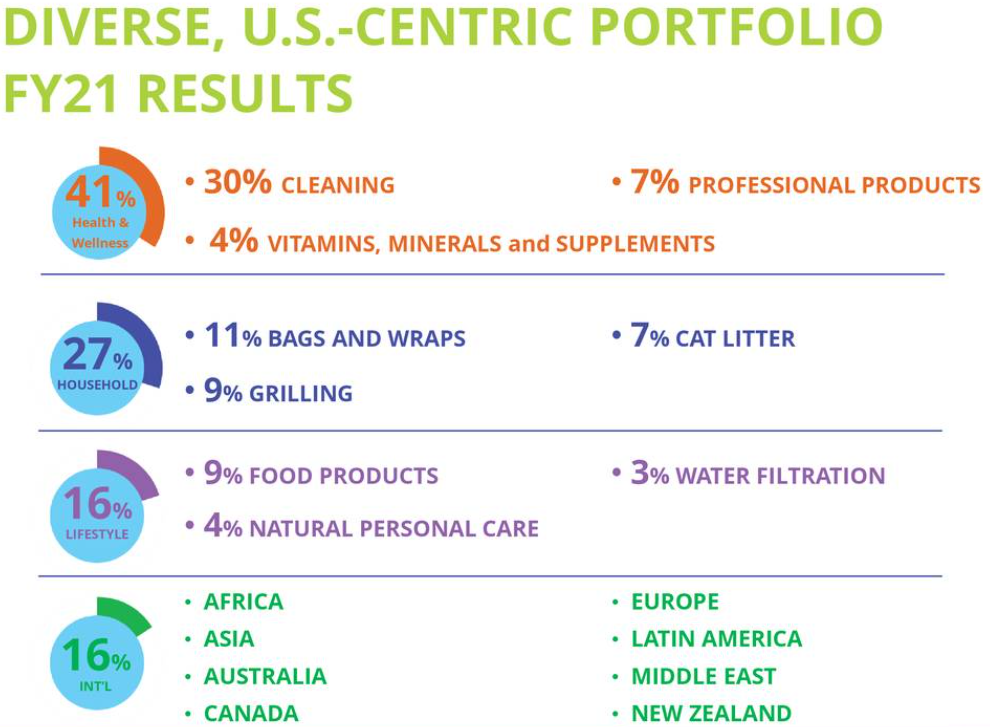
A fragmented, low-growth world might also be relatively beneficial to companies like Molson Coors, which have struggled to establish a foothold in premium brands and outside of North America but have a stronger position in more economical brands at home. Yet even with a PE of 11.3, I would wait until after a more significant selloff in the broader market has occurred before dipping a toe.
In the history of cyclical selloffs, as illustrated in Chart V above, it is the small and weak who tend to be punished first. Thus, there is probably both time and space to buy some of these companies at lower absolute and relative levels.
Chart Z. Molson Coors may outperform long term, but it is better to wait for further downside pressure. (Seeking Alpha/YCharts)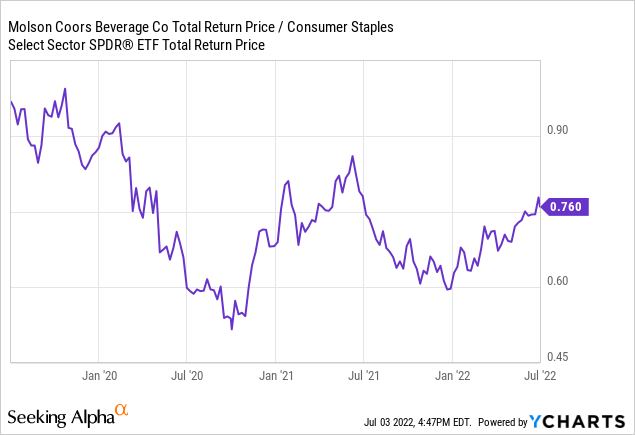
Conclusion
The primary threat to my outlook for Consumer Staples is a possible overemphasis on historical patterns that are not widely acknowledged, likely because they lack a clear theoretical justification. The likeliest point of failure is in the assumption that a depression is even possible in a monetary and political system that is much more vigilant about preventing deflation than it is preventing excess inflation. Since the Depression, when one sector or asset class has flagged, another soon came to carry the banner of inflation. The factor that has shown the greatest consistency, somewhat surprisingly, is corporate earnings, which have grown, except for brief and occasionally sharp interruptions, at a consistent 6% clip since the 1930s. We are likely only in the early stages of a cyclical deterioration in earnings, which is in itself not especially unusual, but the real question is whether or not it will turn into an earnings depression (either in terms of depth or length but presumably both).
Against such a backdrop, all sectors would likely suffer a great deal, although some more than others. What seems more certain, partly because of historical experience and partly because market action has begun to reaffirm it, is a passage from a tech-dominant market to leadership from elsewhere, presumably the less sophisticated sectors like energy, materials, industrials, and staples. Whether one wants to meet this through a long/short strategy or through a more aggressive bearish position depends, as I see it, on the degree to which one expects a substantial deflationary growth shock.
Collectively, the stocks that make up the Consumer Staples sector are trading at multiples that have historically been followed by lower returns, and these high multiples have emerged in a period that has historically suggested bearish outcomes over both the long and short terms. Energy and commodity shocks at the conclusion of a period of tech dominance have typically been followed by growth in earnings substantially below the expectations implied by high multiples, and stock prices have historically responded accordingly.
As tech recedes, we might expect the humbler sectors to outperform, and Consumer Staples is likely to be one of them. The brief historical examination above suggests that stocks in the Nondurable sector, perhaps food- and beverage-related stocks especially, will likely have the upper hand within Staples, as will small caps over the long term (I wrote about the size effect as primarily a ‘secular’ bear market phenomenon earlier in the year). When I couple this with an expected long-term deterioration in globalization, this also suggests domestically oriented, affordable brands. Chuck Walston wrote an excellent piece on Hormel, which includes a detailed rundown of all of the pressures facing packaged food producers (for example, a return to restaurants coupled with a turn towards generic brands) at the moment. A deflationary growth shock may relieve some of those pressures, but in the event of a depression, expect consumer expectations and tastes to change along the way.
Many of the companies that lead XLP have been consistent cash-producing juggernauts for decades. I expect that this is going to be disrupted over the next decade just as it was in the 1930s. As unlikely as this seems, I have a harder time putting together a bullish case that does not require us to break historical precedent.
Be the first to comment