

xefstock
Thesis
Investors face two major risks: valuation risks (paying too much for a wonderful business) and quality risks (buying a horrible business even at a cheap price).
Not that long ago (around Oct. 2021), the risks associated with Meta Platforms (NASDAQ:META) were dominated by the former, i.e., valuation risks. The risks extend to other stocks in the digital ad space too, such as META’s close peer Google (GOOG). At that time, the stock’s valuation reached a peak level above 30+. As you can see from the following chart (showing the growth of a $10k investment), in the past 3 years, both META and GOOG have been outperforming the broader market by a wide margin up to late 2021.
Then things took a dramatic turn for META (and for GOOG too, but to a lesser degree). META’s stock price plunged sharply during Q1 of 2022 after it reported a slowdown in user growth and a tougher monetization environment. The stock prices then kept sliding afterward. All told, the decline since then not only wiped off all the spectacular gains accumulated over the past 3 years but also caused the investment to lose almost half of its value (43% to be exact, which would require a 73% rally to break even).
Seeking Alpha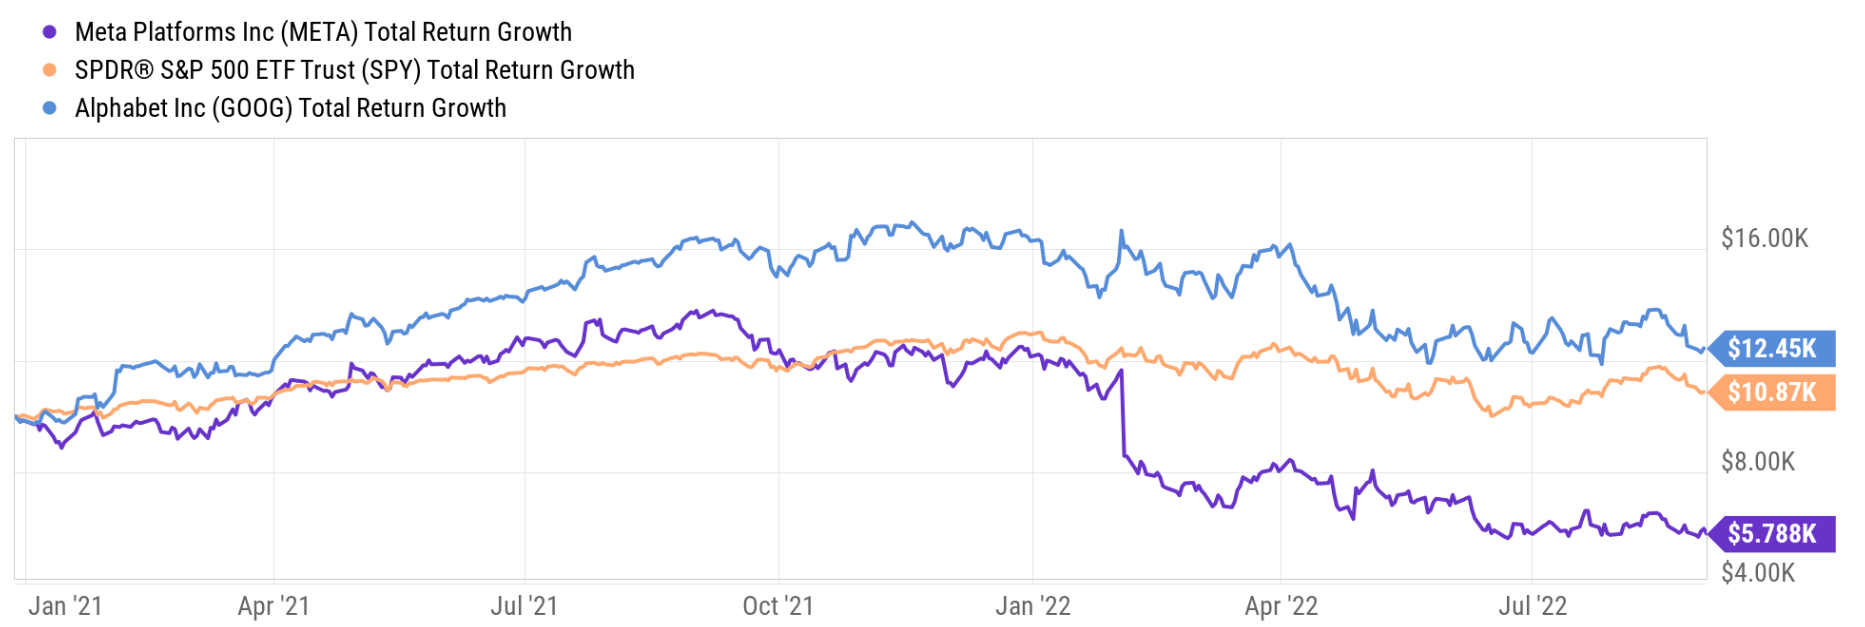
In tandem with its price plunges, its valuation also contracted severely. As you can see from the next shot below, its PE ratio has been moving in almost lockstep with GOOG until Q1 2022. There are good reasons for such lockstep movements given that they are the duopoly in the digital ad space, as to be elaborated on later. Then came the divergence in Q1 2022. To wit, currently, META trades at about 13x PE, only about 1/3 of its peak PE of 37x and about 35% below GOOG’s ~20x PE.
So, to me, the question surrounding META is not if it is cheap enough or not. There is little doubt that META is cheap now, both in relative and absolute terms. The real, and only, question in my mind is if it is a value trap or not.
And the thesis of this article is to show why my answer is no. And let’s dive in.
Seeking Alpha
META profitability examined by Fama French
We will take a more macroscopic approach here following the Fama French method. For readers interested in a more microscopic level discussion of its specifics, I’ve written a few articles in the past on its return on capital, competitive landscape, owners’ earnings, and also the challenges of its digital ad segment and its new virtual reality initiatives.
The background of the Fama French has been provided in our earlier article on Apple here. A brief recap is provided here for ease of reference:
The method is named after Eugene Fama and Ken French. In 2013, Eugene Fama shared the Nobel Prize in economics with Lars Peter Hansen and Robert Shiller for their work on asset prices. The Fama French method is considered a significant improvement over the CAPM method because it adjusted for outperformance tendency.
The raw data used in this article were pulled from the Dartmouth Tuck Business School database. We then analyzed the raw data using a simplified version of the Fama French method.
The following two charts show two of META’s factors (operation profitability and valuation) compared to the general market. Past results have shown that these two factors have truly held up over all time periods.
- The OP factor (Operating Profitability). The operating profitability factor in period t is defined as the operating income divided by the sum of book equity and minority interest for the last fiscal year ending in time period t-1.
- The PE factor (the Price/Earnings ratio). The PE factor is based on total earnings before extraordinary items, from Compustat.
META’s scores on these two factors are shown below. The first chart shows the OP factor of META compared against all the other stocks in the market by percentile. As you can see, META is definitely a highly profitable business. Its average OP is around 30% since 2018, above the top 25% percentile of the general economy. The comparison becomes even more impressive when its true profitability is considered as OP can be misleading. As argued in my free blog article, ROCE is a better and more universal metric than OP (which in essence is a variation of ROE). Measured by its ROCE (return on capital employed, the thick cyan line with symbols), its profitability is on average 56% since 2018. Admittedly, its current ROCE has been under pressure and is nowhere near its peak levels of 80% to 90% during 2014 and 2017. But its current ROCE is essentially still in the top 10% percentile as shown by the thinner cyan line. The ROCE for the overall economies is about 20% on average in the long run as shown by the green line in the chart.
Author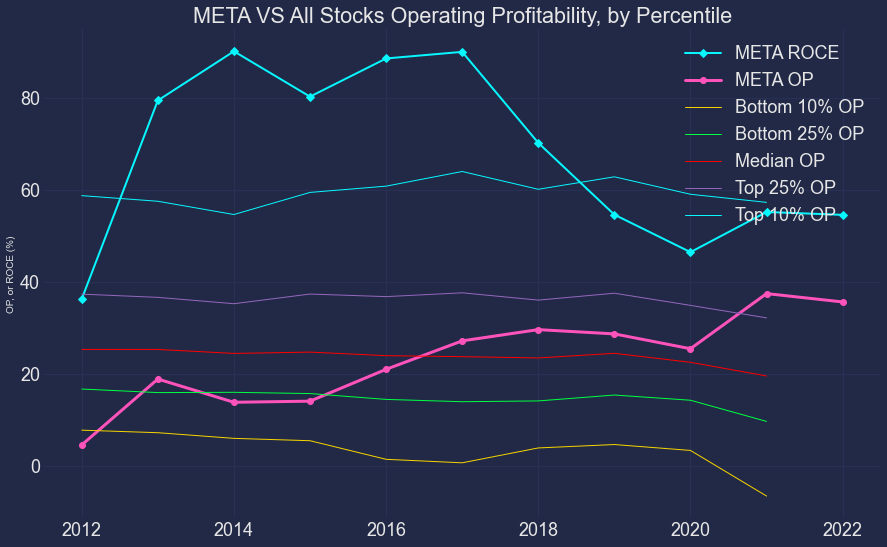
META valuation examined by Fama French
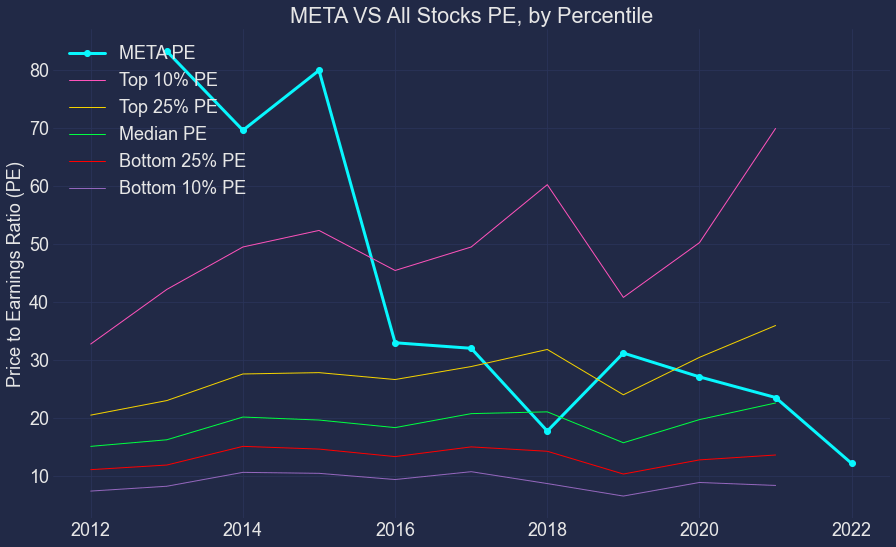
Now move on to the valuation factor. The next chart shows META’s PE factor compared to the overall market, again also in percentile. Note that META only barely turned profitable in 2012 and therefore its PE in that year was not that meaningful. So, the second chart below shows the same plot but with the 2012 data point removed.
To me, this chart really illustrates the power of having a bigger picture and following a value-centric investment approach. Take the 2014~2017 period as an example. Its 80+ PE was off the chart. But as you recall from the previous chart, its profitability as measured by ROCE is also superb and also off the chart (far above the 10% percentile). It was a combination that could be justified despite the astronomical PE. While in 2019 and 2020, the risk calculus totally changed. Its profitability was no longer that competitive as you can see from the previous chart, but its valuation was still near the top percentile.
Now the sentiment pendulum has swung too far to the fear extreme now in my mind. Its current PE is about 13x only as aforementioned. And as you can see, it’s so far below the market median. Its valuation is actually somewhere between the 25% and 10% bottom percentile, in stark contrast to its profitability (which is close to the top 10% percentile).
Author Author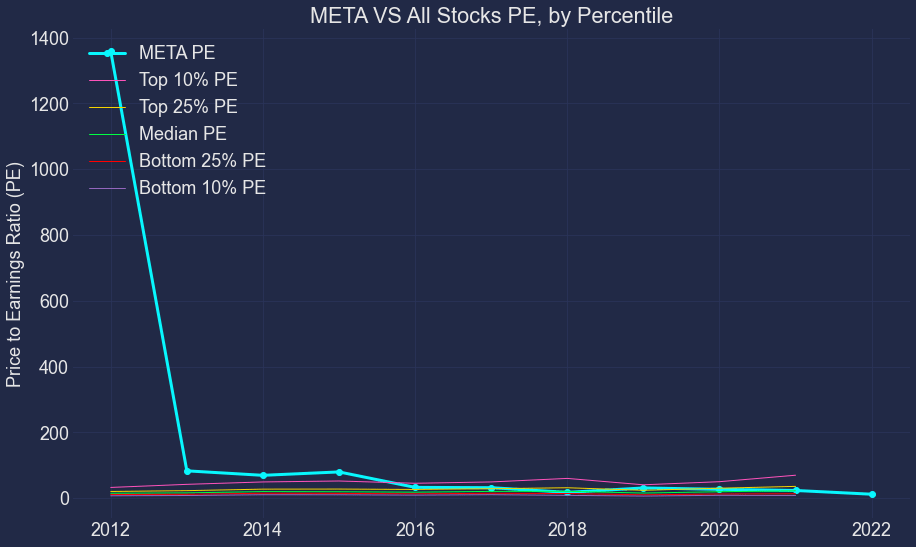
Business outlook
Looking forward, there are definitely headwinds ahead as to be detailed in the risk section below. But there is strong secular support for its core business, and also it is aggressively investing in new products.
There is an unstoppable secular shift toward digital advertising, and META is still a leader in this space. The world of advertising is moving toward digital advertising, and the year 2022 is likely to be a turning point in this transition. According to an eMarketer projection, 2022 probably would mark the first time that digital ad expenditure will surpass conventional ad spending. Furthermore, the report also predicts that by 2023, digital advertising will account for more than two-thirds of all media spending. And despite its muted growth outlook, META is still a leader (closely trailing Google but far ahead of Amazon). It is the current market share of 24.2% is behind Google by about 3.5%. And the gap is projected to further narrow to 2.3% (24.1% vs 26.4%) in 2023.
Source: eMarketer projection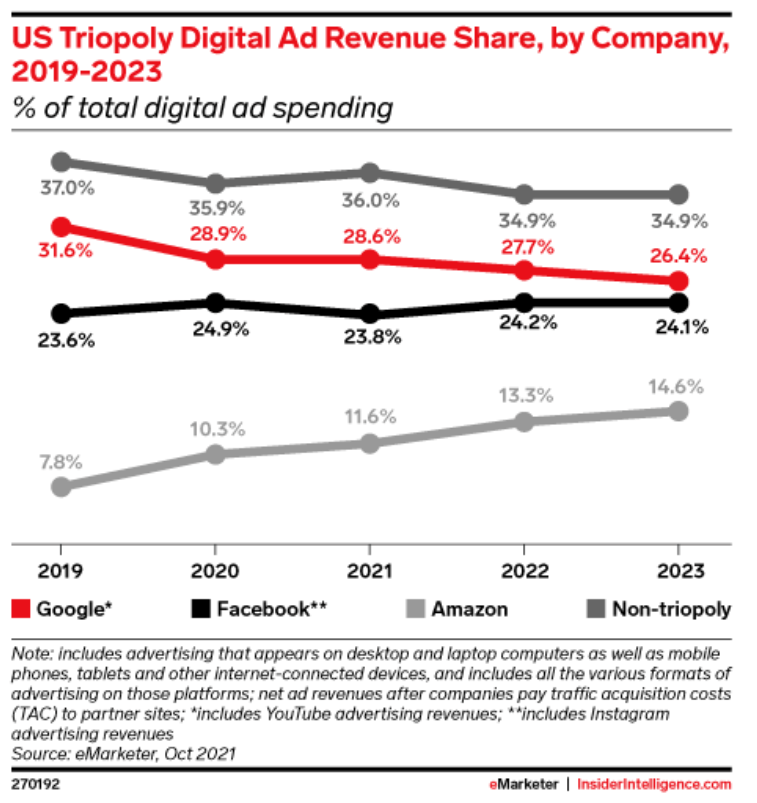
At the same time, the business is pursuing new products aggressively. A promising area for META is virtual reality (“VR”). The size of the VR market is anticipated to increase at a phenomenal pace of 44.8% CAGR to 2028, according to the following Globe Newswire study. Although the whole industry is still in its incipient stage (and so is META’s Reality Lab), exponential growth can be, well, just exponential once it gets started. All told, the market for VR is projected to reach about $84 billion in 2028 from virtually nothing now (about $4.4 billion total market size). And as a leader in this space, I am optimistic that META would be very likely to capture the lion’s share of this addressable market.
Source: Globe Newswire Report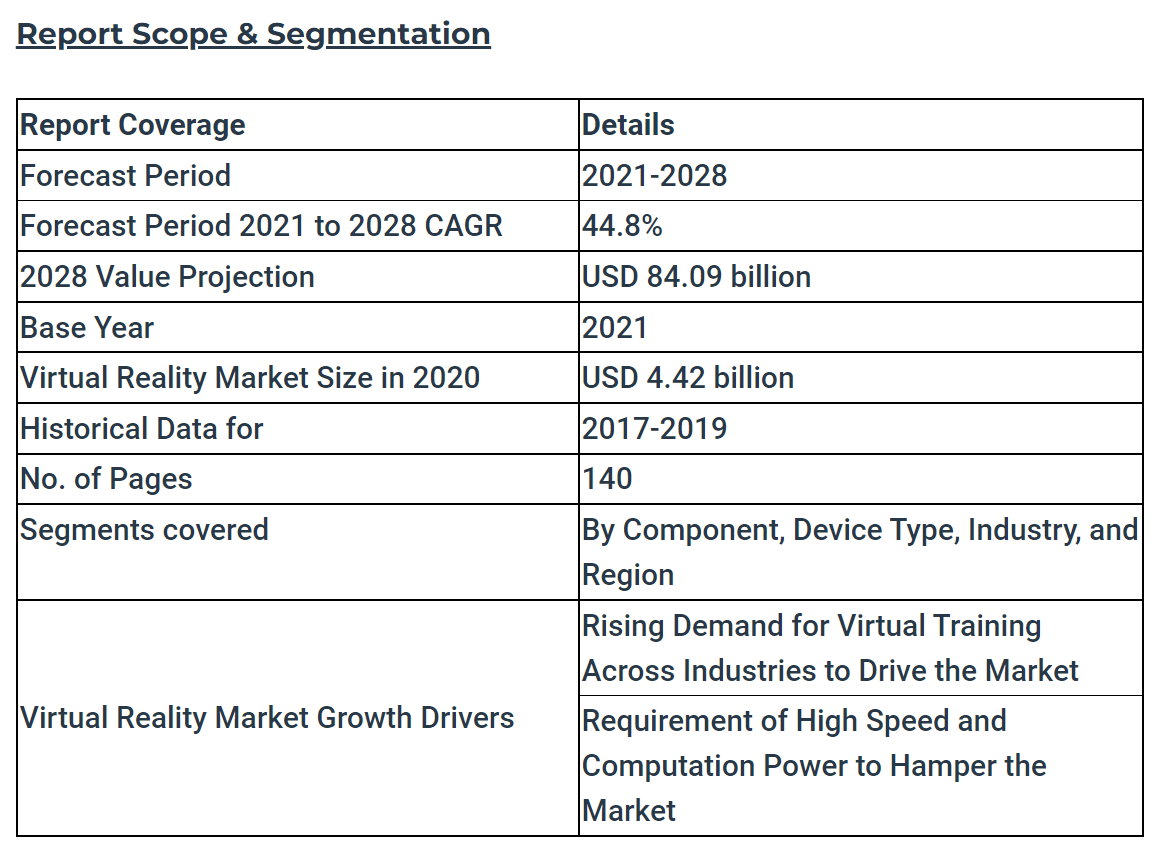
Final thoughts and risks
META represents a fascinating example to illustrate the irrational swing of the market sentiment and the power of always having a bigger picture in investing. Anchored with a bigger picture, its 80+ PE back in 2014~2017 is actually safer than its 30+ PE in 2019~2020. Back in 2014~2017, both its PE and its ROCE are off the chart, a combination that could be justified as shown below. While in 2019 and 2020, the risk calculus totally changed. Its profitability was no longer that competitive, but its valuation was still near the top percentile. Now the sentiment pendulum has swung too far to the fear extreme in my view. Its valuation is now near the bottom of the market (between the lowest 25% and 10% percentile) while its ROCE is still close to the top 10% percentile.
Finally, risks. META faces risks both in the near term and long term. In the near term, market demand renormalization is an immediate risk. The COVID breakout unexpectedly accelerated the penetration of e-commerce. But now that acceleration is leveling off. The company may have overexpanded in the past few years and has capacity redundancy to digest. It has announced reduced hiring and there is a possibility of layoffs. In the longer term, despite the tremendous potential of the VR addressable market, META’s current Reality Labs only contribute a minor portion of its income (less than 2%). The eventual success (if it is successful after all) still requires years of continued heavy investments.
Source: author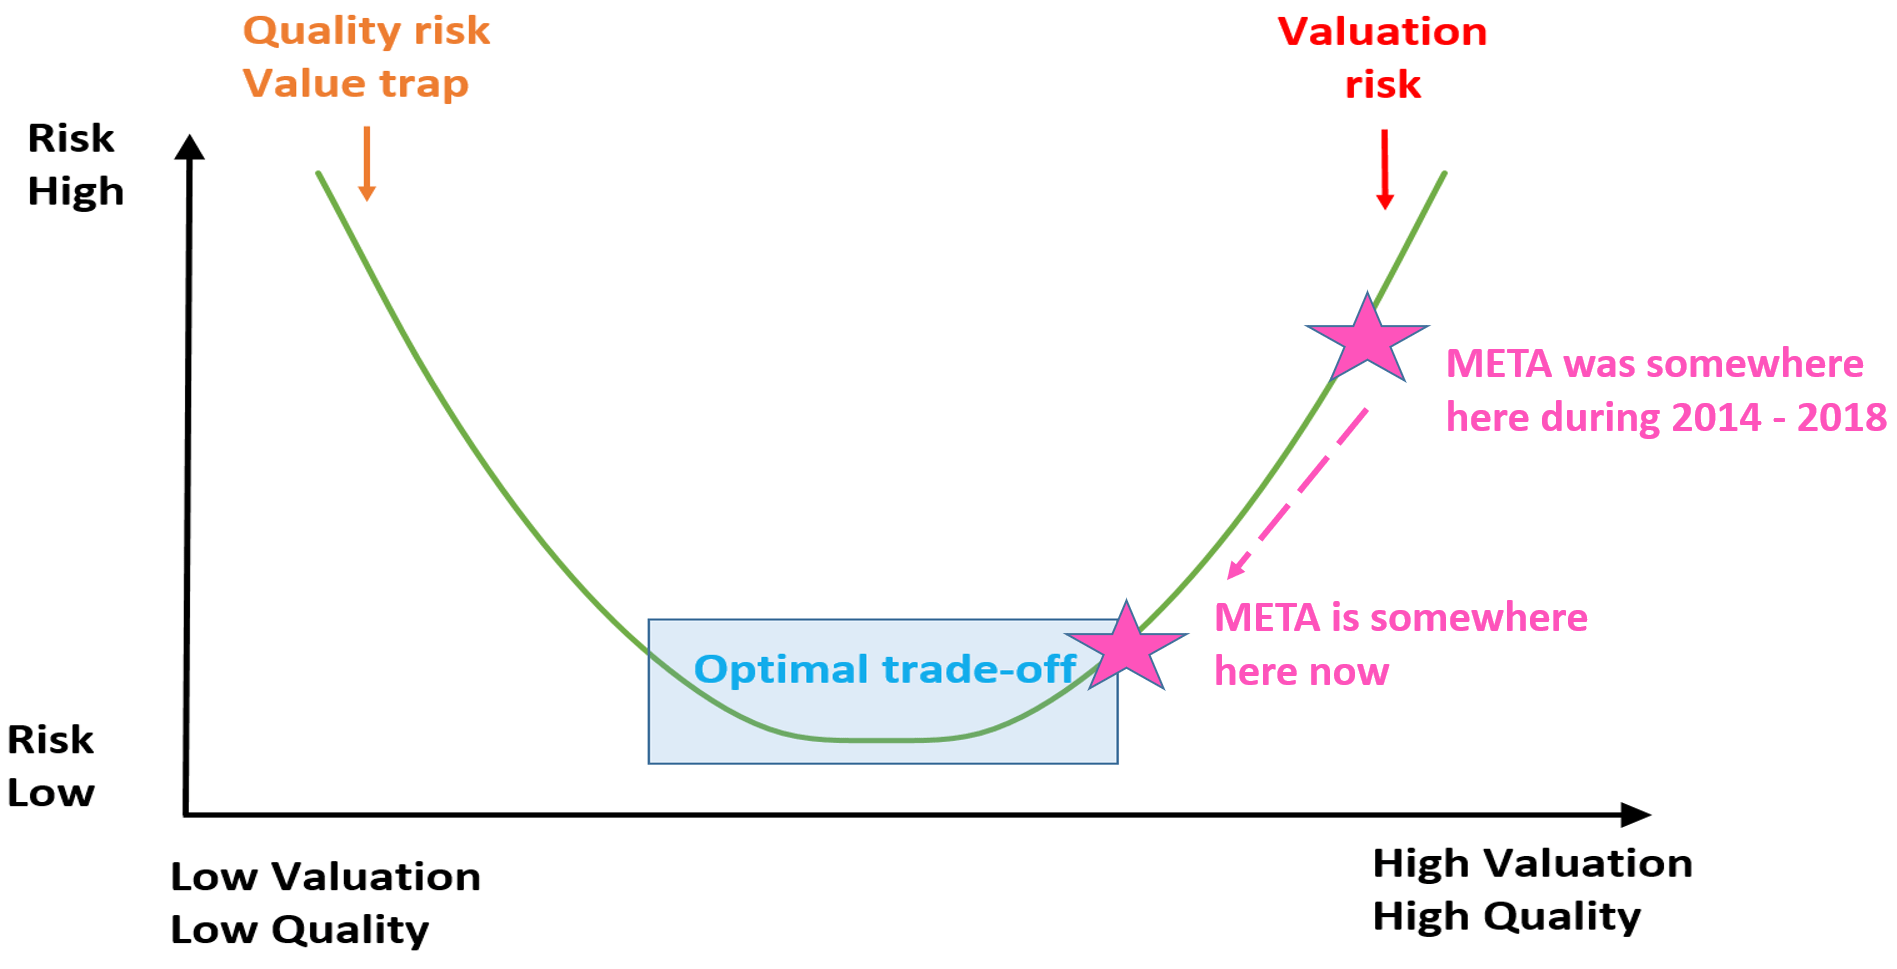
Be the first to comment