

Marcus Lindstrom
2022 was a tough year for Industrial REITs, which saw an average total return of (-32.0)%, even worse than the REIT average of (-28.9)%.
Hoya Capital Income Builder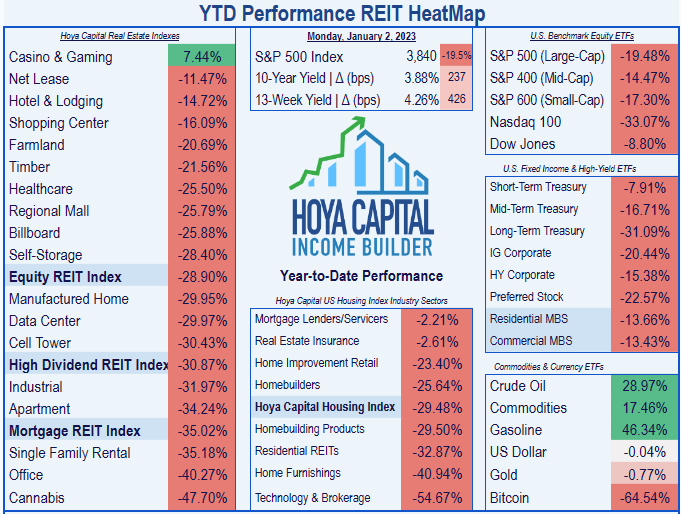
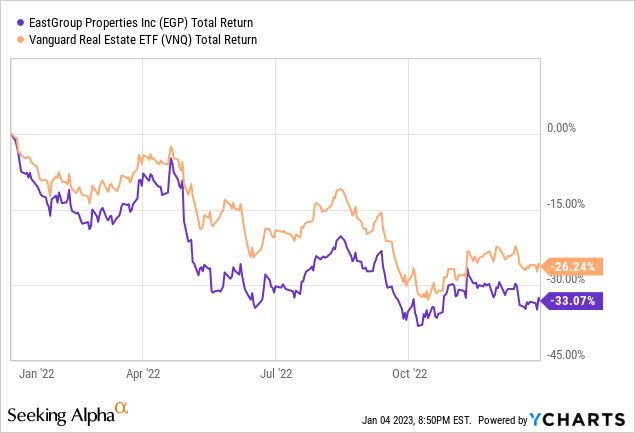
EastGroup Properties (NYSE:EGP) fared much like the average Industrial REIT, with a total return of (-33.07)%.
But the sell-off in Industrial REITs had little or nothing to do with the companies’ operating results, which were outstanding. In fact, the market-cap weighted average FFO growth for these 10 companies was 20.3%, and the average dividend growth per company was a whopping 25.5%.
As Hoya Capital notes in its recent sector report:
industrial vacancy rates declined to fresh record-lows below 3%, while rent growth surged 15%. Industrial REITs reported record-high leasing spreads of nearly 30% last quarter.
Industrial REITs trail only Cannabis and Timber REITs for 5-year FFO growth rate.
Hoya Capital Income Builder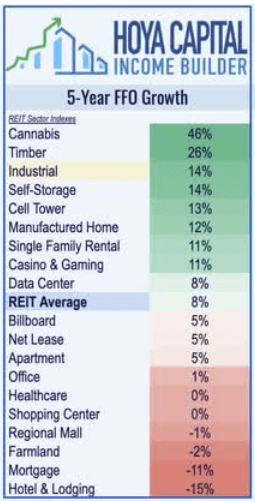
The supply and demand picture heavily favors Industrial REITs. Absorption of industrial logistics facilities has outpaced completions in 9 of the past 12 years.
Hoya Capital Income Builder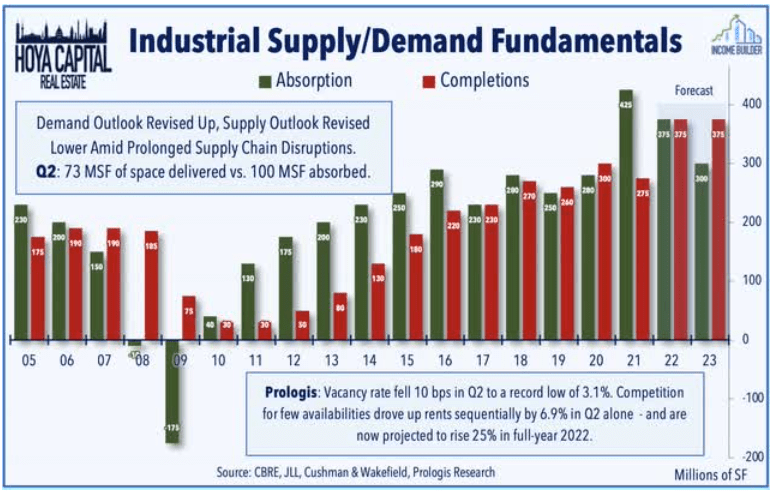
As a result, rents are up sharply, across all segments of the supply chain industry.
Hoya Capital Income Builder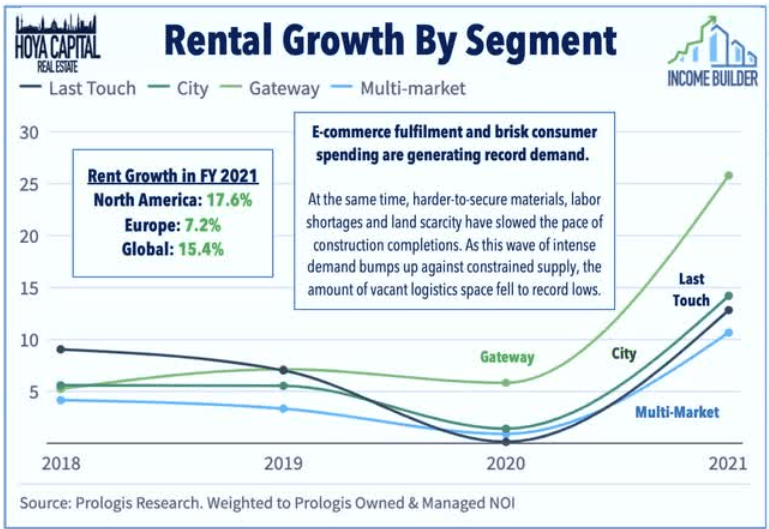
This has created a situation in which there are genuine bargains available: high growth companies with great dividend-growth track records, selling at unusually low prices. One of those bargains is the subject of this article, examining growth, balance sheet, dividend, and valuation metrics for EastGroup Properties, an Industrial REIT dividend growth machine.
Meet the company
EastGroup Properties, Inc.
Founded in 1969, and headquartered in Jackson, Mississippi, EastGroup Properties owns and operates multi-tenant, shallow bay warehouse facilities, with about 56 msf in 25 primary and secondary markets, spread across 11 U.S. states. The company sits squarely in the market cap sweet spot at $6.5 billion.
EastGroup focuses on:
- Multi-tenant distribution properties
- Urban infill sites in supply-constrained submarkets
- In choice last-mile e-commerce locations
- In major, fast-growing Sunbelt markets
- Around transportation facilities in high-growth areas.
Over 75% of the company’s square footage is concentrated in three Sunbelt states: Texas (34%), Florida (24%), and California (21%). (According to management, Hurricane Ian did only minimal damage to EGP’s Florida properties.)
EastGroup investor presentation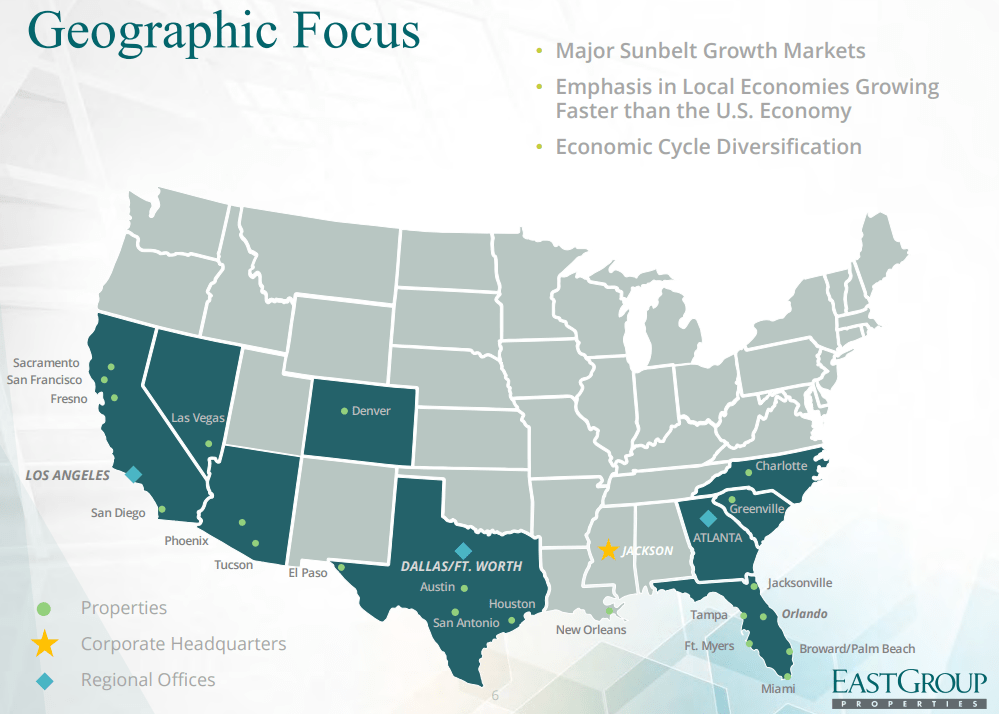
More than 75% of EGP customers rent fewer than 100,000 square feet. EastGroup targets customers that need to be in their location, thus competing on location rather than price.
As a result, EGP’s tenant base is extremely well diversified. The top 10 customers account for only 8.9% of ABR (annual base rent). The top customer, Amazon, accounts for only 2.2%, and no other customer accounts for as much as 1.0%.
EastGroup Q3 2022 earnings supplemental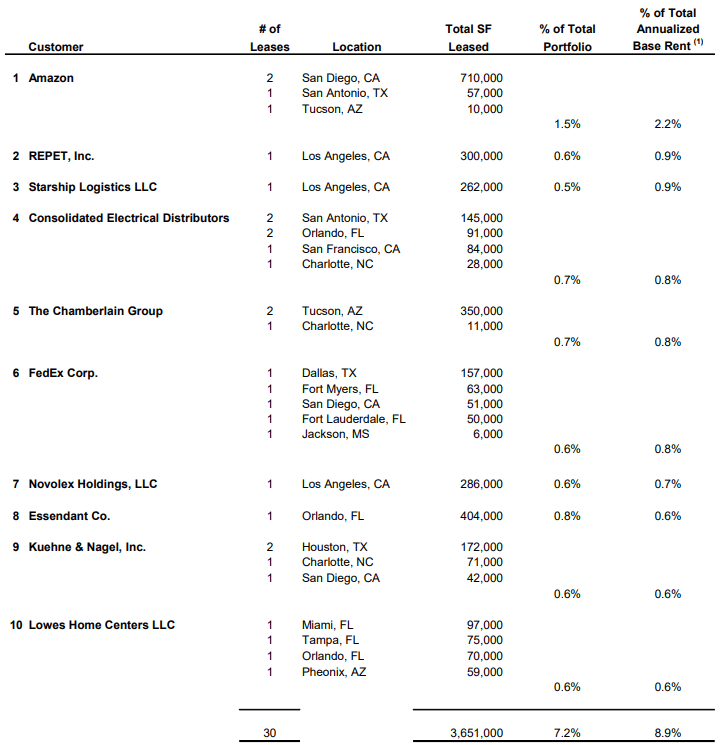
As of September 30, the portfolio was 99.0% leased and 98.5% occupied, with a weighted average lease term of 5.0 years. Lease expirations climb from 11.3% of ABR next year, to 18.8% in 2026, then taper off sharply in 2028.
EastGroup Q3 2022 earnings supplemental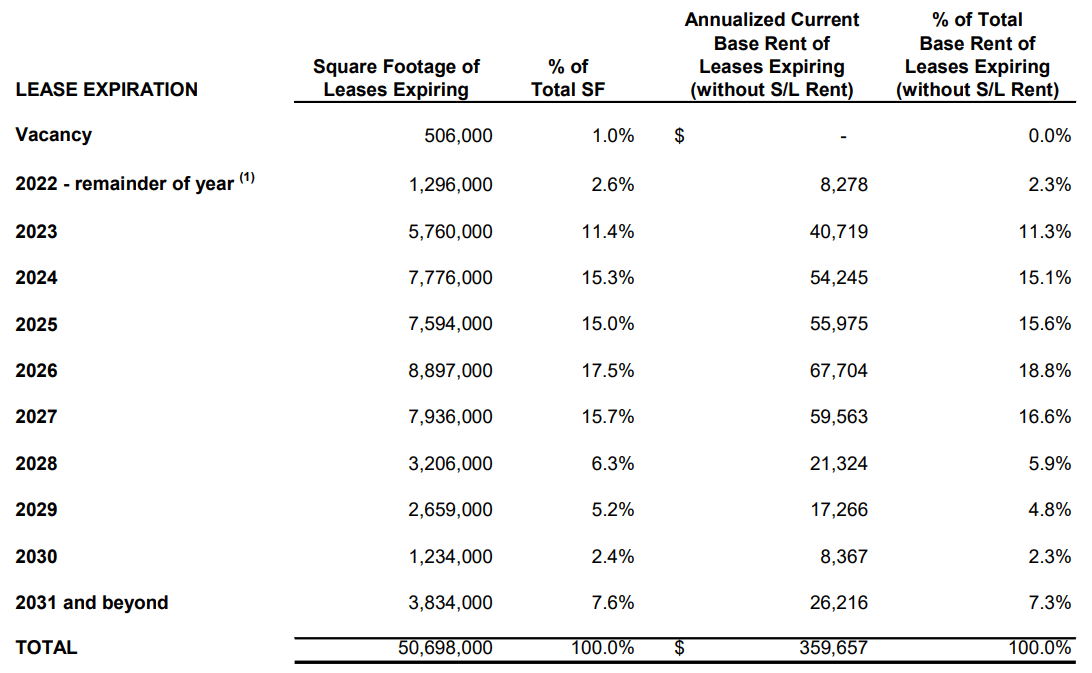
Like most REITs, EGP grows through acquisitions, ground-up development, redevelopment, and internal growth. EGP places a heavier emphasis on ground-up development than most, having built 48% of their current portfolio themselves. President and CEO Marshall Loeb noted on the Q3 earnings call:
Through September 30, we’ve completed 11 development and value add projects with 10 of those rolling into the operating portfolio fully leased at an average yield of 6.6%. In addition to these, we have another 8 projects which are 100% leased prior to construction completion.
This year, however, EGP has also acquired 1.7 msf of operating properties at a cost of $359 million, by far their largest buying spree in the last 5 years.
The company also does value-add acquisitions in markets where they already have a presence. EGP currently has 27 development and value-add projects underway, in 14 different cities, totaling 4.9 msf, at a projected cost of $601 million.
Quarterly results
Q3 2022 was EGP’s 38th consecutive quarter of FFO growth. Impressively, quarterly results showed:
- FFO per share of $1.77, up 14.2% YoY.
- FFO per share guidance for the full year raised from $6.90 to $6.93 at the mid-point.
- Same-property NOI up 8.7% YoY on a cash basis.
- Same-property NOI guidance raised from 8.5% to 8.8% at the mid-point.
- Blended leasing spreads up a whopping 39.4% YoY.
- 299,000 square feet of value-add property acquired, plus 108 acres of land for a total investment of $44 million. Total acquisitions YTD come to 286 acres and 2.75 msf of operating properties, at a cost of $559.7 million.
- Guidance for full-year operating property acquisitions raised from $360 million to $380 million.
- 6 development projects completed in Q3, adding 817,000 square feet to the operating portfolio.
- Dividend increased by 13.6%.
- 288 leases executed YTD (110 new and 178 renewal), with leasing costs of just $0.92 per square foot.
- Only 391,000 shares issued this year, an increase of less than 1% in the total share count.
Growth metrics
Here are the 3-year growth figures for FFO (funds from operations), TCFO (total cash from operations), and market cap.
| Metric | 2019 | 2020 | 2021 | 2022* | 3-year CAGR |
| FFO (millions) | $186.9 | $211.6 | $245.9 | $292.9 | — |
| FFO Growth % | — | 13.2 | 16.2 | 19.1 | 16.2% |
| FFO per share | $4.98 | $5.38 | $6.09 | $6.95 | — |
| FFO per share growth % | — | 8.0 | 13.2 | 14.1 | 11.8% |
| TCFO (millions) | $196 | $196 | $256 | $369 | — |
| TCFO Growth % | — | 0.0 | 30.6 | 44.1 | 23.5% |
| Market cap (billions) | $5.16 | $5.46 | $9.26 | $6.45 | — |
| Market cap growth % | — | 5.8 | 69.6 | (-31.3) | 7.7% |
*Projected, based on Q3 2022 results
Source: TD Ameritrade, CompaniesMarketCap.com, and author calculations
The revenue and cash-flow figures are FROG-worthy, and stronger this year than in 2021, when share prices exploded.
Meanwhile, here is how the stock price has done over the past 3 twelve-month periods, compared to the REIT average as represented by the Vanguard Real Estate ETF (VNQ).
| Metric | 2019 | 2020 | 2021 | 2022 | 3-yr CAGR |
| EGP share price Dec. 30 | $132.03 | $137.53 | $226.54 | $148.06 | — |
| EGP share price Gain % | — | 4.2 | 64.7 | (-34.6) | 3.89% |
| VNQ share price Dec. 30 | $92.13 | $84.12 | $115.69 | $82.48 | — |
| VNQ share price Gain % | — | (-8.7) | 37.5 | (-28.7) | (-3.62)% |
Source: MarketWatch.com and author calculations
While the VNQ has lost an average of (-3.62)% per annum on the share price, EGP shares have gained an average of 3.89%, despite this year’s brutal sell-off.
Balance sheet metrics
In a year when many REITs took on debt, EGP’s Liquidity Ratio, Debt Ratio, and Debt/EBITDA are all better than the REIT average. However, Industrial REITs are characterized by strong balance sheets, so these numbers for EGP, though sturdy, are at or slightly below the sector average.
| Company | Liquidity Ratio | Debt Ratio | Debt/EBITDA | Bond Rating |
| EGP | 2.01 | 14% | 5.4 | — |
Source: Hoya Capital Income Builder, TD Ameritrade, and author calculations
The company’s fixed-rate debt totals $1.5 billion, at a weighted average interest rate of just 3.10%. The variable-rate debt adds up to $156 million, at a weighted average of 3.79%. So the overall weighted average interest rate is a miniscule 3.17%, on $1.656 billion. Debt comprises just 21% of the company’s total capitalization.
EastGroup investor presentation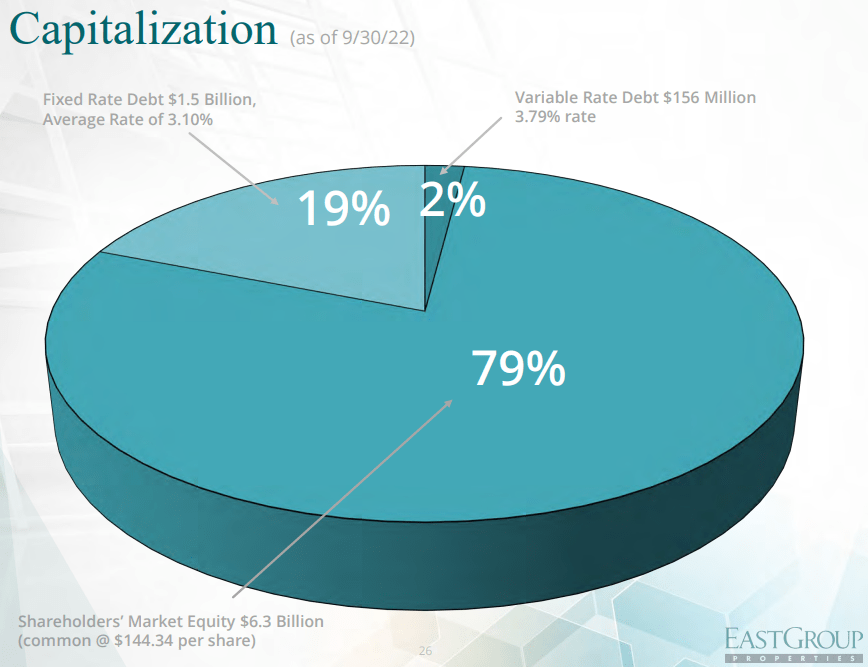
According to CFO Brent Wood:
We have been intentionally deleveraging the balance sheet over the past several years placing ourselves in an advantageous position to pivot to debt proceeds for capital sourcing.
Dividend metrics
EastGroup has increased its dividend each of the last 11 years, and 27 of the past 30, with no cuts. With a dividend well above the Industrial REIT average, and a blistering 18.6% dividend growth rate, EastGroup is a better dividend payer than the average REIT, if held for at least 3 years. With a dividend safety grade of B-, there is little to worry about, despite the generous 70% payout ratio.
| Company | Div. Yield | 3-yr Div. Growth | Div. Score | Payout | Div. Safety |
| EGP | 3.29% | 18.6% | 5.49 | 70% | B- |
Source: Hoya Capital Income Builder, TD Ameritrade, Seeking Alpha Premium
Dividend Score projects the Yield three years from now, on shares bought today, assuming the Dividend Growth rate remains unchanged.
Valuation metrics
Industrial tend to trade at higher Price/FFO multiples than the average REIT, but EGP is currently trading below the Industrial REIT average of 23.4. This is remarkable, considering its FROG-like growth, sturdy balance sheet, and lavish dividend profile.
| Company | Div. Score | Price/FFO ’22 | Premium to NAV |
| EGP | 5.49 | 21.9 | (-11.6)% |
Source: Hoya Capital Income Builder, TD Ameritrade, and author calculations
What could go wrong?
Like all risk assets, REITs are in for a wild ride until the market finds a bottom, and Industrials are no exception.
If general economic conditions across the Sunbelt states materially deteriorate, especially in Texas, California, or Florida, EGP could be negatively impacted. Continued increases in interest rates could raise the cost of borrowing and slow the company’s growth. A return to record-high inflation would adversely affect construction and other costs, should that occur.
Because EGP’s tenants tend to be smaller companies, the underlying soundness of the customers’ businesses may at times become an issue.
In the event of civil or international war, supply chain facilities would be highly prized assets by both sides of the conflict, resulting in an elevated risk of damage, destruction, or confiscation.
Investor’s bottom line
EastGroup Properties offers stellar growth and safe, fast-growing, above-average dividends, all at a fair price, but insiders and hedge funds are cutting their exposure. Thus, there will probably be some softness in the share price in the near term, but this company is a winner and a dividend growth machine, and should be a good investment over a 2-to-5 year time frame. I rate this company as a Buy for patient investors, but not for short term traders.
Seeking Alpha Premium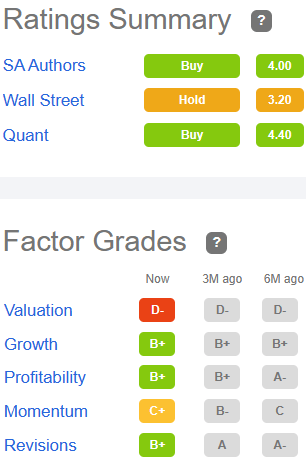
The Seeking Alpha Quant ratings system also rates EGP a Buy, giving it high marks for everything except Valuation.
Eleven of the fifteen Wall Street analysts covering the firm advise a Hold, while Buy or Strong Buy ratings outnumber Sell or Strong Sell ratings 3-to-1. The average price target is $168.85, implying 11% upside.
The Street rates EGP a Buy, while TipRanks, Zacks, and Ford Equity Research rate it a Hold.
As always, the opinion that counts the most is yours.
Be the first to comment