

Just counting up my dividends and looking at hedging techniques to better understand earnings. What does your cat do? Svetlana Sultanaeva/iStock via Getty Images
Get ready for charts, images, and tables because they are better than words. The ratings and outlooks we highlight here come after Scott Kennedy’s weekly updates in the REIT Forum. Your continued feedback is greatly appreciated, so please leave a comment with suggestions.
We’re going to keep this quick. Agency mortgage real estate investment trust (“REIT”) book values are largely up quarter-to-date. However, I want to highlight a mortgage REIT where I believe the market misunderstands the financial statements. This is due to a difference in the way hedges were designed.
Dynex Capital
Dynex Capital, Inc. (DX) has been underperforming peers on share price ($13.20 today), despite strong book value performance relative to peers. For a mortgage REIT like DX, positions are recorded at fair market value. Consequently, book value and NAV (Net Asset Value) will be the same.
DX now trades at the largest discount to book value among the agency mortgage REITs (using our projected BV as of 12/09/2022). The REIT certainly had some headwinds from interest rates and consensus analyst estimates call for dramatically lower core earnings compared to peers. However, I like the way DX issued shares during Q3 2022. A larger issuance would’ve been nice, but DX was able to issue shares above book value while spreads were wide. They were also buying up assets at much more attractive yields.
I also like seeing that Scott’s early December BV estimate was $15.10. That exceeds DX’s Q3 2022 ending book value ($14.23).
Leverage was also increased quite a bit by the end of Q3 2022. I’m comfortable with management making that choice also.
DX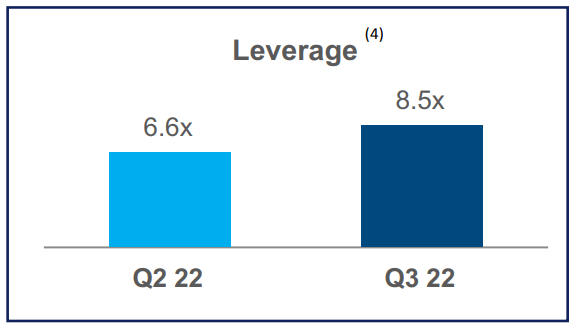
That’s a large increase in leverage. However, DX implemented that increase to take advantage of dramatically wider spreads between MBS and Treasury rates.
From Scott’s Q3 2022 DX Earnings Update:
“I continue to believe DX’s management team is talented and the BV results from the third quarter of 2022 only solidifies this viewpoint (have to compare BV results to sub-sector peers in this regard; less severe decrease). However, I also believe DX’s management team has made a mistake regarding not utilizing interest rate payer swaps in the current (and foreseeable) environment. Simply look at DX’s recent core earnings. Again, I always try and remain non-bias in my assessments. This holds true even when I personally hold a position in any given stock (which is the case with DX).“
Net Interest Spread
It appears Net Interest Spreads are collapsing:
DX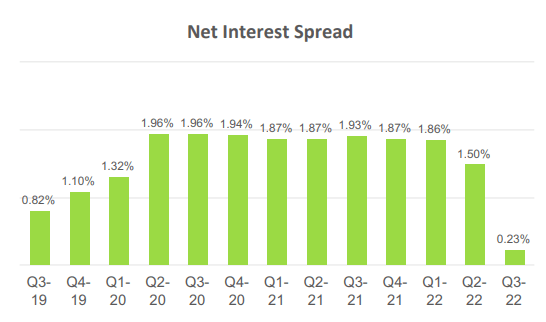
However, the adjusted net interest spreads are much better:
DX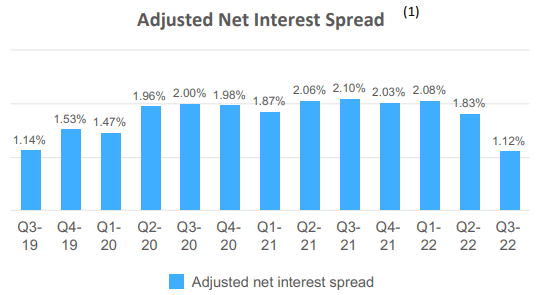
As DX describes the difference:
“Adjusted net interest spread, a non-GAAP measure, includes the impact of net periodic interest cost/benefit from interest rate swaps (if applicable in the period shown) and drop income from TBA dollar roll positions.”
That’s important. The adjusted net interest spreads are a better figure, but even they may understate what DX can do with their portfolio.
Investors who only look at the consensus analyst estimates for earnings will misread the situation for DX.
The way DX hedged allows higher borrowing costs to flow through the income statement:
DX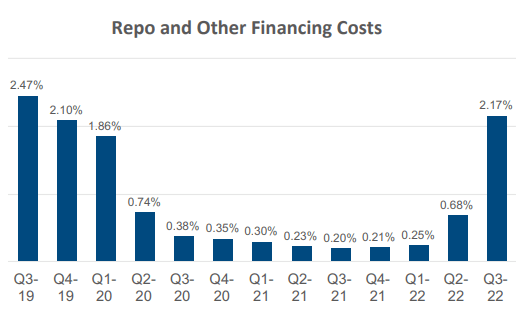
This strategy makes the higher costs more visible to investors.
DX was hedging using Treasury Futures:
DX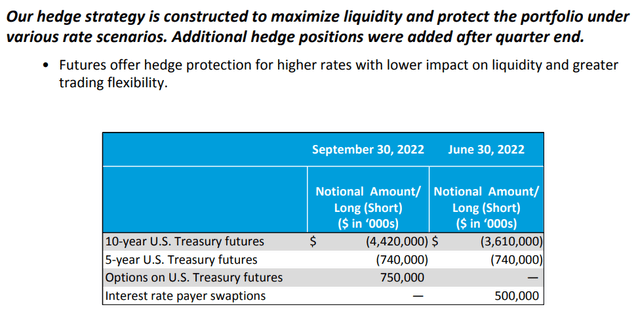
Hedging with Treasury futures is a perfectly viable choice for a mortgage REIT. It still provides protection for book value and the positions have ample liquidity. Consequently, DX maintains a solid position for cash flow despite the appearance of dramatically lower net interest spreads.
How Does That Work?
Say you have two REITs where one hedges with Treasury Futures and the other uses LIBOR swaps. Assuming Treasury rates and LIBOR changes are comparable, the two REITs should have a similar change in book value.
If rates are rising rapidly, the one using LIBOR swaps will report a lower cost of funds. Over the course of the LIBOR swap, the unrealized gains on the swap will flow through the income statement by reducing the “interest expense”.
However, the REIT that used Treasury Futures still protected their book value just as well. However, as the Treasury Futures are rolled over it would produce realized gains instead of reducing “interest expense.”
On a fundamental basis (change in book value + dividends), DX has been strong compared to most mortgage REITs. Yet it can be confusing for investors who see the plunge in the net interest spread.
Scott Kennedy tackled a question on this recently. Scott wrote:
All agencies have had some (or even all) of their dividends classified as ROC distributions. On DX’s net (short) U.S. Treasuries, they still are receiving notably more cash from their closed trades as opposed to losing money. Per the IRC, they simply have to defer these gains since they’re derivatives. However, technically speaking, their “cash position” has still notably increased. As such, whether it’s classified as a “gain” as opposed to “current period income”, it’s still an increase in cash (to distribute) which answers your question. So, no, they really aren’t “distributing equity capital” via dividends. Technically, they are distributing “hedging cash gains”; even if IRC rules dictate that’s not how REIT taxable income is classified in the current period.
That was before DX declared their December dividend. It’s no surprise DX maintained the current rate:
Seeking Alpha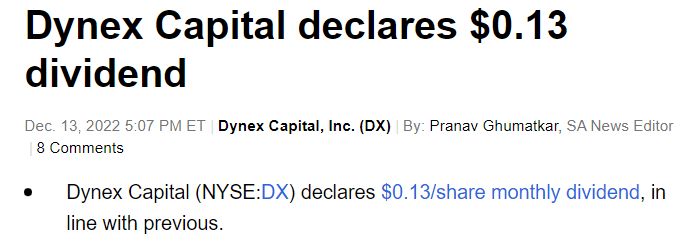
Scott Kennedy was there to provide some quick commentary for readers also:
Quick thoughts. As anticipated/no surprise. I/We continue to anticipate no dividend decrease for DX through, at the least, the first quarter of 2023. This is my/our general sentiment for 2023. Extremely technical reasoning was recently provided to subscribers of the REIT Forum.
As it stands today, DX trades at $13.20. I think that’s a good price. It represents a price-to-book ratio of .87, based on The REIT Forum’s estimate of $15.10 for early December.
I picked up a small position in late November at $12.80. This is still a small weight for me, but I think shares are attractive and may add a bit more to the position.
Using our latest estimates for book value and today’s share prices, DX trades at a larger discount to projected book value than any of the other agency mortgage REITs.
Protecting Book Value
Dynex Capital did a better job of protecting book value than the vast majority of their peers. Even compared to simple bond funds without leverage, DX outperformed:
DX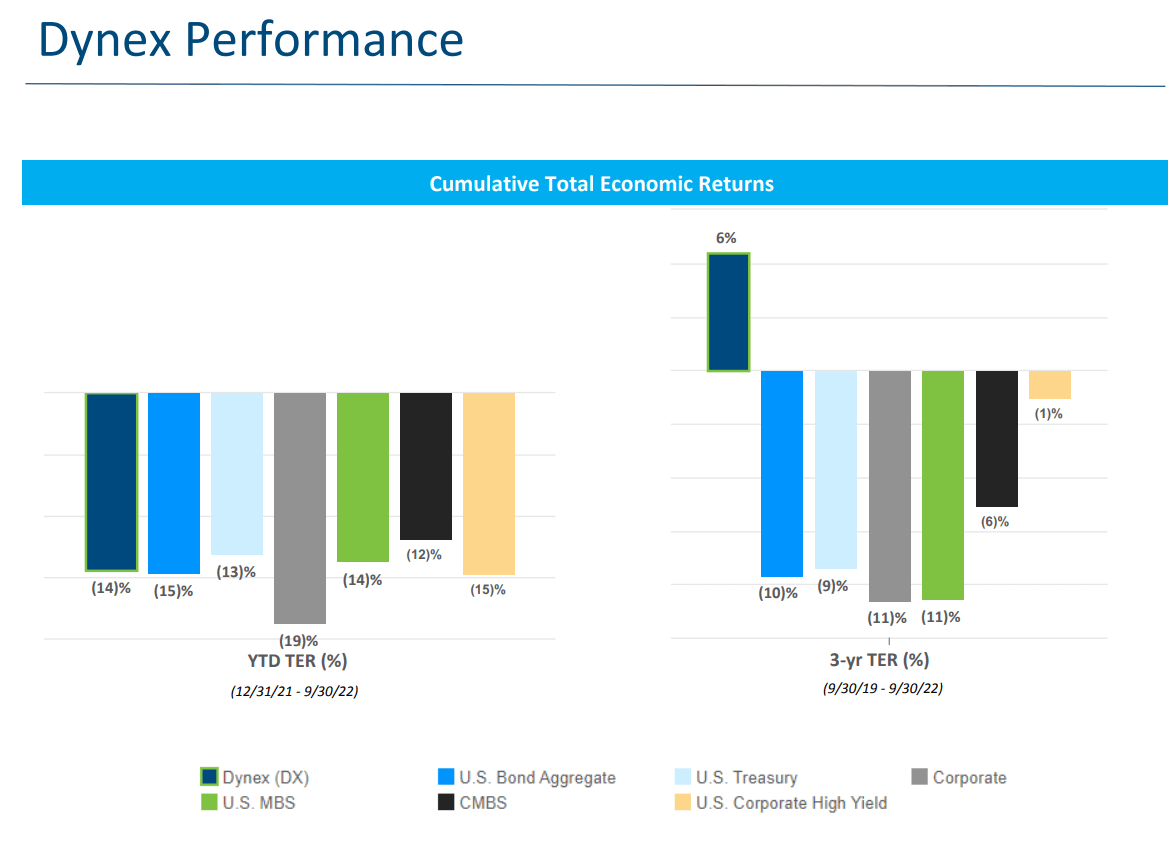
This was an extremely hard period for bond investors, especially leveraged bond investors. That makes the relative performance for DX stand out.
The recent hit to book value came from a dramatic widening of spreads between MBS and Treasury rates:
DX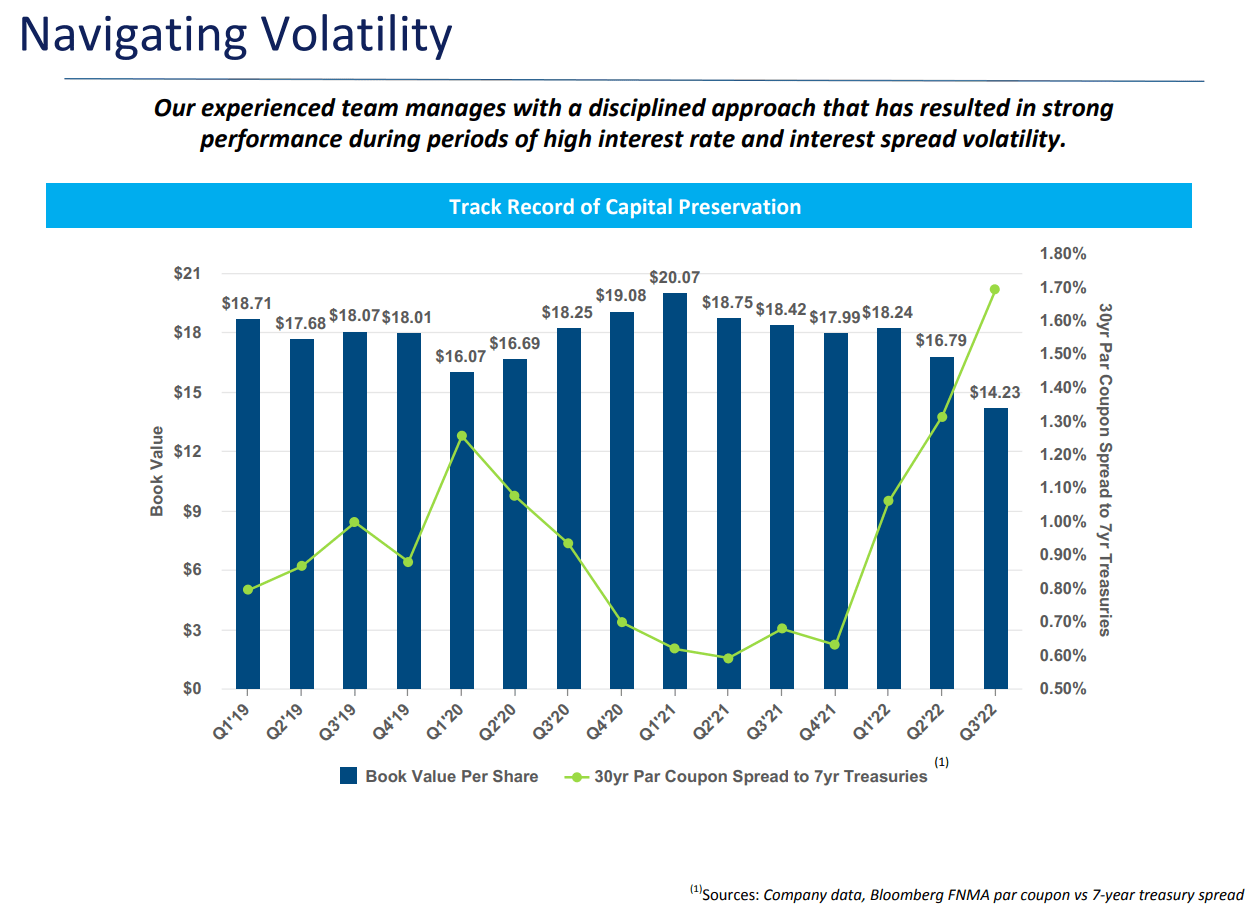
As the Treasury and MBS rates move closer together (which already started happening), it can be a powerful tailwind for book value. The ideal time to be adding some leverage is when these spreads are wide. They were exceptionally wide at the end of Q3 2022, so it was the right time to be increasing leverage.
This is when the odds for book value to recover are better. Yet despite book value already being lower from wider spreads, the market price is even lower. That’s a good deal.
Stock Table
We will close out the rest of the article with the tables and charts we provide for readers to help them track the sector for both common shares and preferred shares.
We’re including a quick table for the common shares that will be shown in our tables:
Let the images begin!
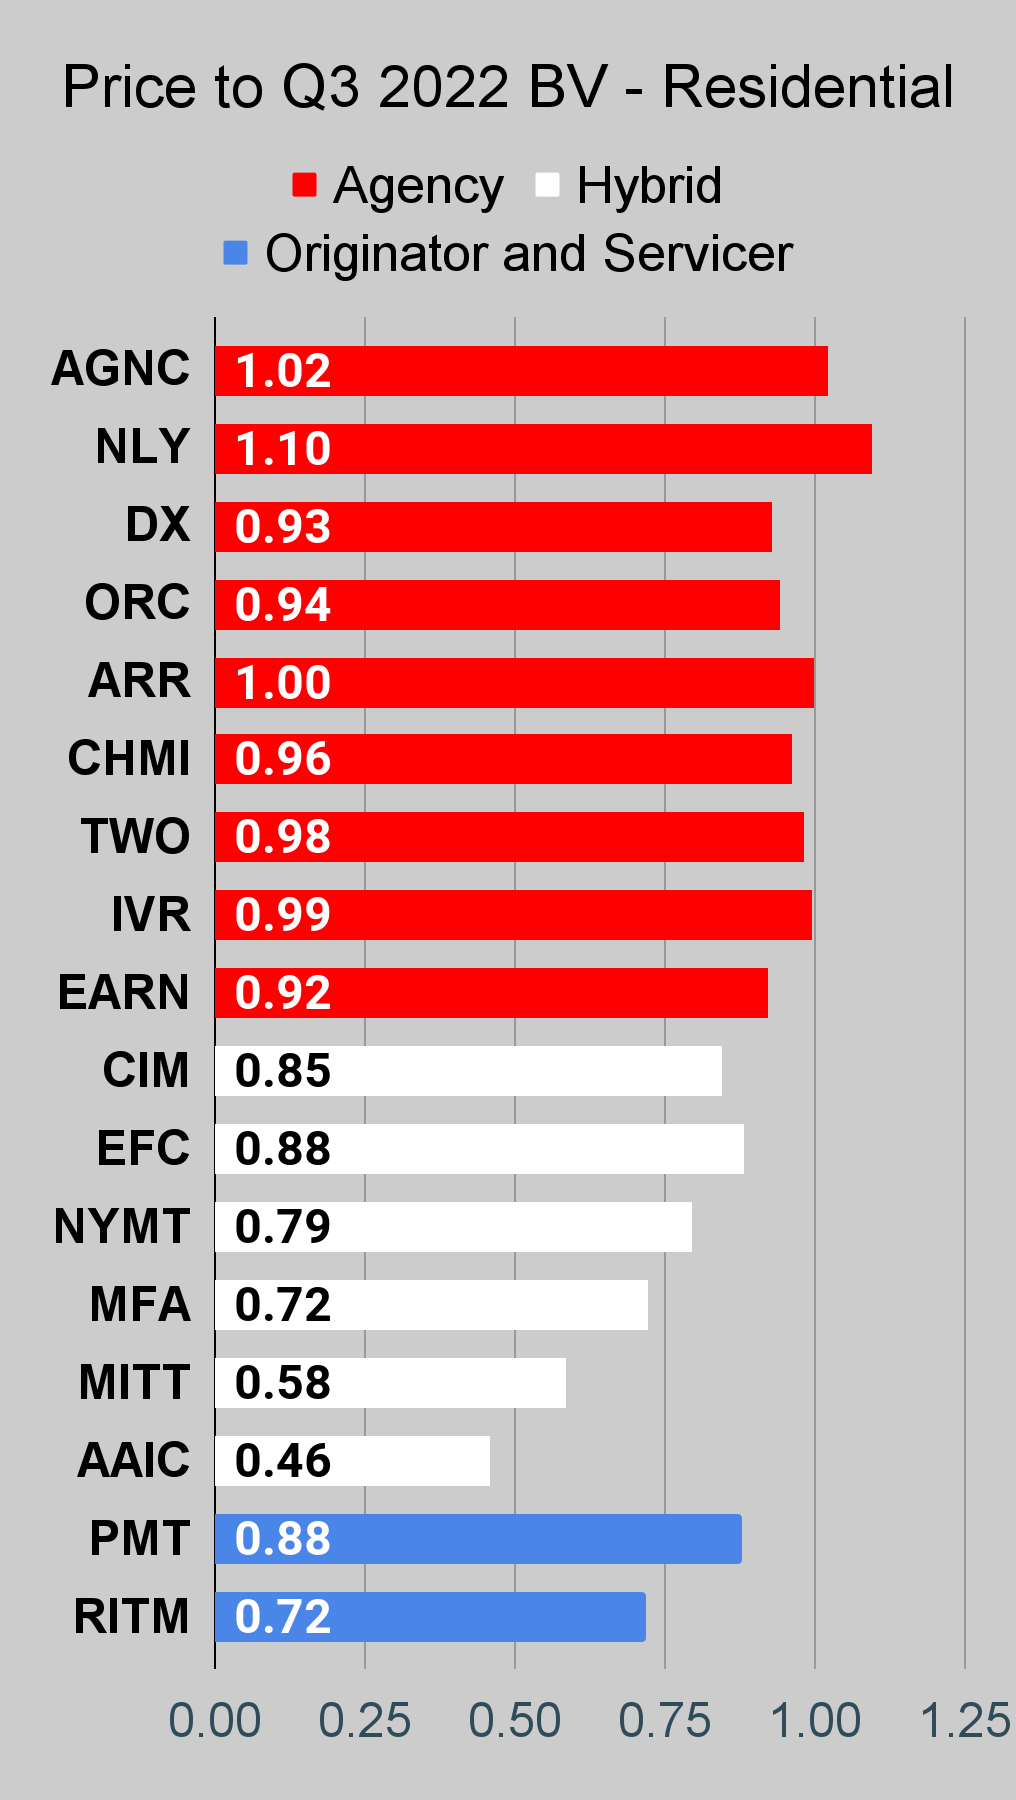
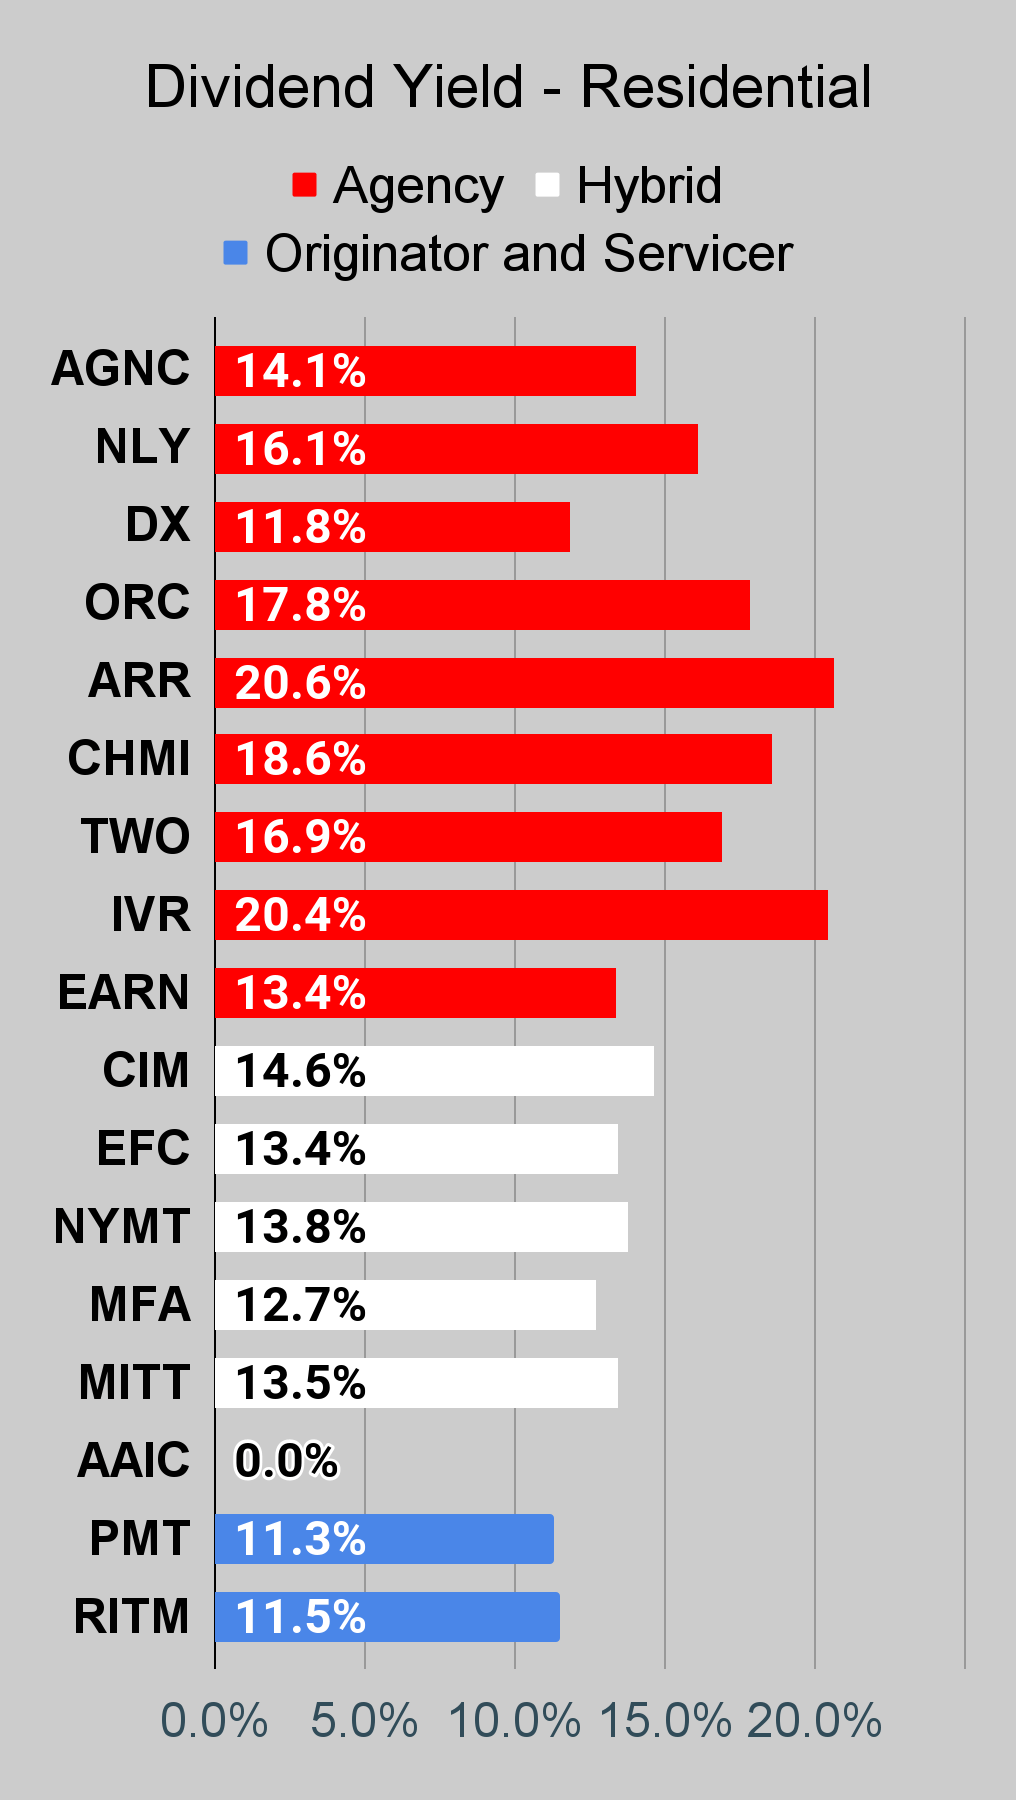
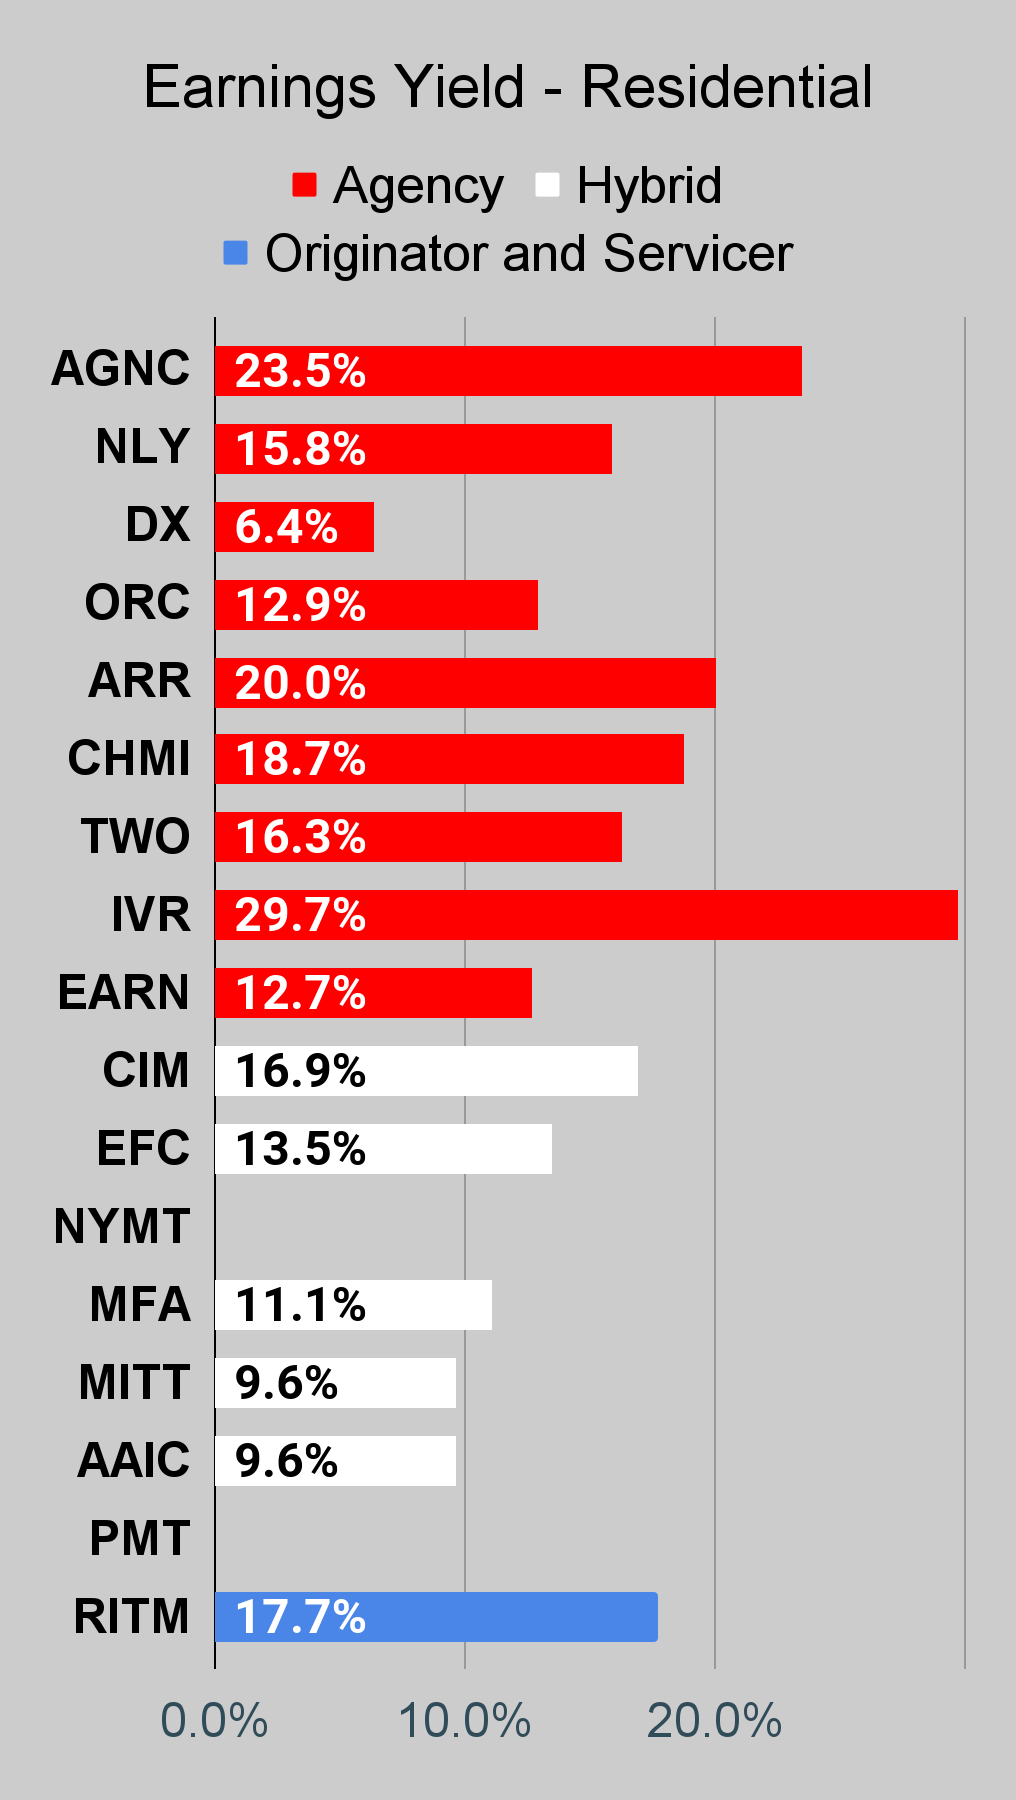
Residential Mortgage REIT Charts
Note: The chart for our public articles uses the book value per share from the latest earnings release. Current estimated book value per share is used in reaching our targets and trading decisions. It is available in our service, but those estimates are not included in the charts below. PMT and NYMT are not showing an earnings yield metric as neither REIT provides a quarterly “Core EPS” metric.
 The REIT Forum |
 The REIT Forum |
 The REIT Forum |
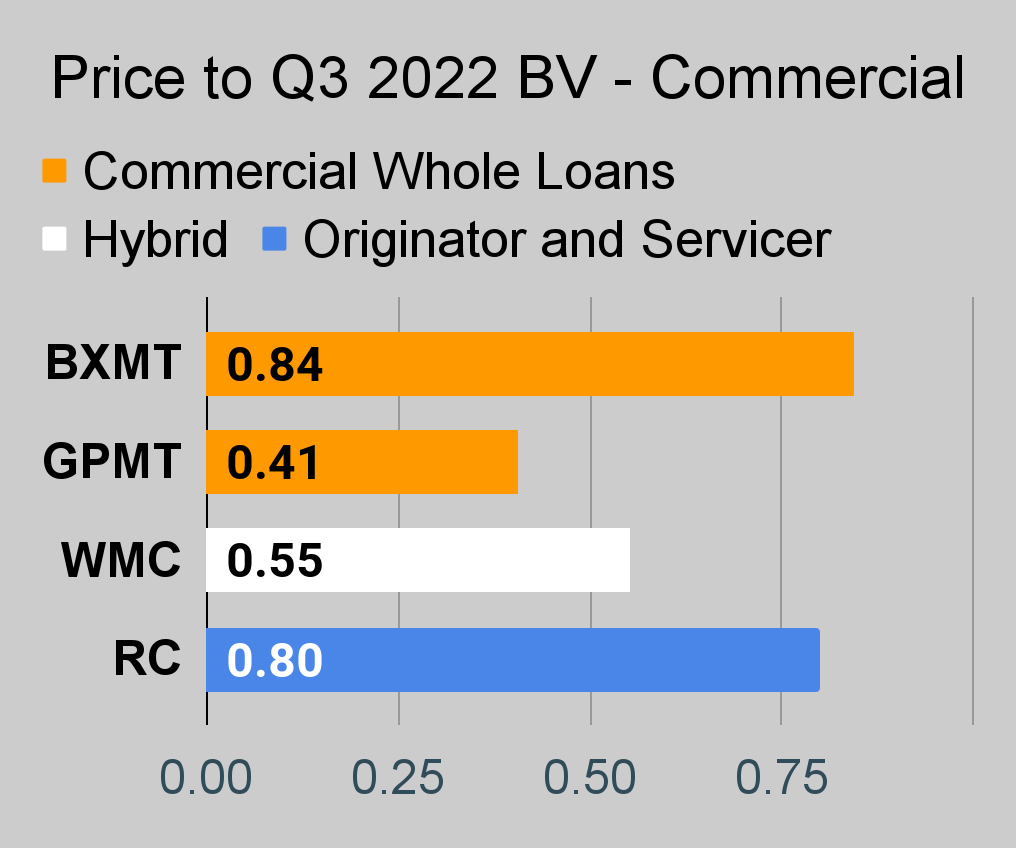
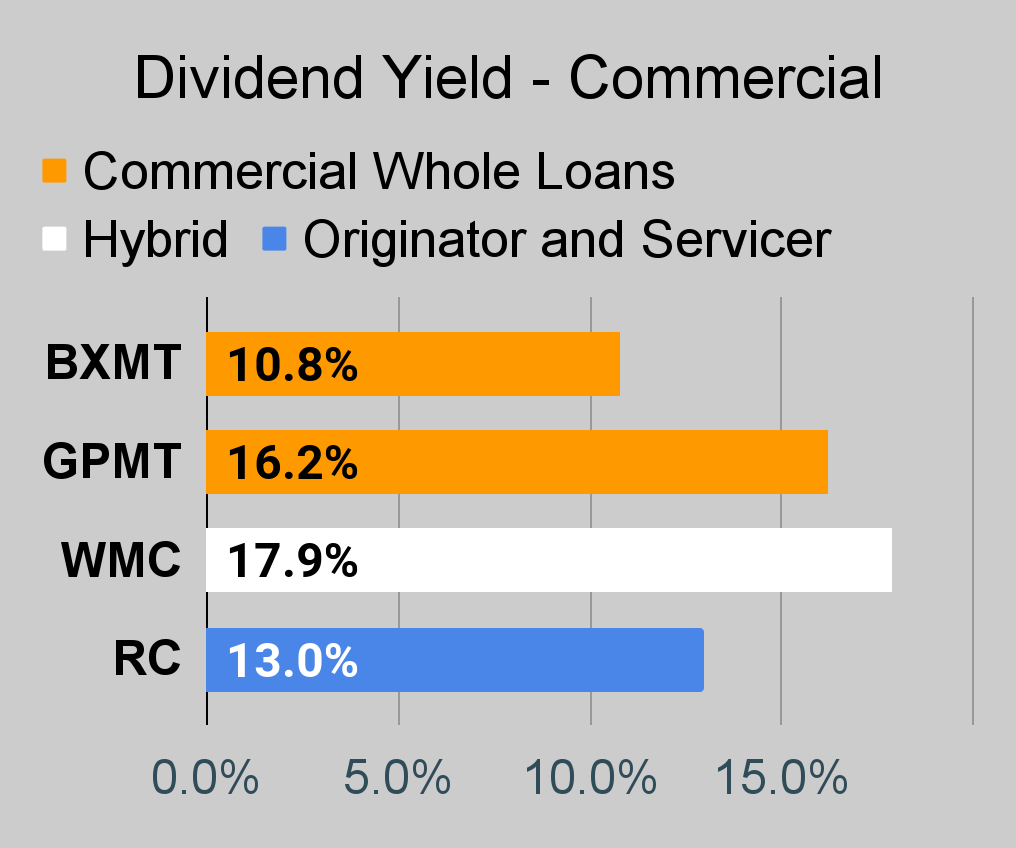
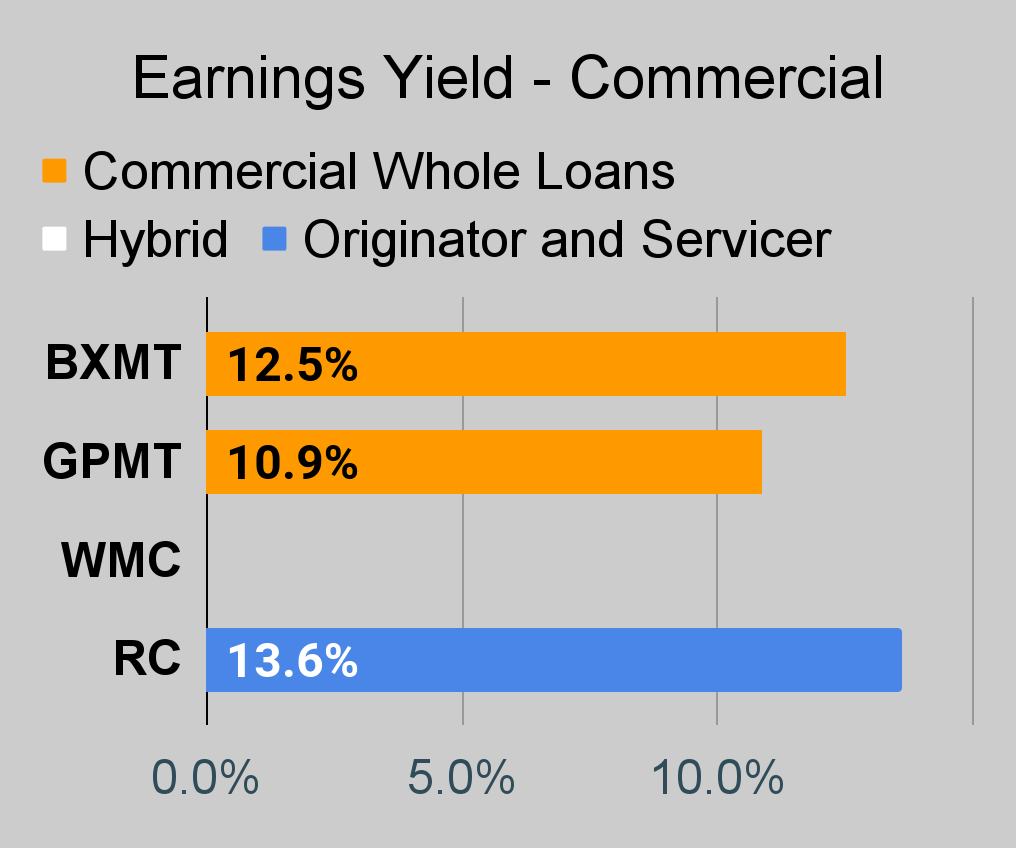
Commercial Mortgage REIT Charts
 The REIT Forum |
 The REIT Forum |
 The REIT Forum |
BDC Charts
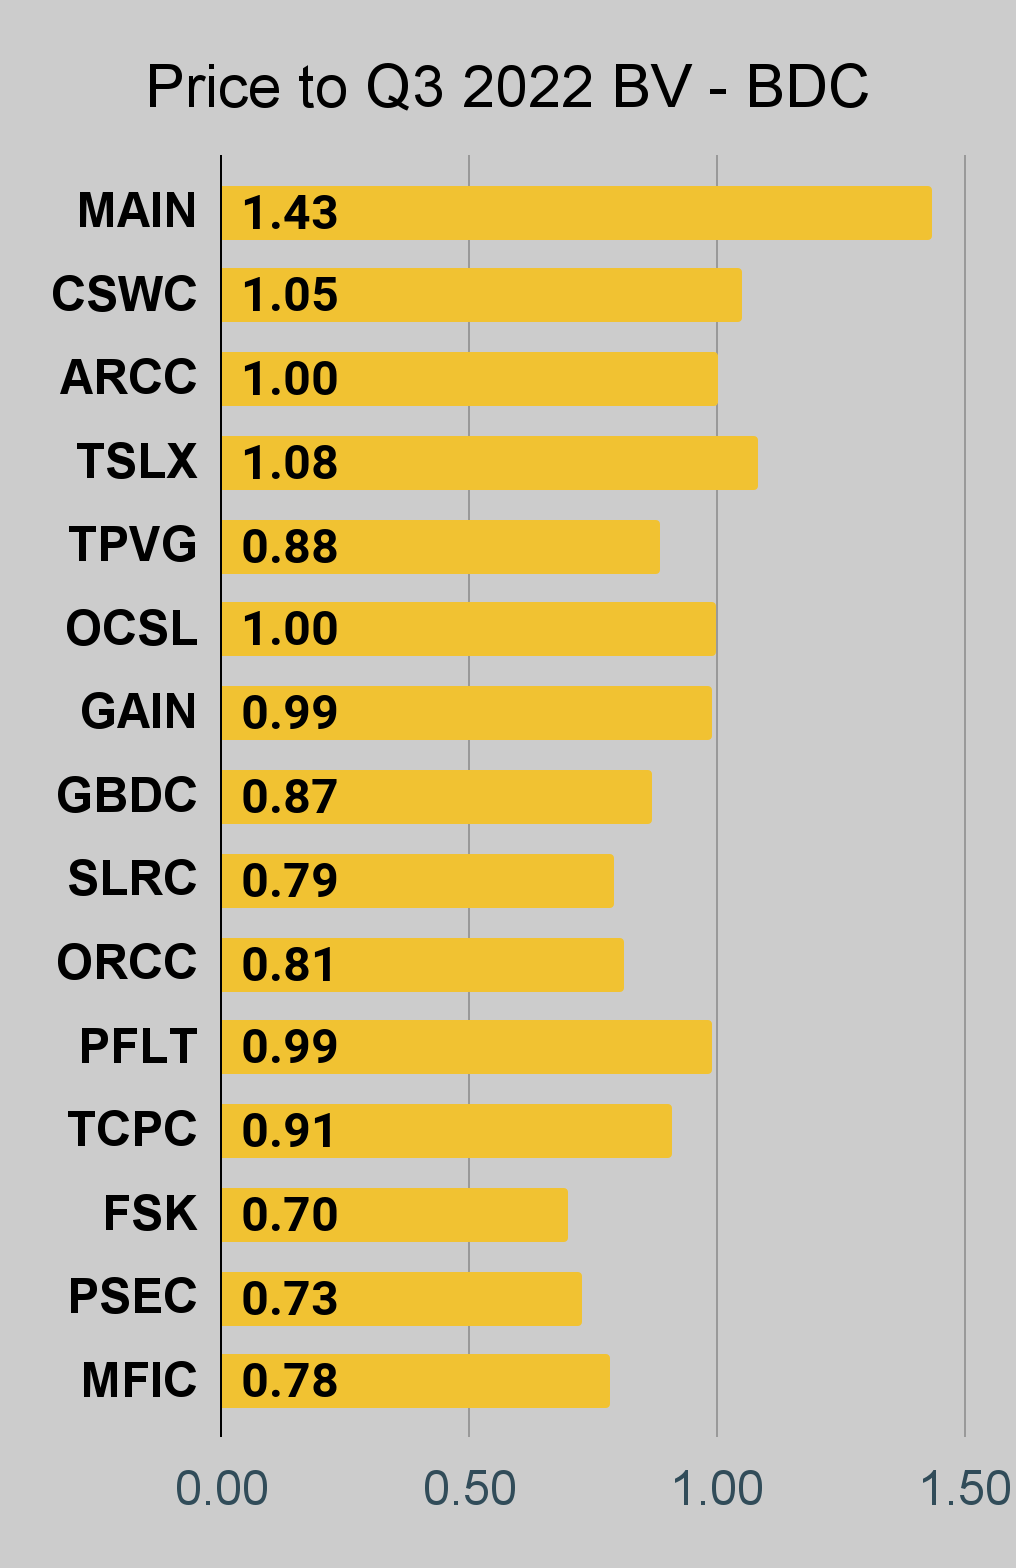 The REIT Forum |
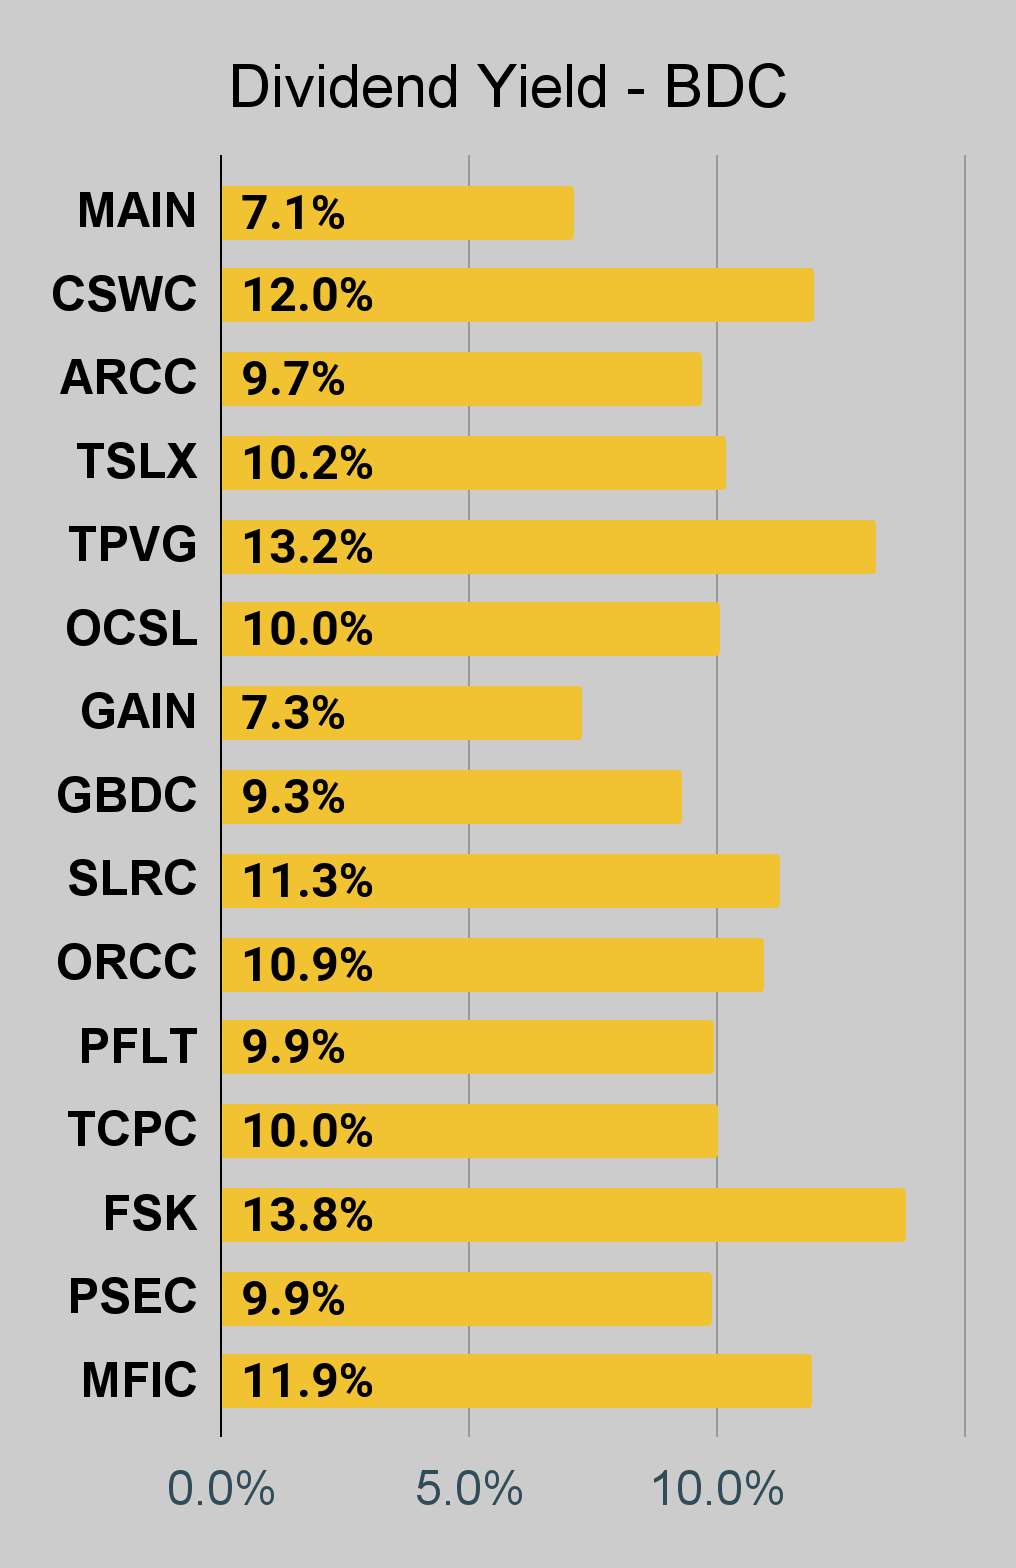 The REIT Forum |
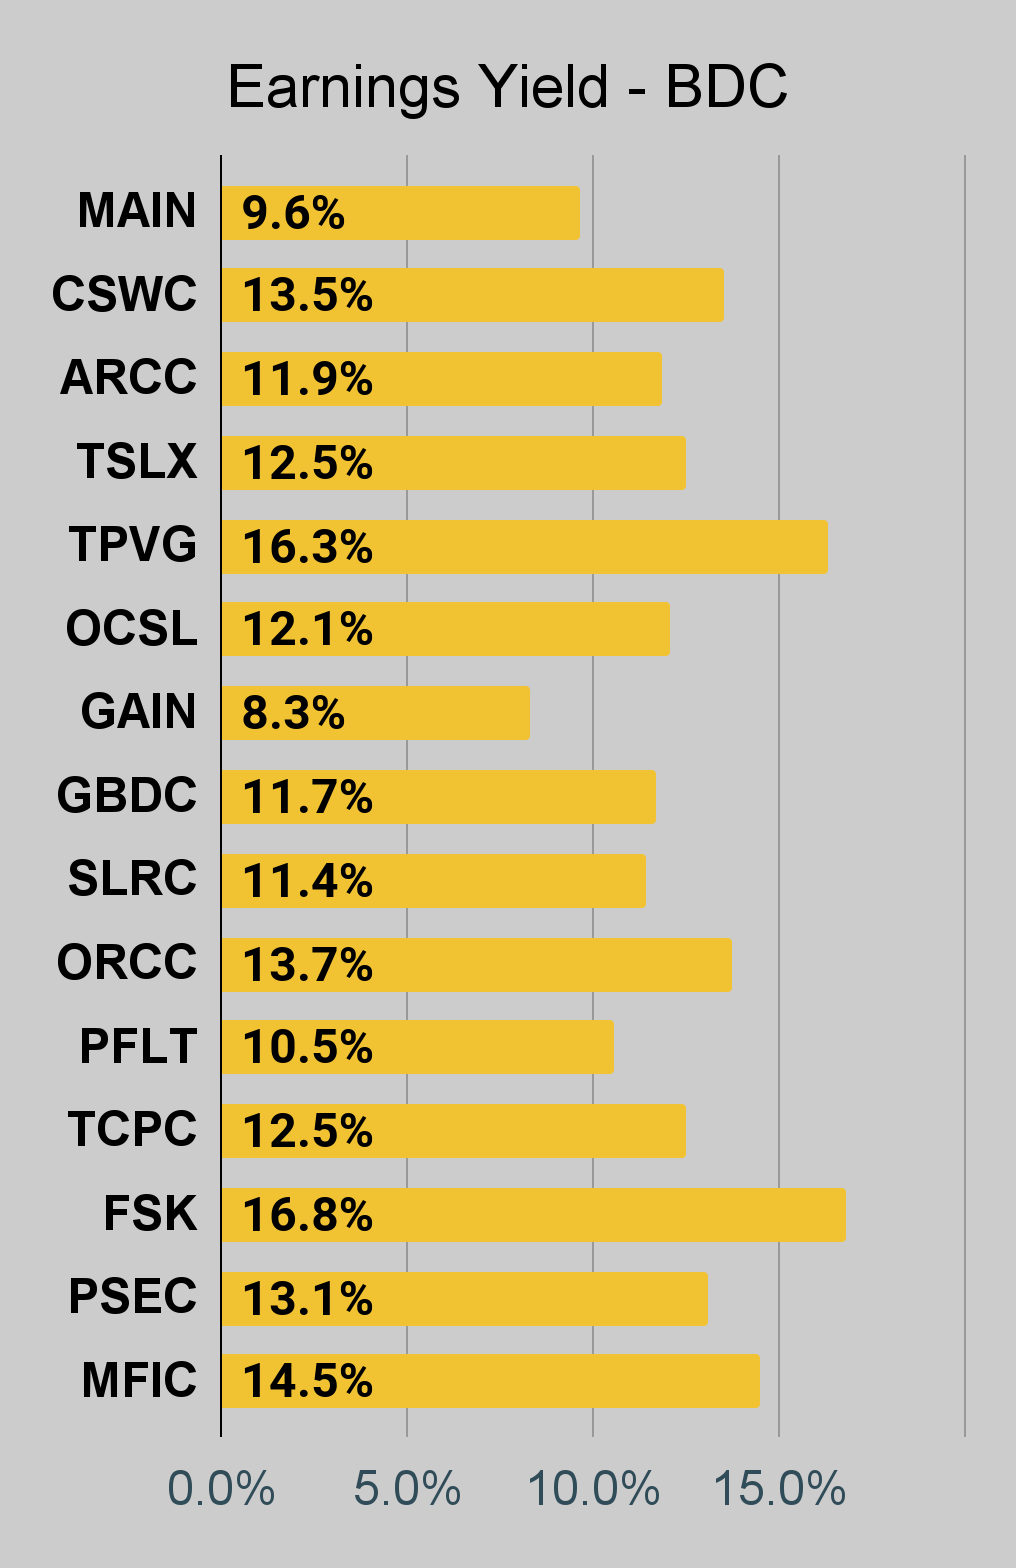 The REIT Forum |
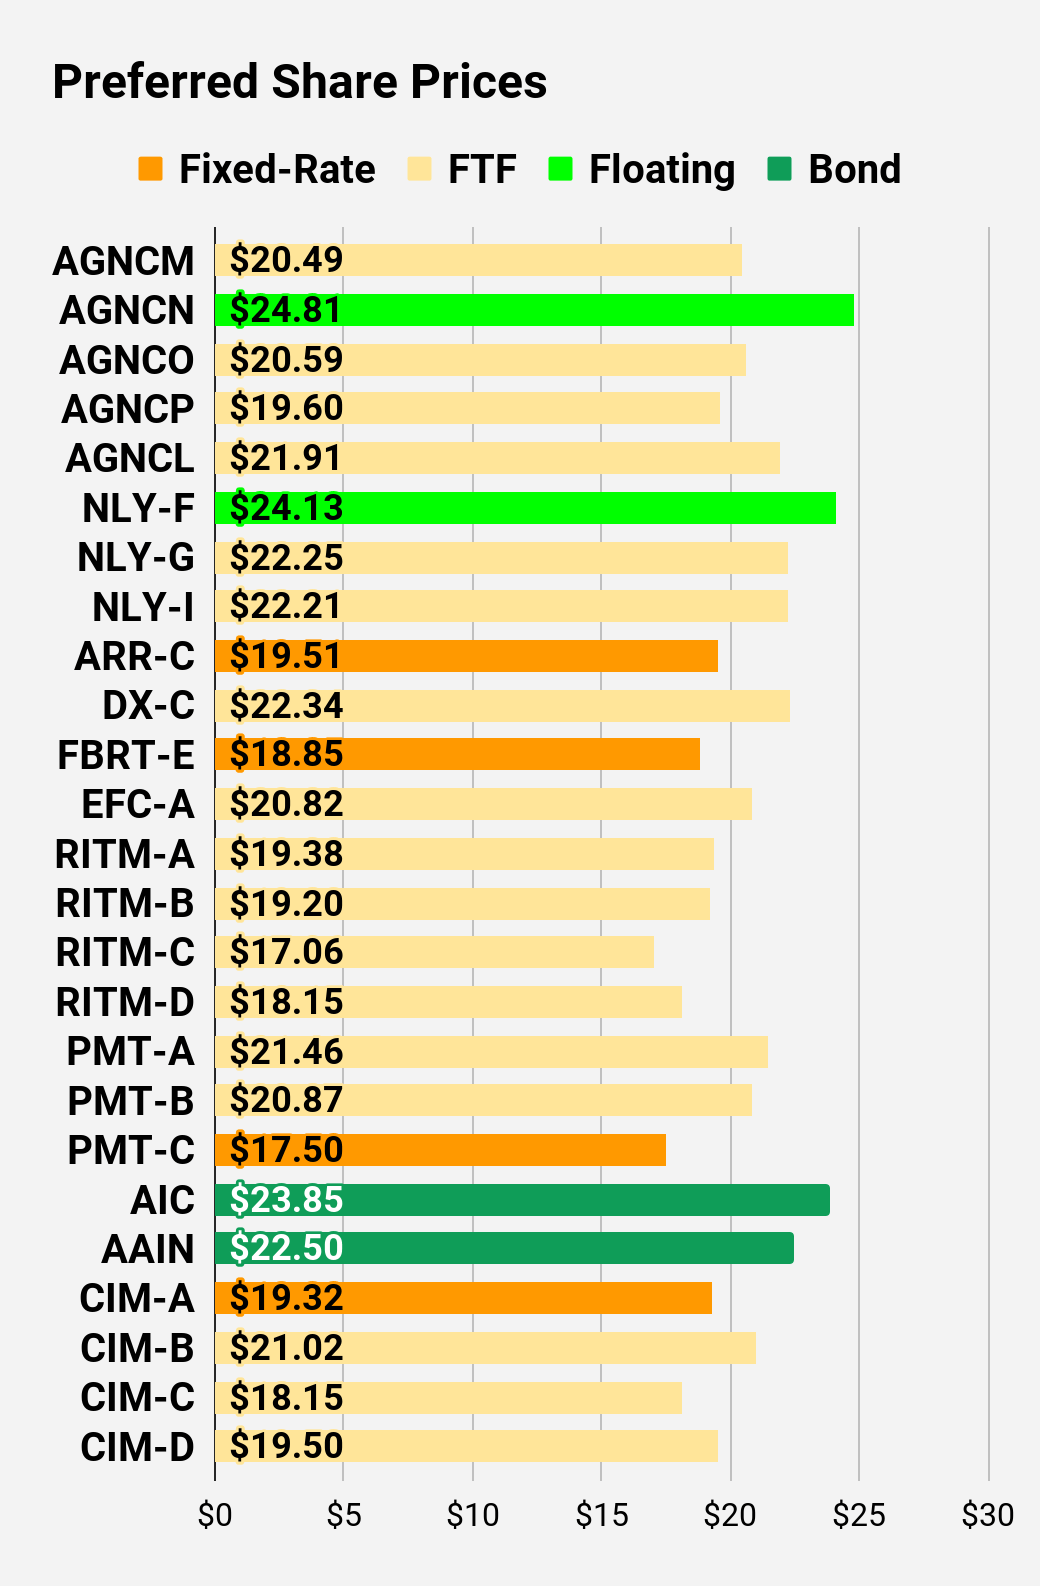
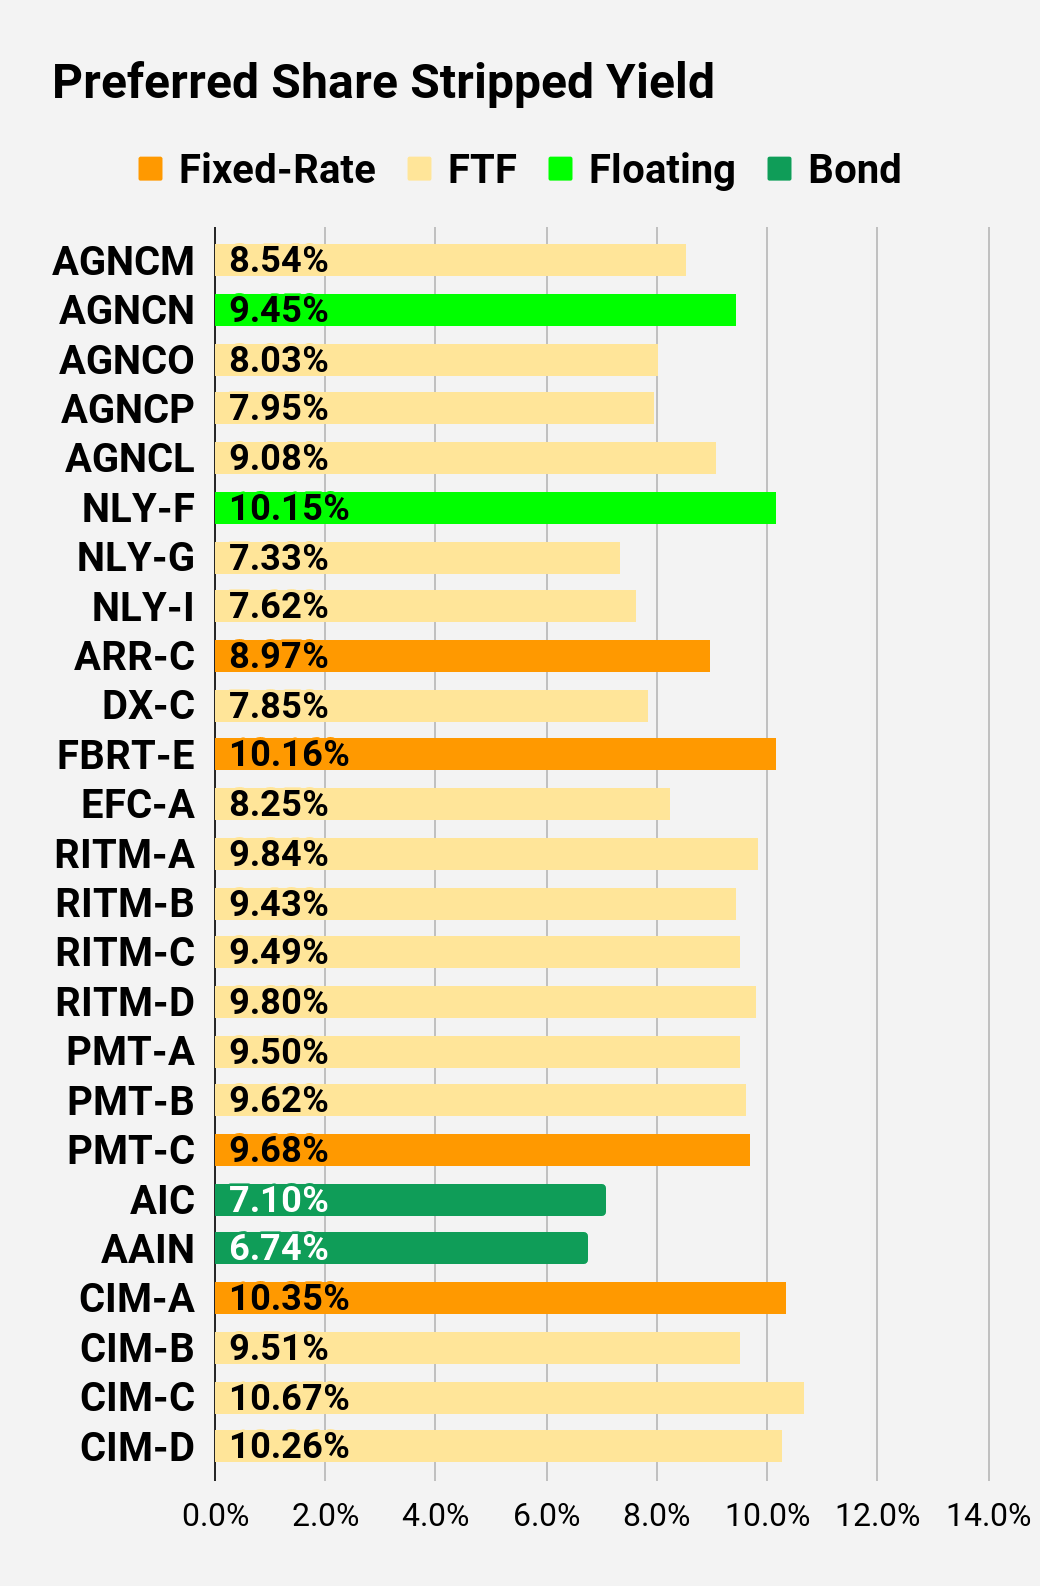
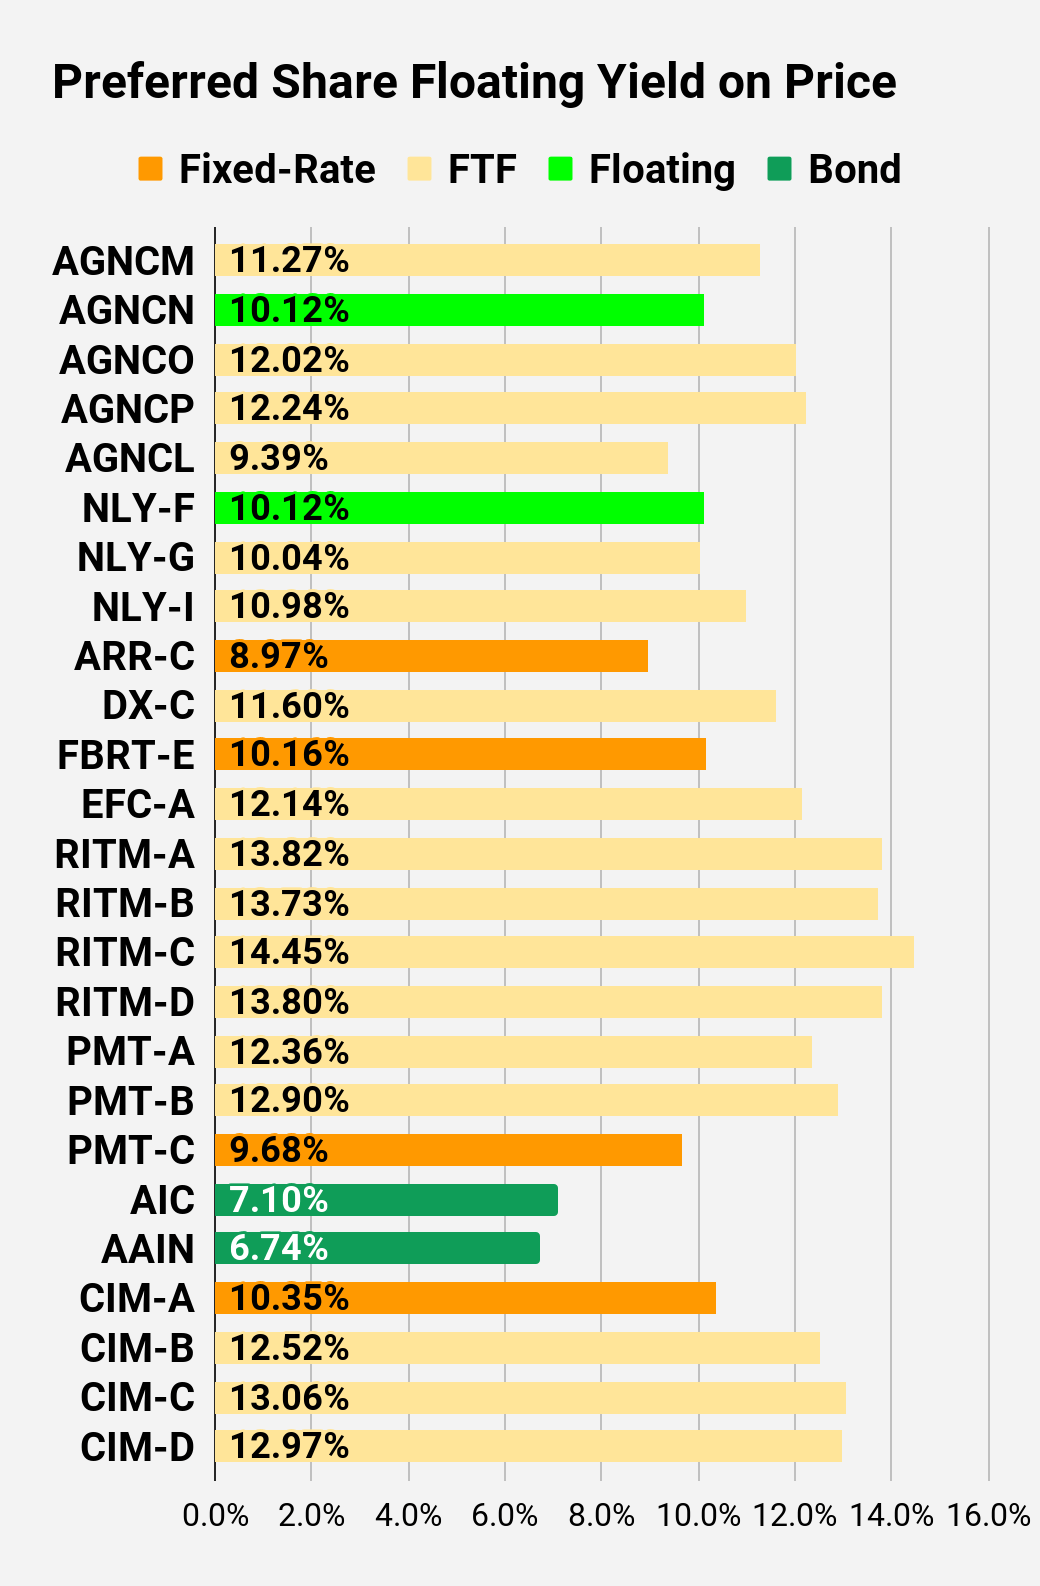
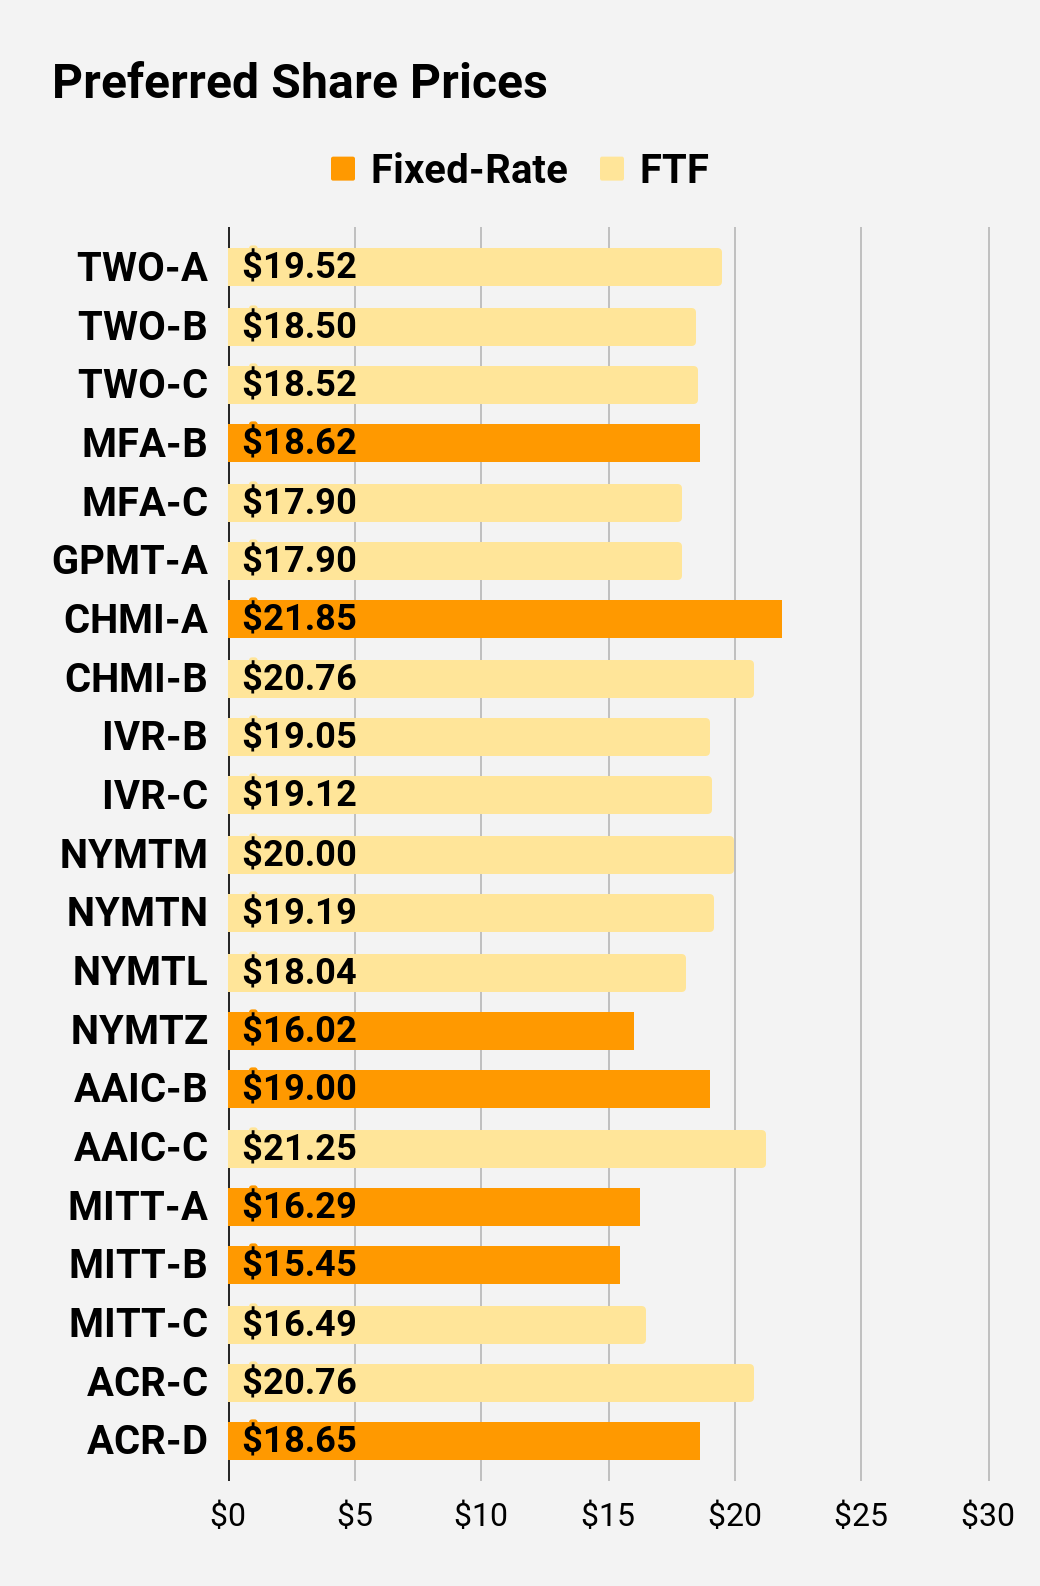
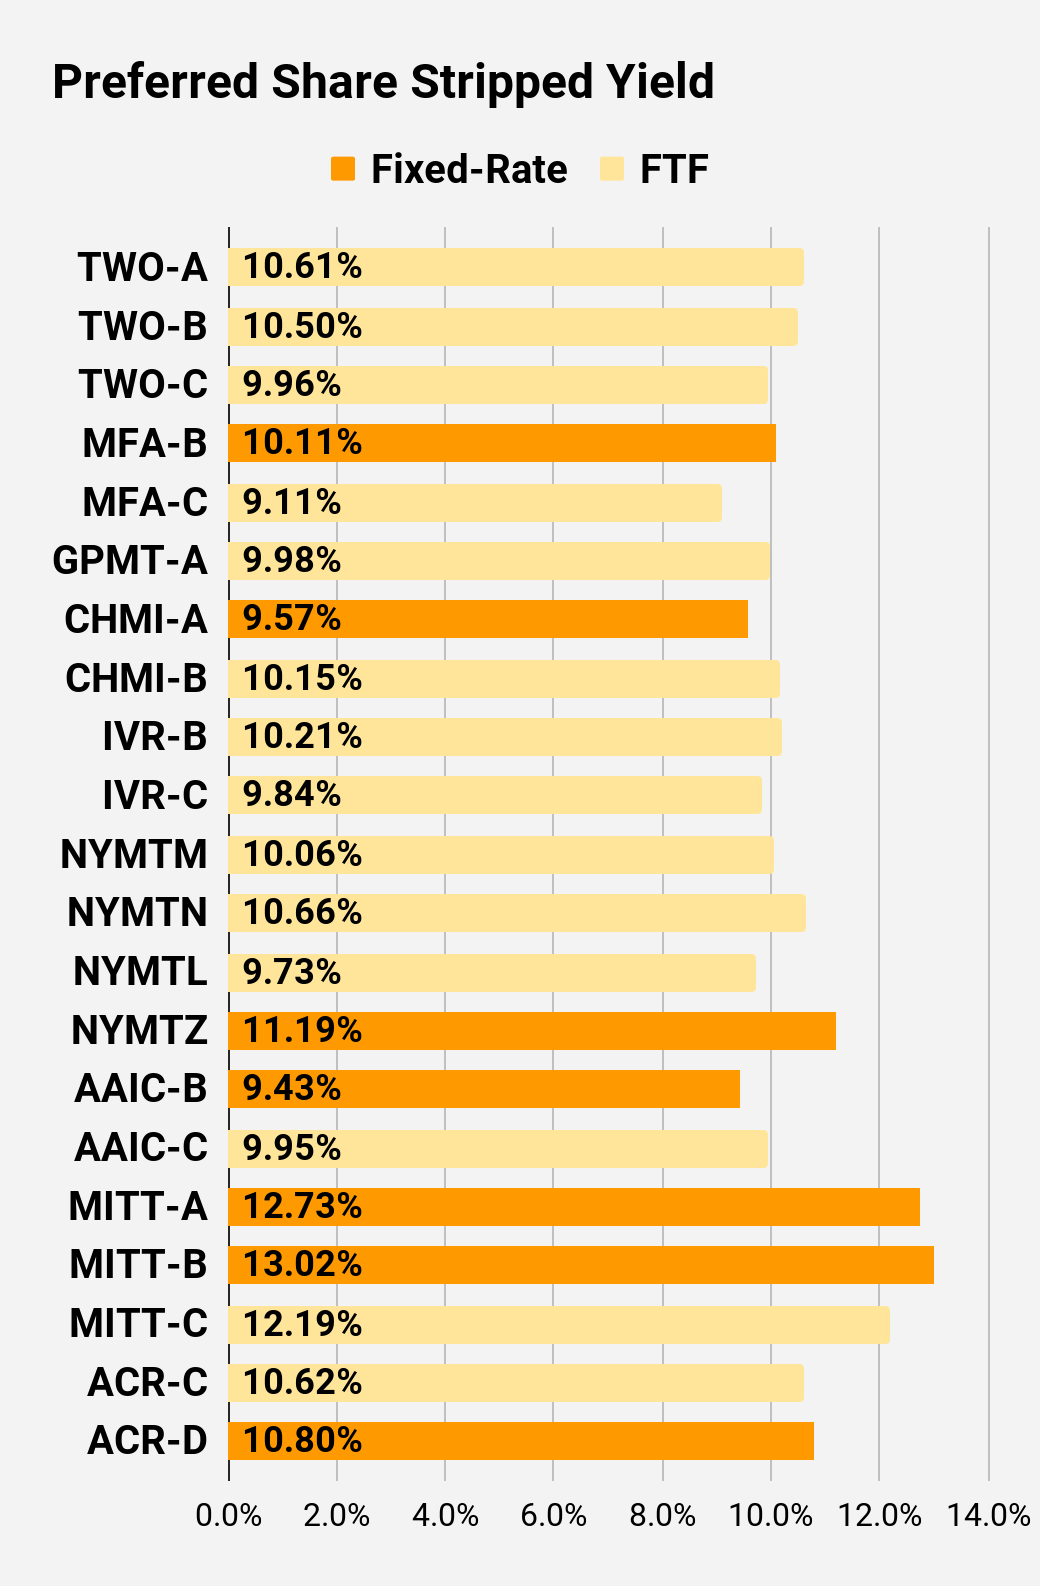
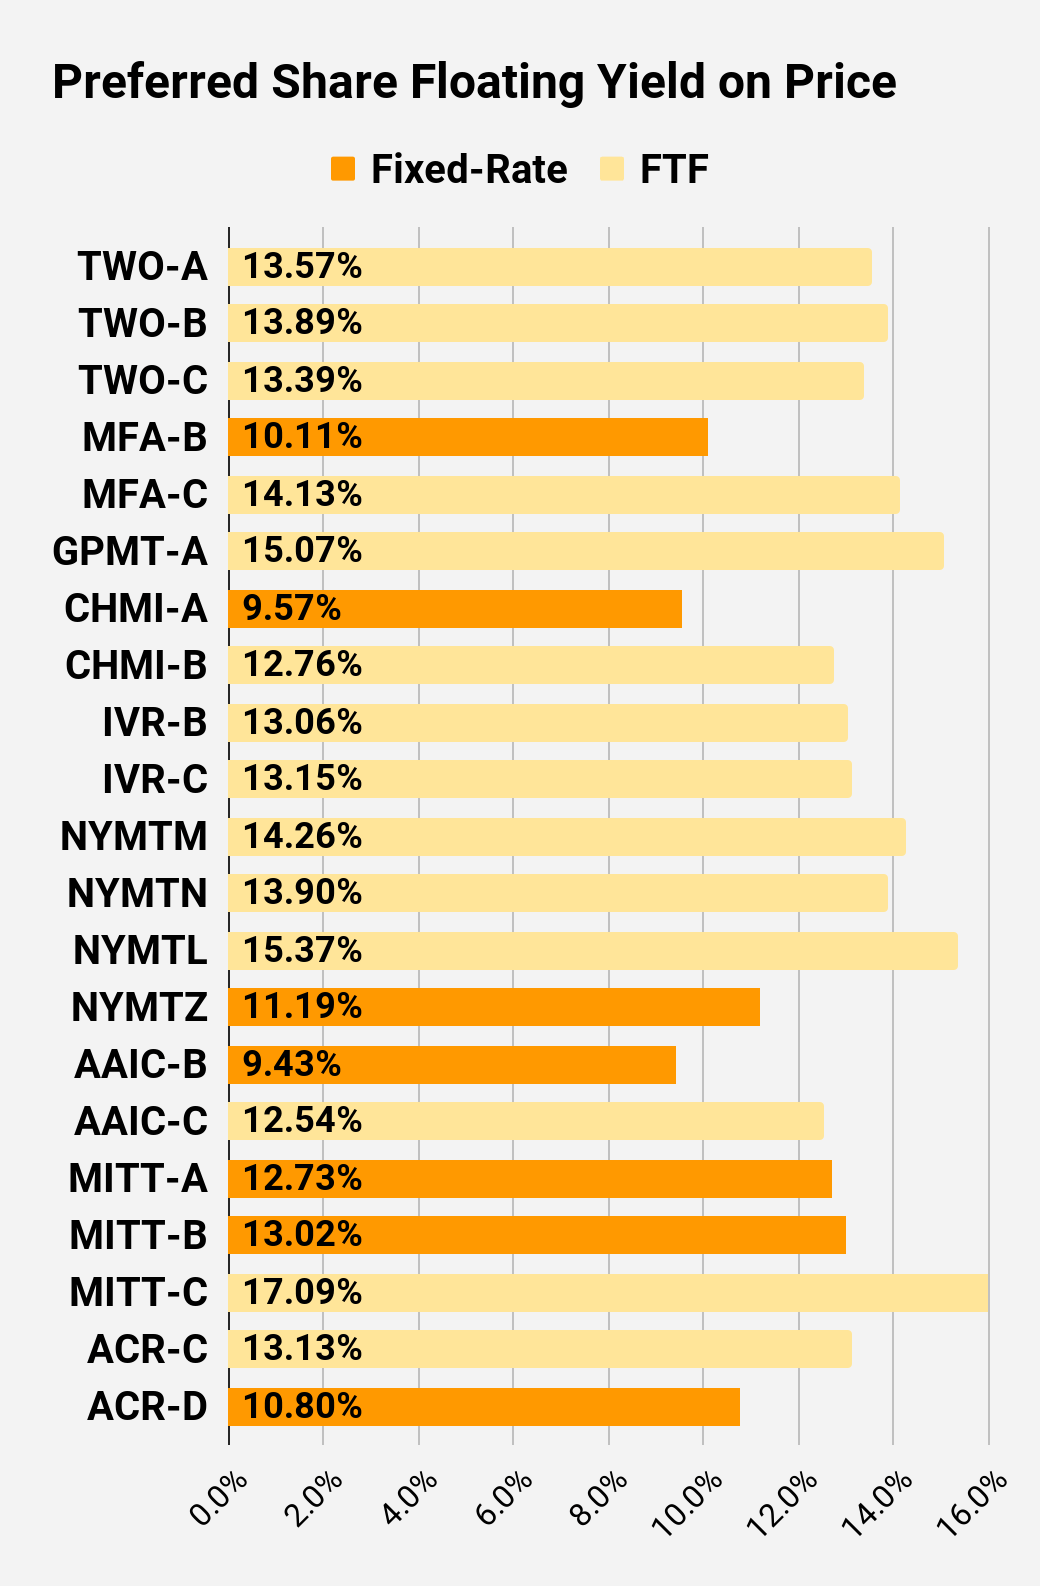
Preferred Share Charts
I changed the coloring a bit. We needed to adjust to include that the first fixed-to-floating shares have transitioned over to floating rates. When a share is already floating, the stripped yield may be different from the “Floating Yield on Price” due to changes in interest rates. For instance, NLY-F already has a floating rate. However, the rate is only reset once per 3 months. The stripped yield is calculated using the upcoming projected dividend payment and the “Floating Yield on Price” is based on where the dividend would be if the rate reset today. In my opinion, for these shares the “Floating Yield on Price” is clearly the more important metric.
 The REIT Forum |
 The REIT Forum |
 The REIT Forum |
 The REIT Forum |
 The REIT Forum |
 The REIT Forum |
Preferred Share Data
Beyond the charts, we’re also providing our readers with access to several other metrics for the preferred shares.
After testing out a series on preferred shares, we decided to try merging it into the series on common shares. After all, we are still talking about positions in mortgage REITs. We don’t have any desire to cover preferred shares without cumulative dividends, so any preferred shares you see in our column will have cumulative dividends. You can verify that by using Quantum Online. We’ve included the links in the table below.
To better organize the table, we needed to abbreviate column names as follows:
- Price = Recent Share Price – Shown in Charts
- BoF = Bond or FTF (Fixed-to-Floating)
- S-Yield = Stripped Yield – Shown in Charts
- Coupon = Initial Fixed-Rate Coupon
- FYoP = Floating Yield on Price – Shown in Charts
- NCD = Next Call Date (the soonest shares could be called)
- Note: For all FTF issues, the floating rate would start on NCD.
- WCC = Worst Cash to Call (lowest net cash return possible from a call)
- QO Link = Link to Quantum Online Page
Second Batch:
Strategy
Our goal is to maximize total returns. We achieve those most effectively by including “trading” strategies. We regularly trade positions in the mortgage REIT common shares and BDCs because:
- Prices are inefficient.
- Long-term, share prices generally revolve around book value.
- Short-term, price-to-book ratios can deviate materially.
- Book value isn’t the only step in analysis, but it is the cornerstone.
We also allocate to preferred shares and equity REITs. We encourage buy-and-hold investors to consider using more preferred shares and equity REITs.
Performance
We compare our performance against 4 exchange-traded funds (“ETFs”) that investors might use for exposure to our sectors:
The REIT Forum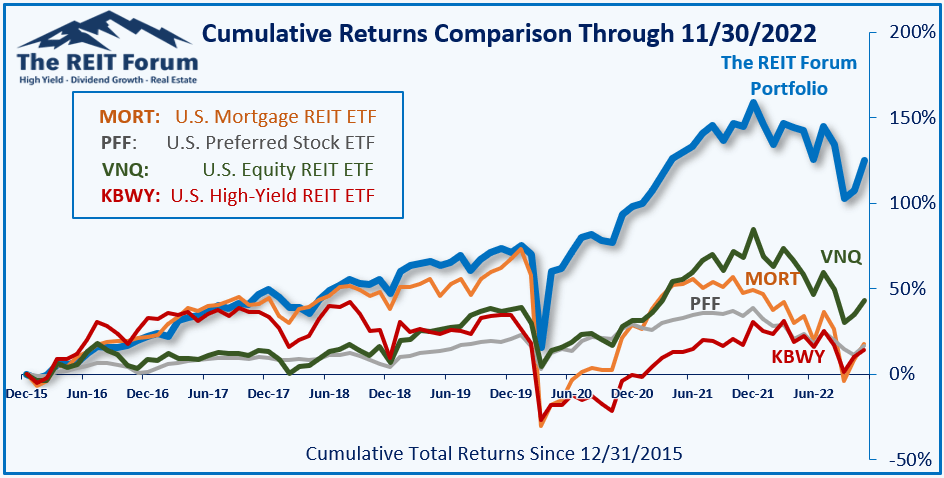
The 4 ETFs we use for comparison are:
|
Ticker |
Exposure |
|
One of the largest mortgage REIT ETFs |
|
|
One of the largest preferred share ETFs |
|
|
Largest equity REIT ETF |
|
|
The high-yield equity REIT ETF. Yes, it has been dreadful. |
When investors think it isn’t possible to earn solid returns in preferred shares or mortgage REITs, we politely disagree. The sector has plenty of opportunities, but investors still need to be wary of the risks. We can’t simply reach for yield and hope for the best. When it comes to common shares, we need to be even more vigilant to protect our principal by regularly watching prices and updating estimates for book value and price targets.
Ratings: Bullish on DX.
Be the first to comment