

hapabapa
It’s been a much better earnings season for the restaurant industry, with several names priced attractively heading into earnings which have led to strong performances the past two months. Some examples include Restaurant Brands International (QSR), Domino’s Pizza (DPZ), and Yum Brands (YUM), which also happen to be trade-down beneficiaries. However, the performance has been much weaker from names like Dutch Bros (NYSE:BROS) and Kura Sushi (KRUS), which were priced much less attractively heading into earnings season. In fact, Dutch Bros was trading at over 45x FY2025 earnings estimates as of mid-August, where it’s underperformed its peer group by over 2000 basis points.
Dutch Bros – Menu Offerings (Company Website)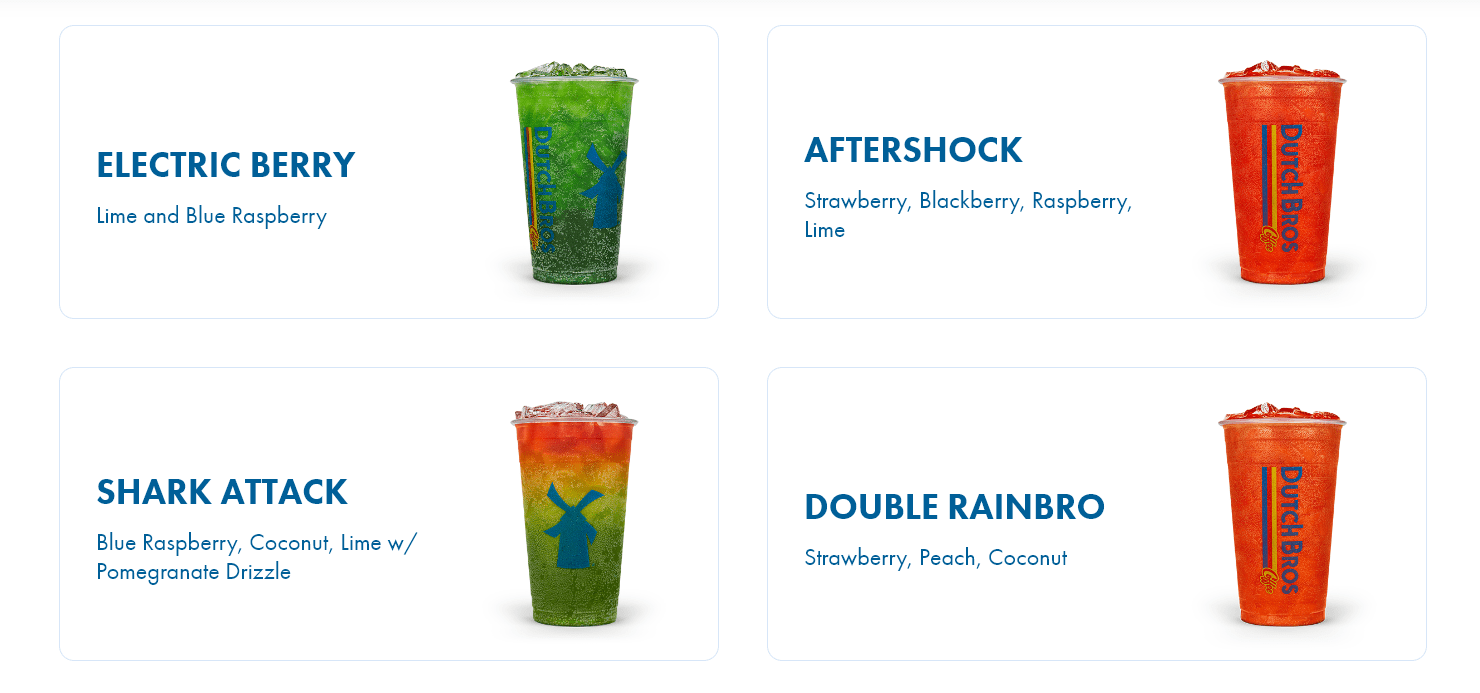
Fortunately, Dutch Bros put together a decent Q3 report, reporting a record number of new shop openings and positive same-shop sales growth despite difficult year-over-year comps. That said, this violent post-earnings rally (similar to Q2) has once again left the stock nearly fully valued, with the industry still not out of the woods from a traffic standpoint. So, while Dutch Bros might be an unrivaled growth story in the Retail Sector (XRT) that shows it has a very large group of loyal customers that will support it, I don’t see any way to justify chasing the stock here near $38.00.
Q3 Results
Dutch Bros released its Q3 results this week and beat estimates by reporting revenue of $198.6 million, a 2% beat vs. estimates (~$194.0 million), which translated to a 53% increase year-over-year. This beat was not driven by traffic or favorable mix but instead helped by the pricing of ~9.1% in the period and record new shop growth, with 38 new shops opened in Q3 alone. The rapid pace of unit growth has placed Dutch Bros on track to meet its goal of 800 stores at some point next year, and the company noted that it expects to see an acceleration in new openings next year, targeting 150 new shop openings vs. 130 planned for FY2022.
Dutch Bros – Quarterly Revenue (Company Filings, Author’s Chart)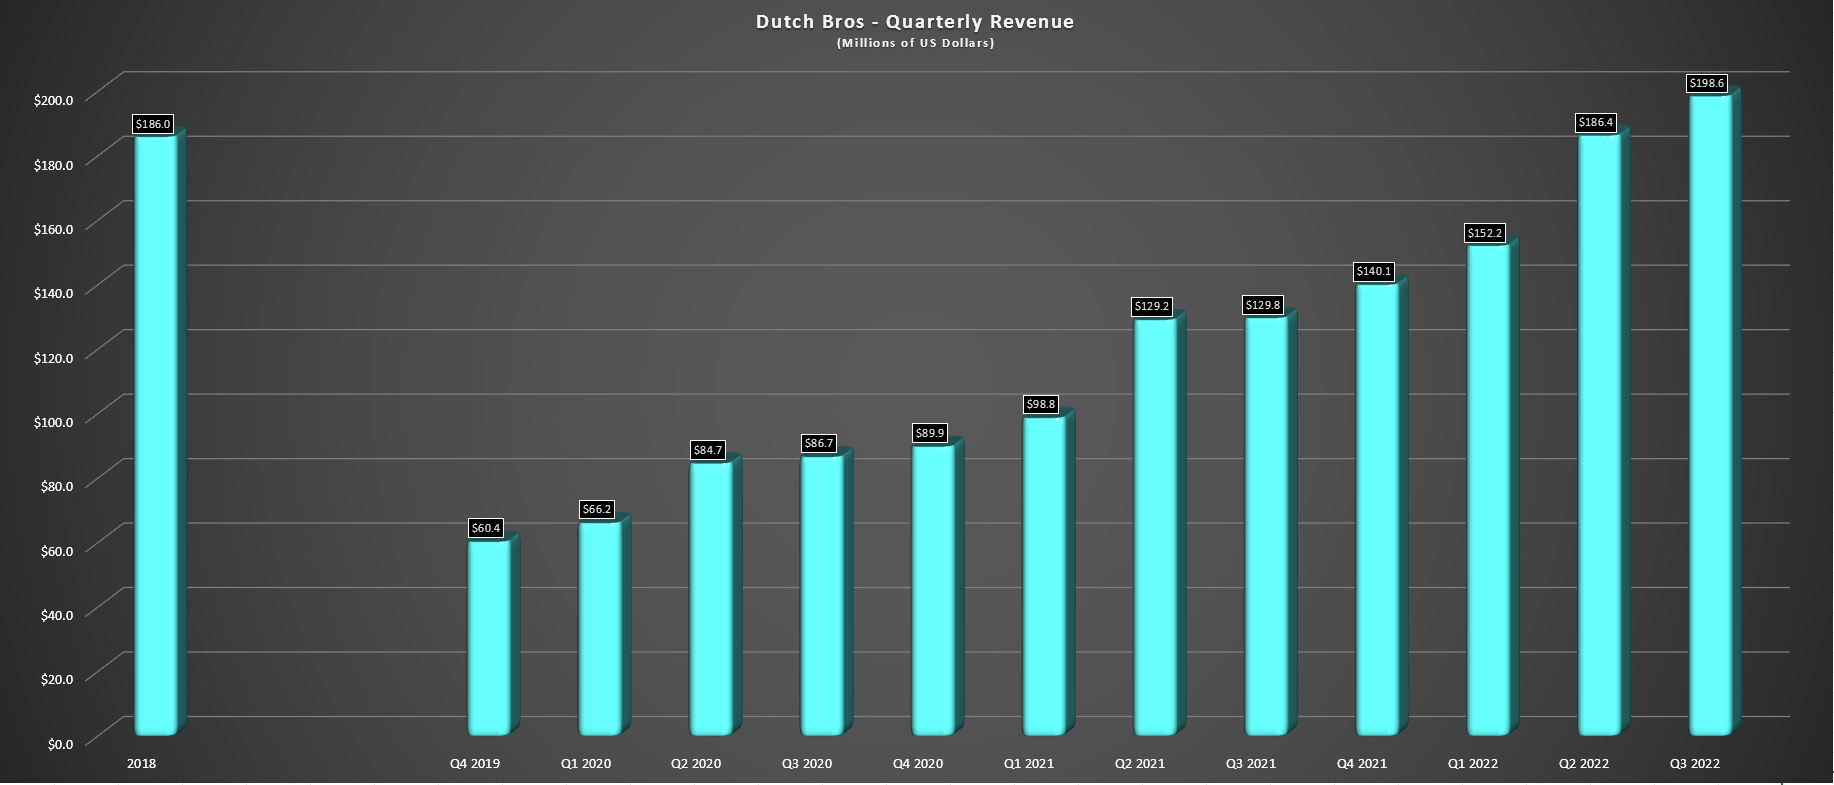
Digging into the results a little closer, Dutch Bros saw the bulk of its revenue growth from company-owned sales, which increased by 60% due to significant growth in company-owned shops (336 vs. 207) and mildly positive same-shop sales growth. Meanwhile, franchise and other revenue increased 20% year-over-year to $25.1 million. The company noted that its same-shop sales were up 1.7% in the period, which certainly pales in comparison to last year’s growth figures, but this can be attributed to the more challenging economic environment that has weighed on traffic and the difficult year-over-year comps (7.3% same-shop sales in the year-ago period).
If we put this same-shop sales figure in context against lapping tough comps, the same-shop sales weren’t bad, though they materially trailed pricing. That being said, Dutch Bros did share several positives, which were as follows:
- it is fully staffed, and shop/manager turnover is below the industry average
- its Oceanside shop in San Diego enjoyed $630k in sales in its first month
- average unit volumes have ticked higher, coming in at $1.92 million
- the company continues to expect at or above-average AUV from new shops
- its labor costs were down sharply as a percentage of sales year-over-year
- its 90-day active app users jumped 300k to 2.9 million sequentially
Average Unit Volumes TTM Basis (Company Presentation)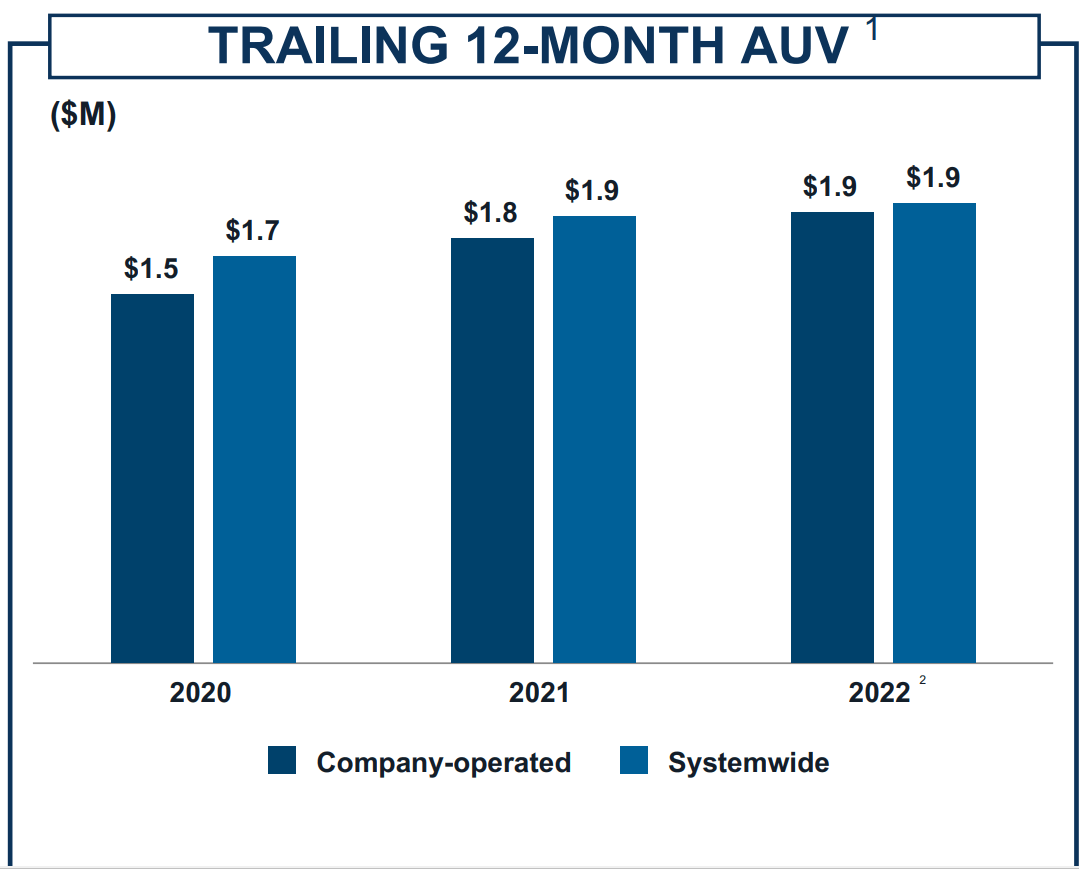
Overall, these points are very encouraging, as is the fact that the company is on a roll with unit growth, posting its fifth consecutive quarter of at least 30 new shop openings. In fact, the company now appears to be in a great position to be sitting well over 800 shops by the end of next year, with considerable runway left for this growth story (4,000 long-term shop potential). From a labor standpoint, the high applicant flow is also encouraging for a growth story that constantly needs new team members, and the turnover rates are also encouraging in an industry that has struggled to remain fully staffed. In fact, some restaurants still haven’t met this metric which has impeded sales, like Red Robin (RRGB) and BJ’s Restaurants (BJRI).
Dutch Bros – Annual Store Count & Forward Estimates/Long-Term Guided Potential (Company Filings, Author’s Chart)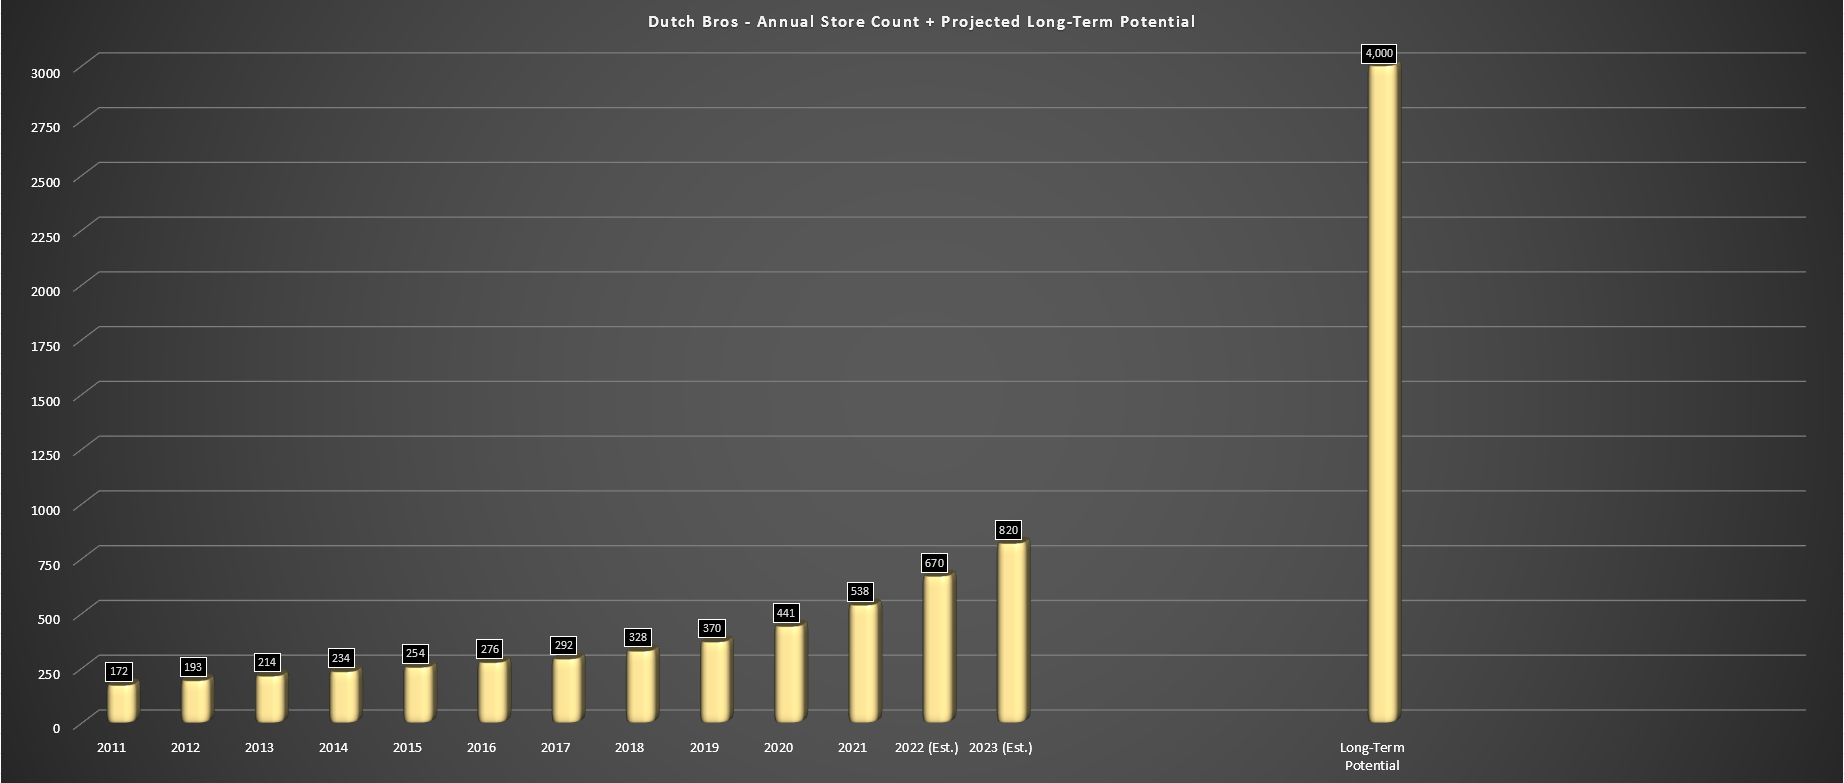
Finally, from a margin standpoint, Dutch Bros reported company-shop-operated gross margins of 20.0%, down 130 basis points year-over-year. While this decline in shop margins wasn’t ideal given the pricing taken in the period, these margins are still quite robust relative to some other brands and should improve further as inflationary pressures moderate. The company called out dairy as being one item that has weighed on margins, contributing to 11% inflation in its cost of goods sold basket in the period. During the quarter, beverage, food & packaging costs were up 150 basis points to 27.1%, but this was fortunately offset by labor costs down 240 basis points (28.3% vs. 30.7%).
Overall, I see this as a mediocre quarter for a brand that’s not a trade-down beneficiary and is operating in a very difficult economic environment. That said, the commentary on trade-down wasn’t ideal, and with another 4.0% of menu pricing, it’s possible we could see a little more of this in the future. On the positive side, the company’s rewards program enables it to target users better. Plus, its Soft Top has performed exceptionally well in driving incremental revenue, which might be helping to offset trading down by some users. That said, Q4 and Q1 could be softer quarters ahead for the brand, with the two strongest quarters from a seasonality standpoint in the rear-view mirror and difficult comps ahead in Q4 (11.5% growth).
Sweat Weather Chai White Coffee (Company Website)
Industry-Wide Trends
If we look at industry-wide trends, there’s no question that it’s been a difficult year for restaurant brands, and traffic has hovered in negative territory nearly all year. This can be attributed to rising grocery, mortgage/rent, gas, and power costs for consumers, which have come up against increasing menu prices at nearly all restaurants as brands look to protect their margins. While there has been some relief from gas prices since the summer, the markets where Dutch Bros has the highest presence of shops continue to see elevated gas prices. The result is a clear pinch on discretionary budgets nationwide, and eating/drinking out is a major discretionary item, even if caffeine is harder to drop than other items.
Retail Gas Prices (AAA Gas Prices)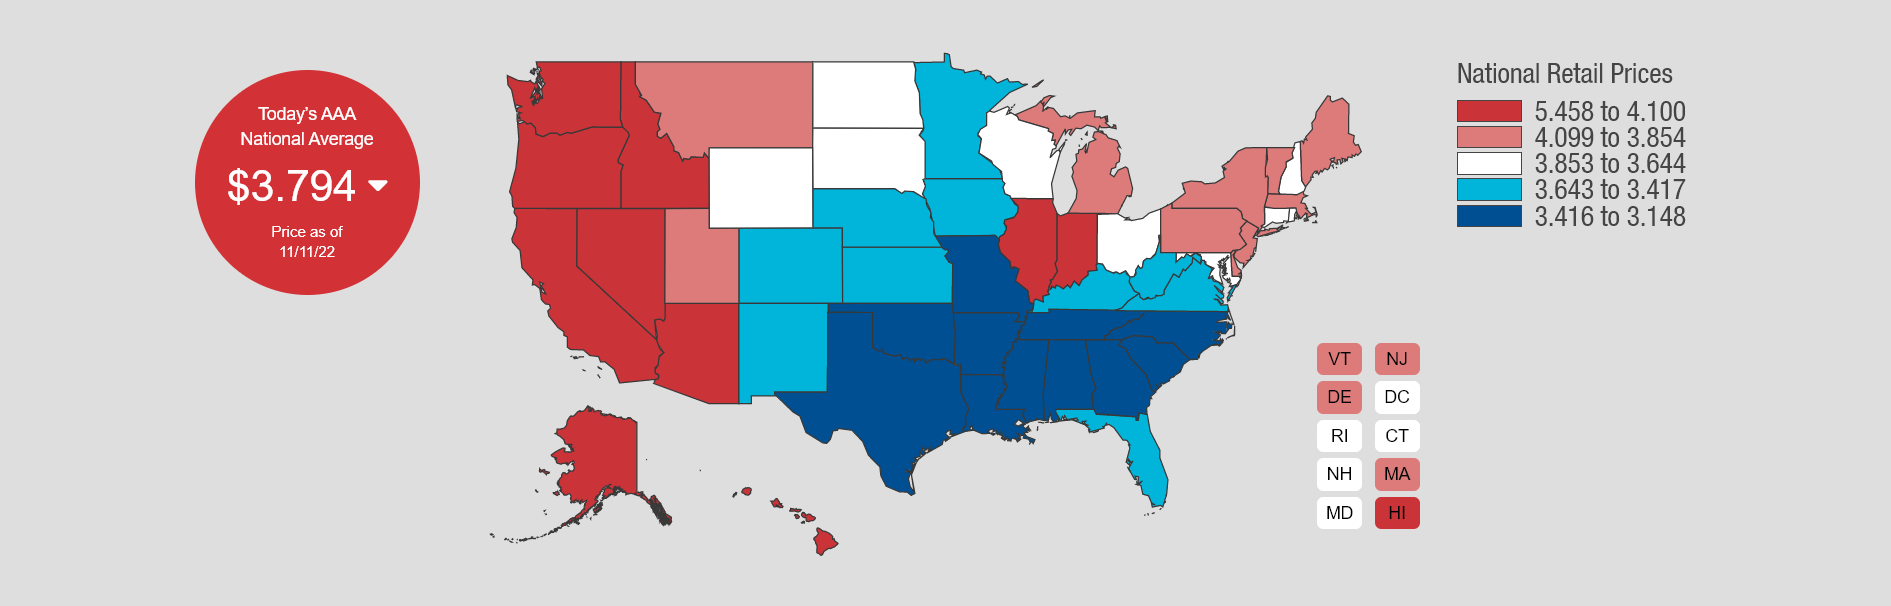
According to Black Box, same-store traffic fell 3.6% year-over-year in September, further decelerating from August levels (negative 1.9%). This certainly showed up in Dutch Bros sales figures where negative traffic was clear as same-shop sales hovered at low single-digit levels despite 9.1% effective pricing. So, while the pullback in gas prices has helped, consumers haven’t seen any real relief in other categories, and they’re certainly in a much weaker position from a savings standpoint. The latter point is evidenced by the below chart, highlighting personal savings rates that are sitting at multi-decade lows.
Personal Savings Rates (US Bureau of Economic Analysis, fred.stlouisfed.org)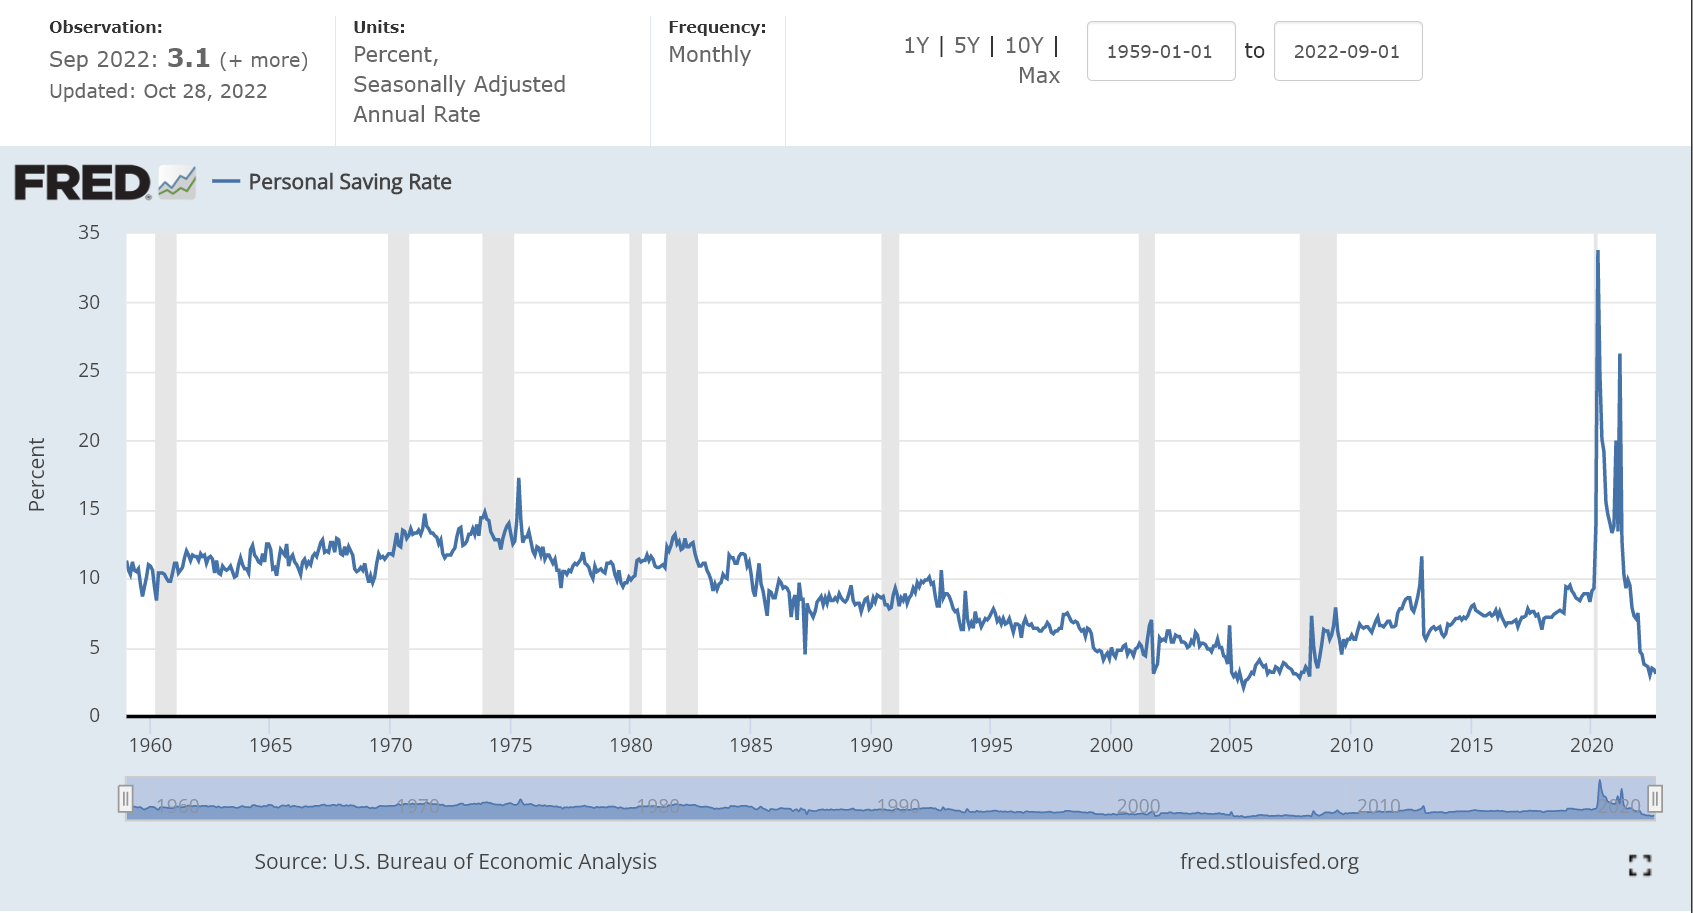
Given that consumers are entering the holiday season cash-strapped while most brands have taken additional pricing in Q3, which will be felt in Q4, it’s hard to see traffic flipping back to positive, and one could argue it might worsen in the November to March period on a year-over-year basis. This is because consumers could be even more cash-strapped after holiday spending; the reverse wealth effect is in full force with the stock market and housing market under pressure, and consumers aren’t as anxious to treat themselves when they’re feeling less rich, or they can’t afford to treat themselves. For Dutch Bros, it is a lower ticket item and addictive (caffeine), so it might fare better. Still, it’s possible it could be an ugly winter for restaurant traffic.
The good news for some brands is that after 40% plus share-price declines to mid-single-digit earnings multiples, the worries about a softer few months ahead were largely priced into these stocks. However, for Dutch Bros, the stock is still insanely expensive even after a 55% decline from its all-time high at $81.00. Hence, while the share price has taken a beating, and this might normally be a contrarian bet, there’s zero margin of safety here. Let’s take a closer look below:
Valuation
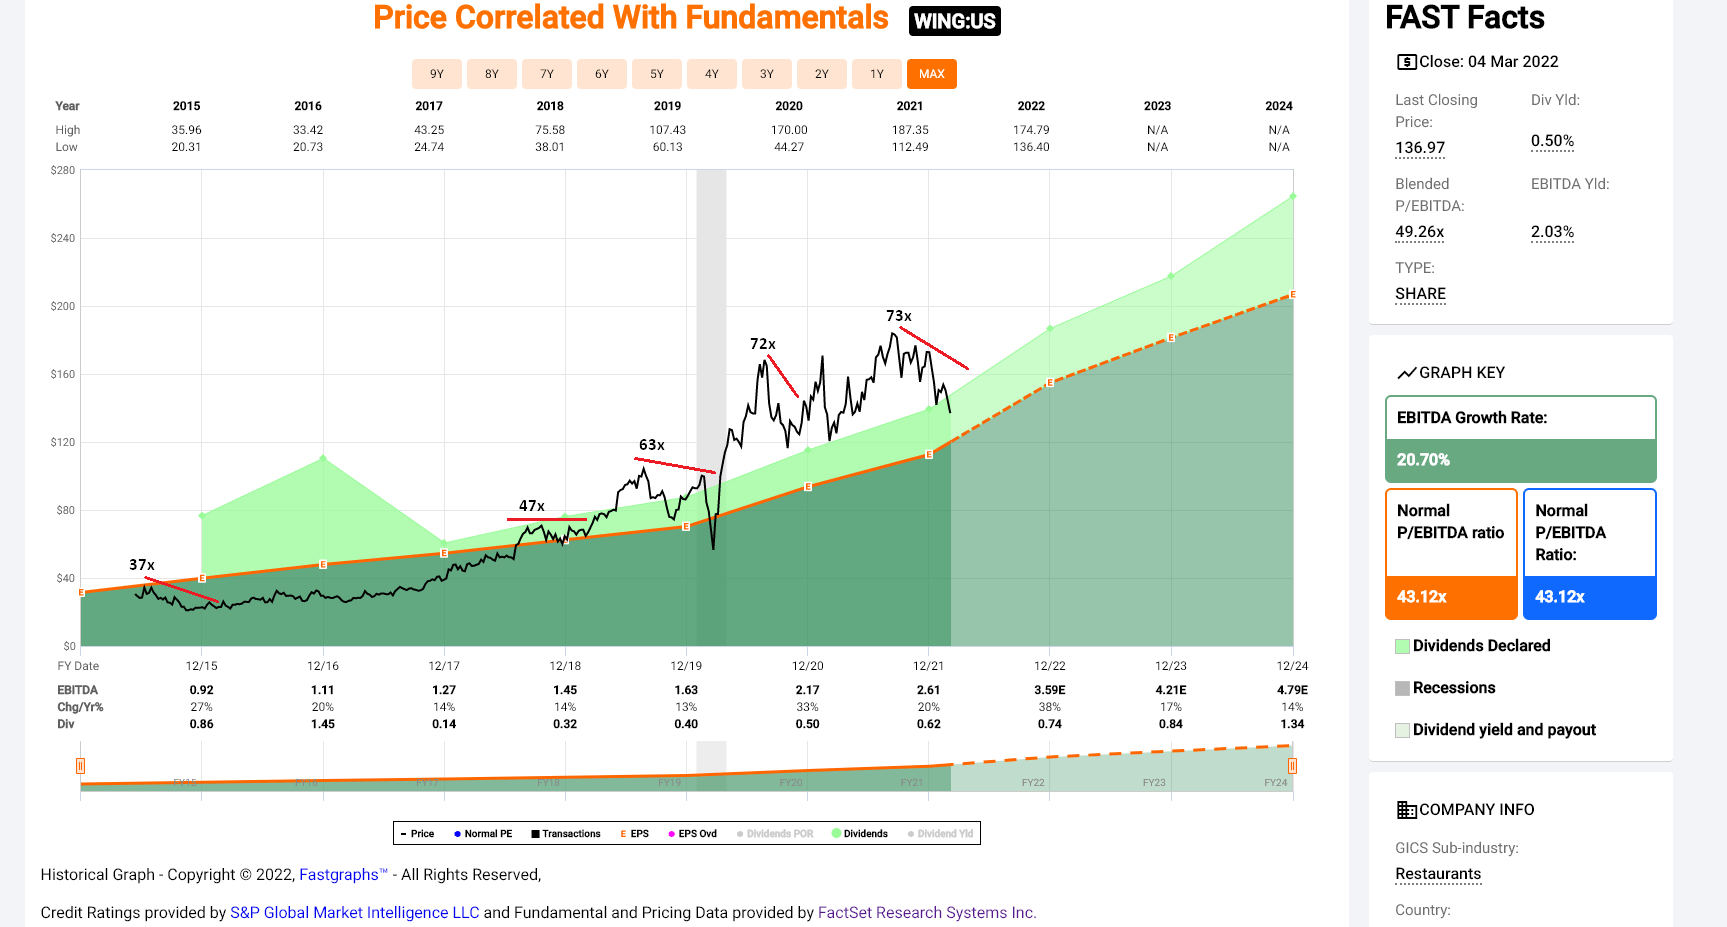
Based on an estimated 163 million shares at year-end and a share price of $37.80, Dutch Bros has a market cap of ~$6.16 billion and an enterprise value of ~$6.31 billion. While this might seem cheap for a company aiming to open 4,000+ stores long-term that will each do well over $2.0 million in average unit volume, investors are paying up for a portion of this future growth. This is because Dutch Bros currently trades at ~30.8x FY2024 EV/EBITDA estimates and ~69x FY2024 annual EPS estimates. To put this in perspective, other high-growth stories like Chipotle (CMG) rarely traded at more than 30x EBITDA during their high-growth phase, and this wasn’t on a two-year forward basis. The same is true of Wingstop (WING), which typically peaked at 50x EBITDA amid a much healthier economic backdrop (2015-2021).
Below are historical charts of Wingstop and Chipotle’s average and peak EBITDA multiples during their high-growth phases.
Chipotle – Historical EBITDA Multiple (FASTGraphs.com) Wingstop – Historical & Average EBITDA Multiple (FASTGraphs.com)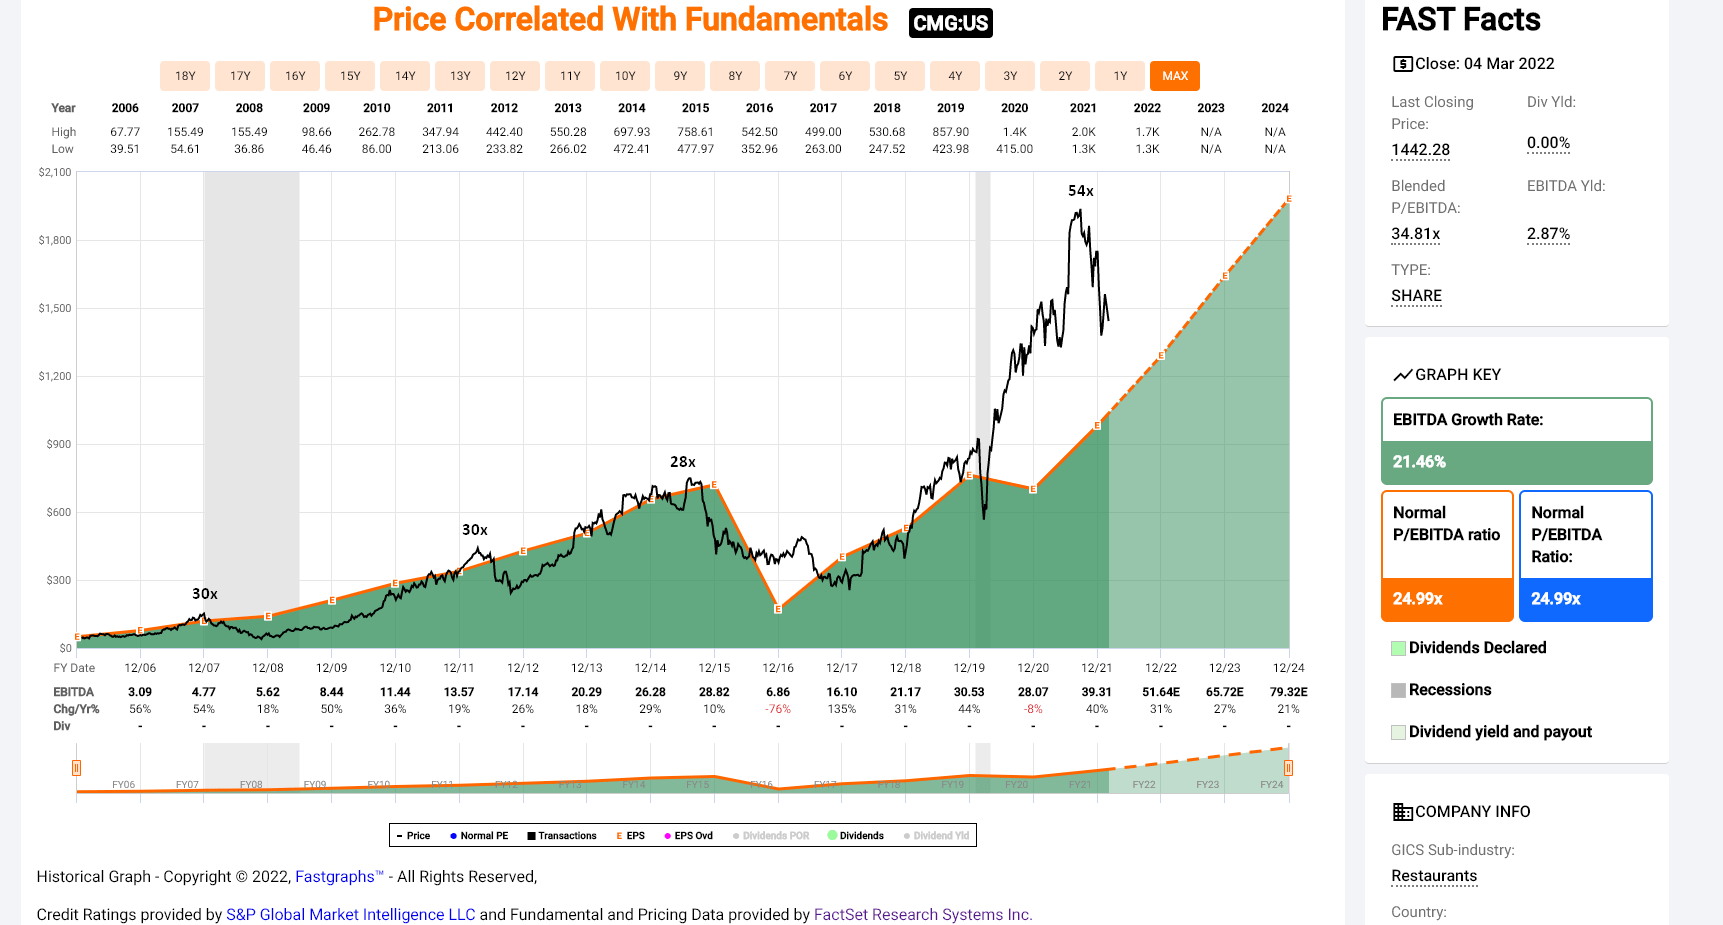
Some investors might argue that Dutch Bros deserves a premium over other growth stories in the space, given that it benefits from phenomenal AUVs relative to the cost to build each shop and relative to its square footage. That said, even if we apply a generous 2-year forward P/EBITDA multiple of 32.0 to account for this being the most exciting growth story in the industry, this would still place Dutch Bros’ fair value at $6.56 billion or $40.20 per share. This points to a limited upside from a current share price of $37.80, suggesting that this rally has once again left the stock in a less favorable position from a reward/risk position, similar to my update in August.
Dutch Bros Article – August 14th (Seeking Alpha Premium)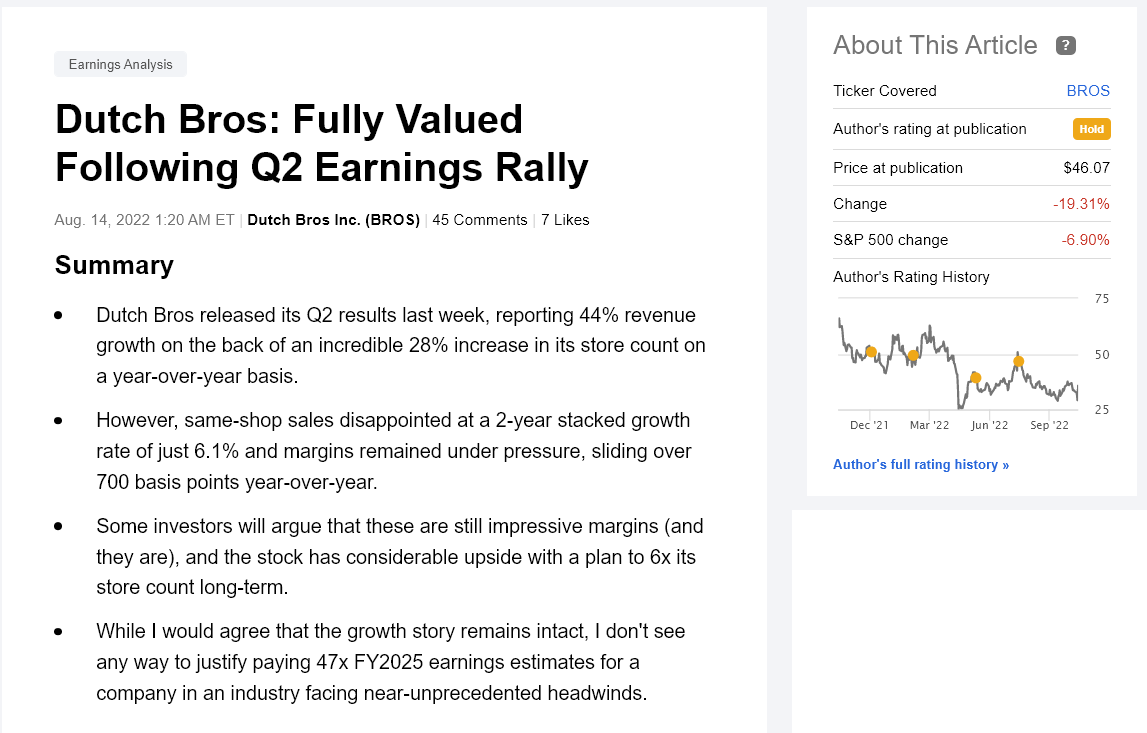
Finally, looking at recent insider activity, we can see that Dutch Bros’ Chief Executive Officer, Chief Operating Officer, and Chief Financial Officer don’t appear to see value above $40.00. This is because we’ve seen combined sales of more than 340,000 shares between $40.00 and $46.60 per share, translating to over $14.2 million in insider selling since March alone. It’s worth noting that these sales are relatively insignificant compared to their total positions in the stock. Still, this isn’t a case where a stock appears overvalued, but insiders are digging in their heels regardless and paying up for the stock to add to already large positions.
Dutch Bros – Insider Selling (Nasdaq.com)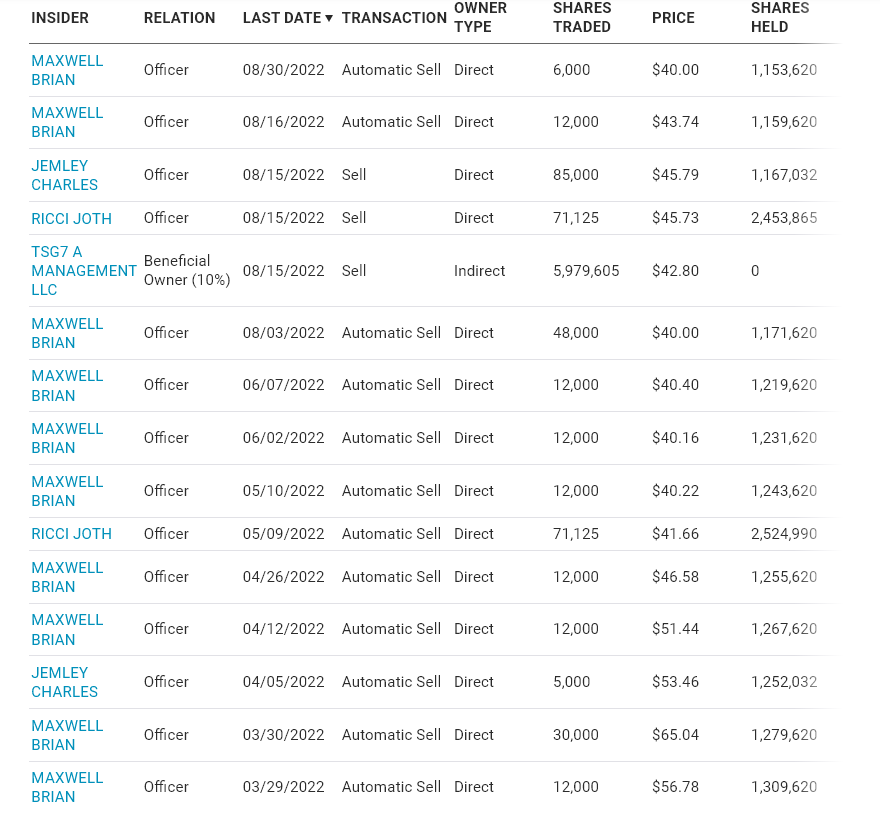
Technical Picture
Finally, if we look at the technical picture, we can see that Dutch Bros’ recent rally has left the stock in the upper portion of its support/resistance range, with support at $29.00 and resistance at $40.90. If we measure from a current share price of $37.80, this translates to a reward/risk ratio of 0.35 to 1.0 with $3.10 in potential upside to resistance and $8.80 in potential downside to support. This doesn’t mean that the stock can’t head higher, but given the less favorable reward/risk ratio, I don’t see any way to justify paying up for the stock above $38.00, and I would view any rallies above $42.00 before year-end as selling opportunities.
BROS 3-Month Chart (TC2000.com)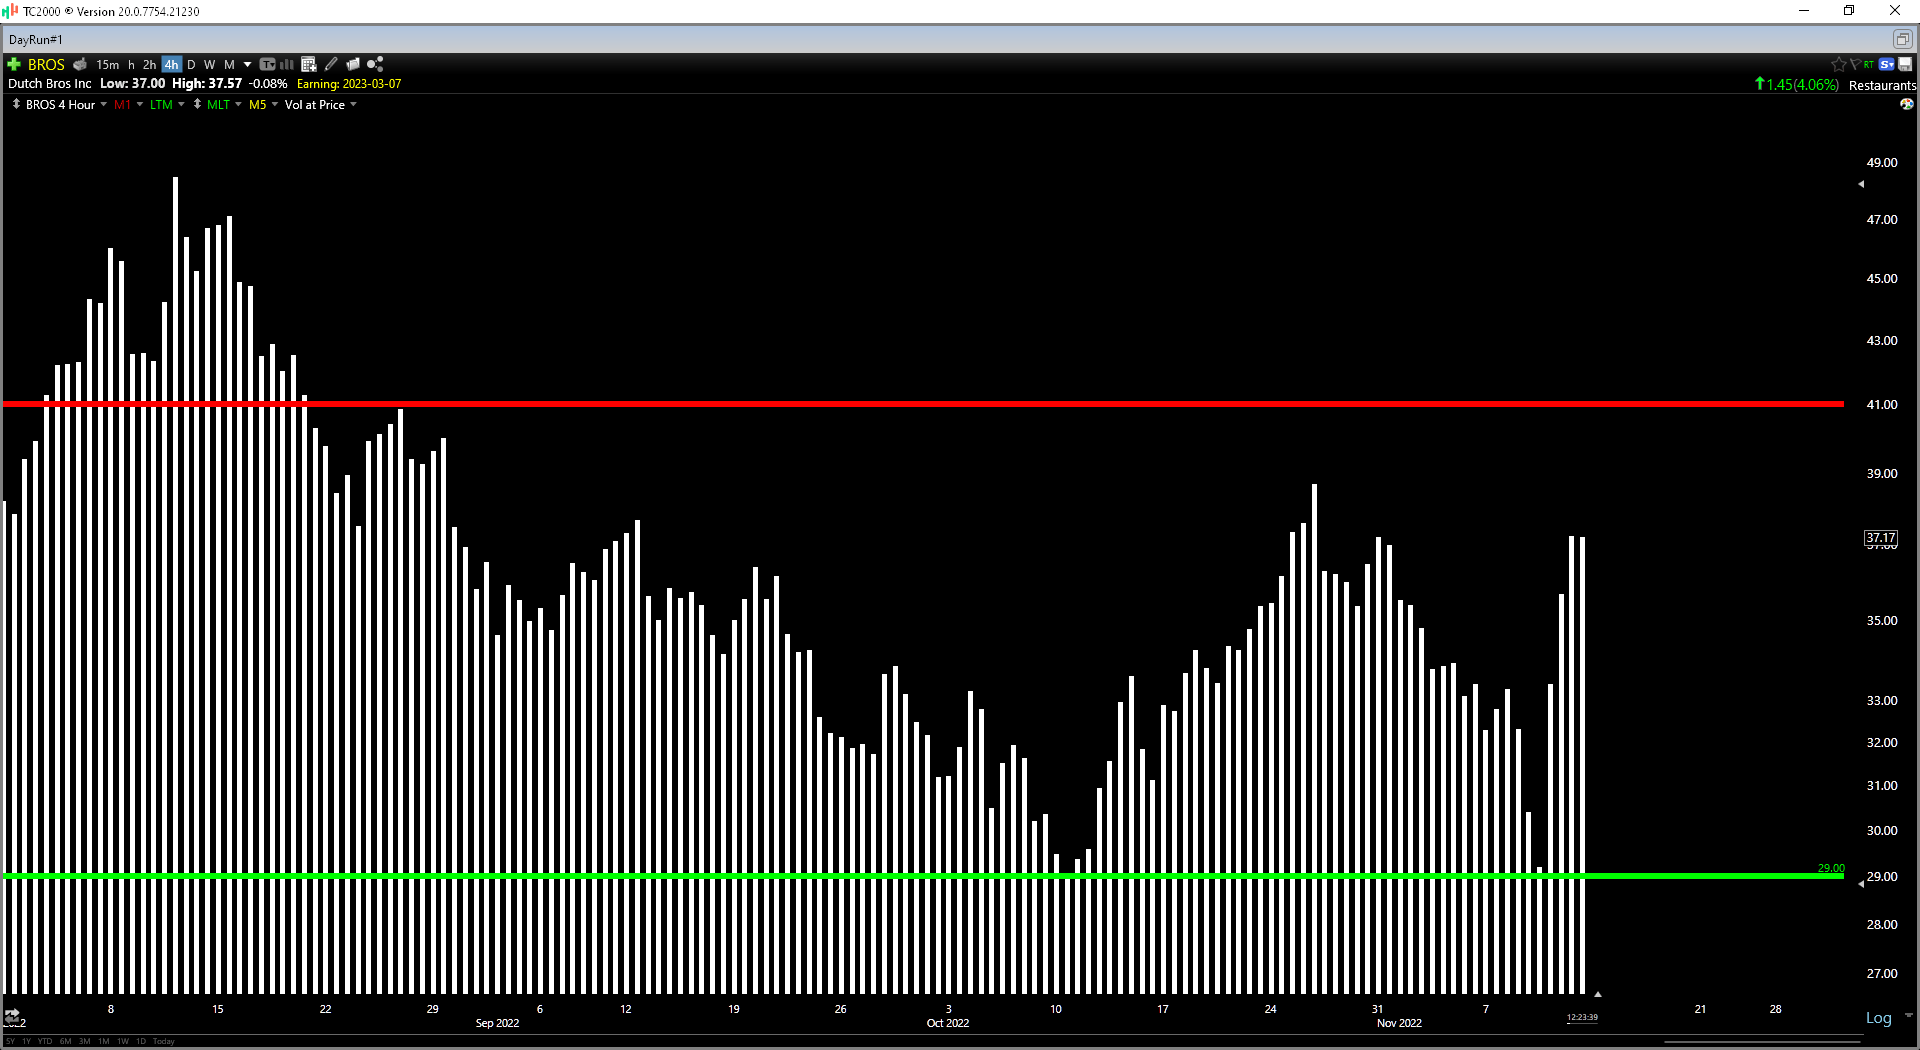
Summary
Dutch Bros had a decent quarter in Q3, considering the challenging operating environment. Still, with low personal savings rates and rising costs for consumers coming up against higher menu prices, I struggle to see an attractive outlook for industry-wide traffic outside of trade-down options. There are opportunities in some cases where a considerable amount of negativity is priced in, like Domino’s Pizza, which I noted would become attractive below $320.00. However, I continue to see Dutch Bros as an exciting company but a much less exciting stock, and great companies don’t always make great stocks when they’re over-priced. Hence, if I were looking to invest in BROS, I would wait for a pullback to $29.00 at a bare minimum before jumping into the stock.
Be the first to comment