


mbbirdy/E+ via Getty Images
The title of this article comes from an old Wall Street story that caught my eye in a highly recommended book by Prof. Jeremy Siegel called “The Future for Investors”:
A broker recommends that his client buy a small speculative stock with good earnings prospects. The investor purchases the stock, accumulating thousands of shares at ever rising prices. Patting himself on the back, he phones his broker, instructing him to sell all his shares. His broker snaps back, “Sell? Sell to whom?” You’re the only one who has been buying this stock!
In the context of explaining the demographic problem of the Western world and Japan and its impact on pension and healthcare systems, Prof. Siegel argues very convincingly that in order to maintain one’s lifestyle in retirement, one must be able to sell at a profit the assets accumulated during one’s working years. It’s important to note that it’s irrelevant whether the assets are accumulated directly through personal pension provisions or indirectly by contributing into a public pension fund. With Western and Japanese populations aging continuously and fertility rates declining, the number of workers per retiree declines. While in 1950, there were seven workers for every retired person in the U.S., this number shrank to less than five in 2005 and is expected to reach 2.6 workers per retiree in 2050. Japan is even off worse, as the number has fallen from 10 in 1950 to 3 in 2005 and is expected to decline to 1.3 by 2050. Europe is in similarly bad shape, licking its wounds from the widespread lowering of the retirement age, which has risen again in recent years and is certain to continue to rise over time.
As baby boomers retire, they (or their trustees) are required to sell portions of the assets accumulated during the working years. One can rightly ask: Who is the buyer when the generation working at that time scrambles with higher inflation rates and increasing taxes and social insurance contributions? The rate of inflation will increase, as the demand for goods and services by retirees outstrips the supply produced by the decreasing number of workers. Taxes and other duties will likely rise as well, as this is a seemingly easy solution to the problem to shift cash flows expected by future retirees to current ones.
In his book, Prof. Siegel presents the “Global Solution” to the pension dilemma of the Western world and Japan. Its principles are based on increasing participation in international equity markets by younger investors from emerging markets such as China and India. Today’s world is more interconnected than ever, and economies are deeply reliant on each other. For example, consumers from India rely on products and technologies from U.S. companies and vice versa. Of course, Prof. Siegel is a proponent of globalization and strongly opposes protectionism.
Besides an investment in funds that are geographically diversified, the importance of dividend-paying stocks is particularly emphasized in the book. Siegel devotes several chapters of his book to dividend stocks, arguing convincingly why they can be used to generate market-beating returns and excel during and especially after bear markets. Same as Peter Lynch – he advises against investing in what’s hot and what currently has the highest growth expectations.
While a portfolio of dividend-paying stocks can come with unfavorable tax implications (if not held in a tax-deferred account), one of the main reasons for my strong conviction is my answer to the question asked in the title of this article:
…nobody!
Automated investment in index funds (i.e., what’s commonly referred to these days as the foolproof path to financial success) carries the risk of having to sell assets at potentially lower prices than they were originally purchased. I went into more detail on this topic in last month’s article. In today’s piece, I would like to introduce you to five companies which I believe are solid long-term investments. They may not necessarily beat the market in the short run or when bought at the current share price. However, their solid business models, innovation and adaptability, and economic resilience have provided shareholders with handsome profits in the past and will most likely continue to do so in the future.
Since the companies discussed in this article have pricing power, it can be assumed that they will continue to increase their dividend payouts in the future. And if we do indeed have to brace ourselves for several years of a sideways or bear market, investors can let dividend reinvestment work its magic and hitch one wagon after another to the soon-to-be-unstoppable dividend train.
Below, I will briefly introduce each of the companies, discuss their strengths and weaknesses, profitability, financial stability and also their current valuation. In the Appendix, I have tabulated the results of my quantitative screening for those of you who do not have the time to read the entire article.
Leggett & Platt
Leggett & Platt (LEG) has evolved from a small manufacturer of bedsprings to a diversified integrated manufacturer of engineered components that are found in homes and commercial environments (beddings, floorings, home and work furniture), automobiles and to a very small extent also in the aerospace sector. What I have just described is certainly a cyclical company, as also the historical earnings trend in Figure 1 illustrates.
Confronted with labor shortages, increased input costs and supply chain disruptions, Leggett & Platt was still able to deliver a very solid fiscal 2021, which is a clear reflection of the company’s resilience, management’s capabilities, and corporate culture. The company has very reasonable pricing power for a business that appears somewhat commoditized. In my opinion, LEG’s emphasis on B2B and long-standing customer relationships are the key factors behind the company’s solid position.
LEG’s balance sheet appears somewhat leveraged due to the large acquisition of Elite Comfort Solutions in 2019. However, debt is still manageable in light of the strong free cash flow. Leggett’s profit margins seem small, but they have been very stable over the last several decades and major recessions and are certainly in line with expectations for a smaller industrial company, as discussed in my recent article. Likewise, the company is not the most profitable, but its return on invested capital – ROIC – is adequate and mostly well above its weighted average cost of capital. LEG’s management is very shareholder friendly, and the current dividend yield of 4.7% combined with the expected dividend growth of 5% per year is very attractive. The company is a dividend king with 51 consecutive years of dividend increases. The dividend is very secure, as shown by the payout ratio in relation to normalized FCF of 50%.
Since the company’s earnings are cyclical, care should be taken to buy shares of this company during a recession or when one is expected. I believe that the market is increasingly pricing in a recession at $36 and thus consider the current valuation very acceptable. The shares are undervalued compared to every historical average multiple (Table 3, Appendix). The stock will certainly drop quite a bit lower in a recession – which I think will be inevitable at some point – and I would therefore build my position slowly. Personally, I have begun buying shares of Leggett & Platt at around $38.
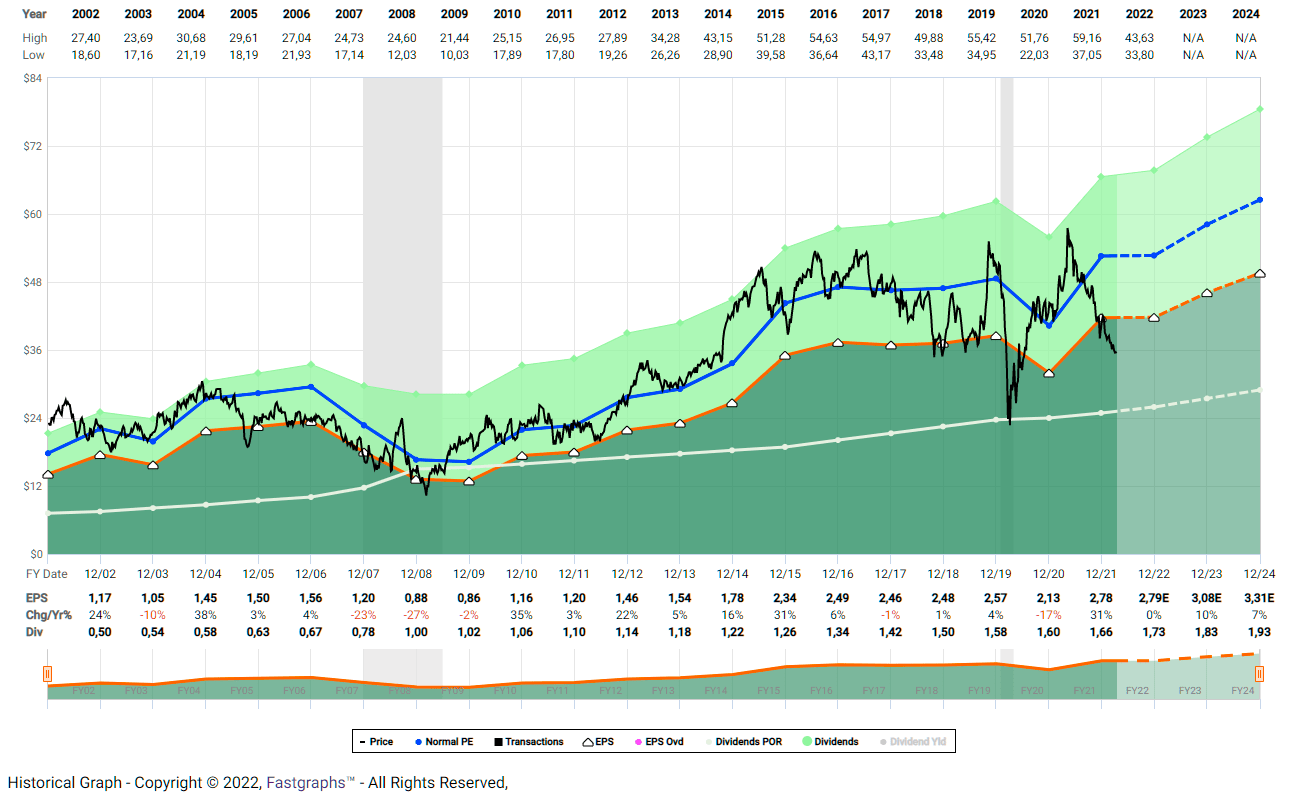
Figure 1: FAST Graphs chart for Leggett & Platt (LEG), based on adjusted operating earnings (obtained with permission from FAST Graphs)
The Home Depot
The Home Depot (HD) is the largest home improvement retailer in the U.S., with a market share of 28%. Its footprint is significantly larger than that of its main competitor Lowe’s (LOW), and the company even operates centers in Mexico and Canada (around 8% of annual sales). The company has aggressively increased the number of its home improvement centers and currently operates about 2,300 stores, suggesting that geographic expansion within the U.S. may be limited. Earnings grew strongly over the past decade and received a boost during the pandemic for obvious reasons.
The U.S. housing market still appears strong but is showing more and more cracks on the surface. The company’s understandably high dependence on a robust housing market and previously exuberant investors have led to a significant decline in the share price since the end of 2021. The shares are still far from cheap, especially for a company with somewhat cyclical earnings (Figure 2), but they are in a territory where I feel comfortable initiating a position.
Due to the strong brand recognition, excellent customer service and product range, as well as competitive pricing, HD can be characterized as a business with a wide economic moat. The company has succeeded in transforming an ordinary retail store into a real experience. In an inflationary environment, sales will theoretically suffer due to the lower amount of discretionary money available. However, HD has pricing power and it’s not entirely fair to characterize the home improvement industry as discretionary. Personally, I think HD will benefit from inflation as long as it remains manageable, as people will increasingly gravitate towards fixer-uppers and DIY restorations.
HD’s margins are very solid for a retail business and the company is highly profitable with a ROIC of over 50%. The balance sheet is robust, and even though shareholders’ equity is negative due to aggressive share buybacks, the company’s debt load is far from concerning given the strong FCF. The Home Depot has been increasing its dividend for 14 years and the shares currently yield 2.5%, slightly above the historical average. At a nine-year compound annual growth rate – CAGR – of almost 20%, HD can certainly be characterized as a dividend growth stock. The payout ratio in terms of normalized FCF (i.e., accounting for stock-based compensations, impairments and working capital movements) is very acceptable at currently less than 50%.
The company has lost nearly 30% of its market capitalization in recent months, but the shares are still not cheap by conventional standards. However, due to the company’s strong market position, a premium is definitely justified. The shares currently trade slightly below their five-year average valuation multiples. A share price of $300 suggests that HD’s free cash flow has to grow at a terminal rate of 5% per year to reflect an annualized rate of return of 10%. While this growth expectation seems ambitious, it should be taken into account that HD’s normalized FCF has grown at an average rate of 10% over the past decade.
In the event of a recession or deteriorating housing market, shares of HD will likely depreciate significantly. I plan to purchase shares in HD, but would be very slow to add to the position, given where we are in the economic cycle and that the U.S. housing market is showing weakness. In this context, I recommend that you read fellow Seeking Alpha contributor Garrett Duyck’s recently published article.
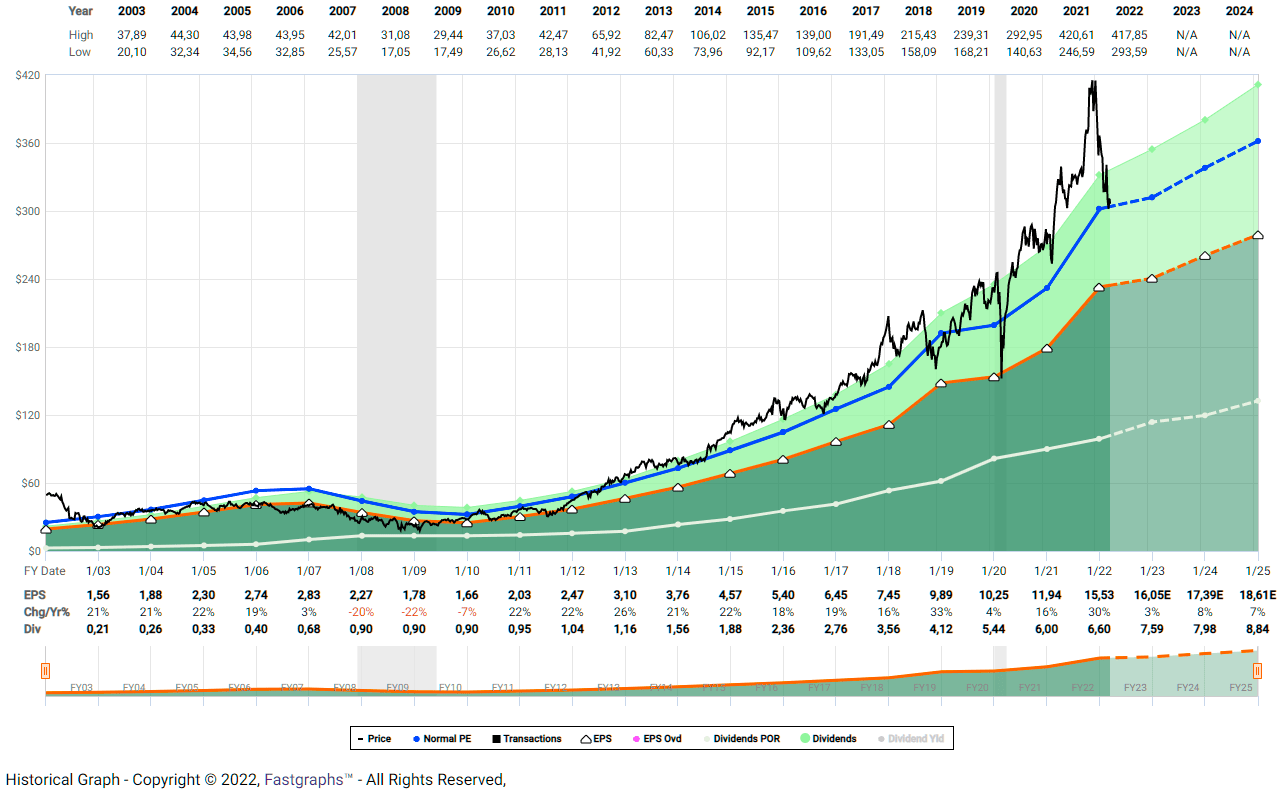
Figure 2: FAST Graphs chart for The Home Depot (HD), based on adjusted operating earnings (obtained with permission from FAST Graphs)
Starbucks
Starbucks (SBUX) needs no great introduction. The well-known multinational chain of coffeehouses and roastery reserves has been growing aggressively over the last decades. With a gross margin of around 70% and a ROIC of around 20%, Starbucks is a highly profitable company.
The COVID-19 pandemic weighed heavily on the company’s earnings, as can be noticed from the earnings graph in Figure 3. However, and as a strong testimony of Starbucks’ wide economic moat, sales and earnings rebounded sharply as measures imposed by governments around the world gradually eased. Growth expectations in China, which can be seen as Starbucks bulls’ main argument for the premium valuation, have been critically scrutinized recently. The perceived trend toward de-globalization and the increasing tendency toward unionization have put further pressure on the shares. The company recently announced the return of former CEO Howard Schultz as interim CEO, and one of his first actions was to suspend the company’s aggressive share buyback program while at the same time trying to counter the union push with more attractive benefit packages for employees.
Starbucks’ earnings trajectory has been extremely robust over the past decade, but it’s important to remember that the company operates in the discretionary space. In the event of an upcoming recession, sales will most certainly suffer, as consumers are expected to cut back on their discretionary spending. However, given Starbucks’ strong brand recognition and well-received products, I doubt that the company’s earnings will suffer disproportionately.
Starbucks’ balance sheet is clearly marked by excessive share buybacks. Frankly, it never ceases to amaze me how haphazardly and aggressively corporate executives time buybacks in some cases. However, I’m not suggesting that Starbucks is on the verge of bankruptcy or is poorly managed. On the contrary, due to strong free cash flow and the fact that the company is able to leverage cash from customers’ prepaid cards (i.e., $2.1 billion at the end of Q1 2022), I believe Starbucks’ balance sheet is quite robust.
With a current price-earnings ratio of 24, the shares are still highly valued. However, if you take into account Starbucks’ historical valuation multiples – which are probably not the most objective against the backdrop of this particularly strong bull market – the shares are actually trading at an acceptable valuation. At $80 per share, SBUX’ free cash flow has to grow at a terminal rate of 6% per year to reflect an annualized rate of return of 10%. This is certainly a fairly aggressive growth assumption for a mature company, but it’s still dwarfed by the 12% CAGR over the last decade. As a conservative investor, I do not feel particularly comfortable incorporating such a growth rate in my valuation models. However, given Starbucks’ untapped growth opportunities (which investors are currently critical of) and the company’s high margins with plenty of room for improvement, I see myself opening a small position. However, against the backdrop of a still frothy market, I will build my position at a slow pace.

Figure 3: FAST Graphs chart for Starbucks (SBUX), based on adjusted operating earnings (obtained with permission from FAST Graphs)
T. Rowe Price
T. Rowe Price (TROW) is one of the most well-known active fund managers in the world. At the end of 2021, the company reported assets under management of $1.69 trillion. TROW derives its revenues primarily from investment advisory services that are provided to individual and institutional investors via U.S. mutual funds, subadvised funds, separately managed accounts and collective investment trusts, open-ended investment products (non-U.S.) and products offered through variable annuity life insurance plans in the U.S. The company also serves as a mutual fund transfer agent and offers accounting, shareholder, recordkeeping, brokerage and trust services.
Due to its asset-light business model, the company is particularly profitable (ROIC typically 25% or higher) and generates a very robust free cash flow. In contrast to one of its main competitors, Franklin Resources (BEN), TROW has been growing revenues and earnings very consistently, at a CAGR of 10.5% since 1999. While its competitor faces continued net outflows of client funds, TROW has done a remarkable job of retaining its clients’ funds and even attracting new inflows. In my comparative analysis, I conclude that TROW’s outperformance is likely due to its better-incentivized fund managers, who are also the reason for the above-average performance of many of TROW’s mutual funds.
TROW’s balance sheet is one of the strongest I have ever seen. The company carries no debt on its books and its equity ratio is very high at 74% of total assets. Over the last couple of years, the company carried $666 million in goodwill on its balance sheet and so far did not report any impairment charges. In the process of acquiring the investment firm Oak Hill Advisors, goodwill increased by approximately $2 billion but still does not appear concerning at 22% of total assets or 29% of equity.
Management is extremely shareholder-friendly. The company has been increasing its dividend at a CAGR of almost 15% over the last two decades and is a dividend aristocrat with 36 consecutive years of dividend increases. Due to the sizable cash position ($1.5 billion at the end of fiscal 2021) and the payout ratio of 70% and 27% in terms of normalized FCF and operating earnings, respectively, I highly doubt TROW would have to cut its dividend in an impending recession.
As a result of investors pricing in a weak stock market, shares of TROW have fallen from $220 at the end of 2021 to about $140 today. At a price-earnings ratio of around 10, the shares trade at a sizable discount to their historical average valuation. The FCF yield of almost 8% is compelling and my inverse discounted cash flow model suggests that the market currently expects a terminal growth rate of around 2% at a cost of equity of 10%. It could rightly be argued that asset managers are difficult to value based on FCF because of their variability. However, also according to the other metrics summarized in Table 3 in the Appendix, the shares are a pretty solid deal for a long-term oriented investor. I also view the current dividend yield of 3.5% very favorable and have added to my position recently.

Figure 4: FAST Graphs chart for T. Rowe Price (TROW), based on adjusted operating earnings (obtained with permission from FAST Graphs)
Philip Morris
Philip Morris International (PM) is the non-U.S. tobacco business that was spun out of Altria (MO) in 2008. In many books, and also in the above-mentioned work by Prof. Siegel, the original Philip Morris (which was renamed to Altria Group in 2003) has been called the company with probably the highest long-term shareholder returns in modern history. The company has been operating in a declining industry for several decades. Still, it succeeded in more than offsetting the decline in volumes through price increases and operational improvements. Smoking rates continue to decline, but the company is increasingly diversifying its earnings to smoke-free products. At its 2021 investor day, the company announced its ambition for smoke-free products to account for more than 50% of its total net revenues by 2025. The most promising candidates are the heated tobacco products IQOS and IQOS ILUMA, both of which are expected to be marketed by Altria Group in the United States.
With leading brands such as Marlboro and Chesterfield, but also the increasingly popular IQOS line of products, PM has a wide economic moat and operates extremely profitable at a ROIC of around 40%. Its normalized FCF margin of 33% is characteristic for the tobacco industry, but still a remarkably high value compared to other staples companies. FCF growth over the past decade has been relatively modest, with an average annual growth rate of 2%, but still respectable in the context of industry declines and investments in smoke-free products.
I consider PM’s balance sheet very solid, even though shareholders’ equity is negative. FCF is so strong that it would require the company only three years to retire its entire long-term liabilities, assuming the dividend is temporarily suspended. The strength of the balance sheet is also emphasized by the very high Z-Score (see Table 1 in the Appendix).
The shares currently yield 5.0%, which is in line with the five-year average dividend yield. Due to the relatively high payout ratio, the dividend is expected to continue to grow at a low- to mid-single digit rate. Shares of British American Tobacco (BTI) or MO appear riskier due to the higher leverage and the geographical concentration, but investors are compensated accordingly.
With Ukraine and Russia contributing significantly to PM’s bottom line and representing key growth markets for its heated tobacco products, PM shares declined about 20% from their recently more optimistic valuation. However, over the last weeks, the stock rebounded from $90 to more than $100. Compared to MO, but also to its more leveraged international competitor BTI, PM trades at a significant premium, as shown by the valuation ratios in Table 3 in the Appendix. According to the historical average valuation multiples, which were calculated on the basis of the data since 2017, the shares are fairly valued. Since shares of tobacco companies have come under increasing pressure since around 2017, it can be concluded that PM is still far from expensive. This also is emphasized by the FAST Graphs chart in Figure 5. Earnings estimates are very solid and it should not be forgotten that the tobacco industry is projected very accurately by analysts.
I’m personally long the stock and have acquired most of my shares in 2020 and 2021. However, during the recent sell-off, I added to my position and still consider the stock an acceptable long-term value at the current price level. Nevertheless, and as it has become very customary over the last years, negative news about tobacco companies surfaces regularly, and it is precisely these times that prove to be the best opportunities to open or add to a position. At current prices, I think BTI has the best risk-reward ratio.
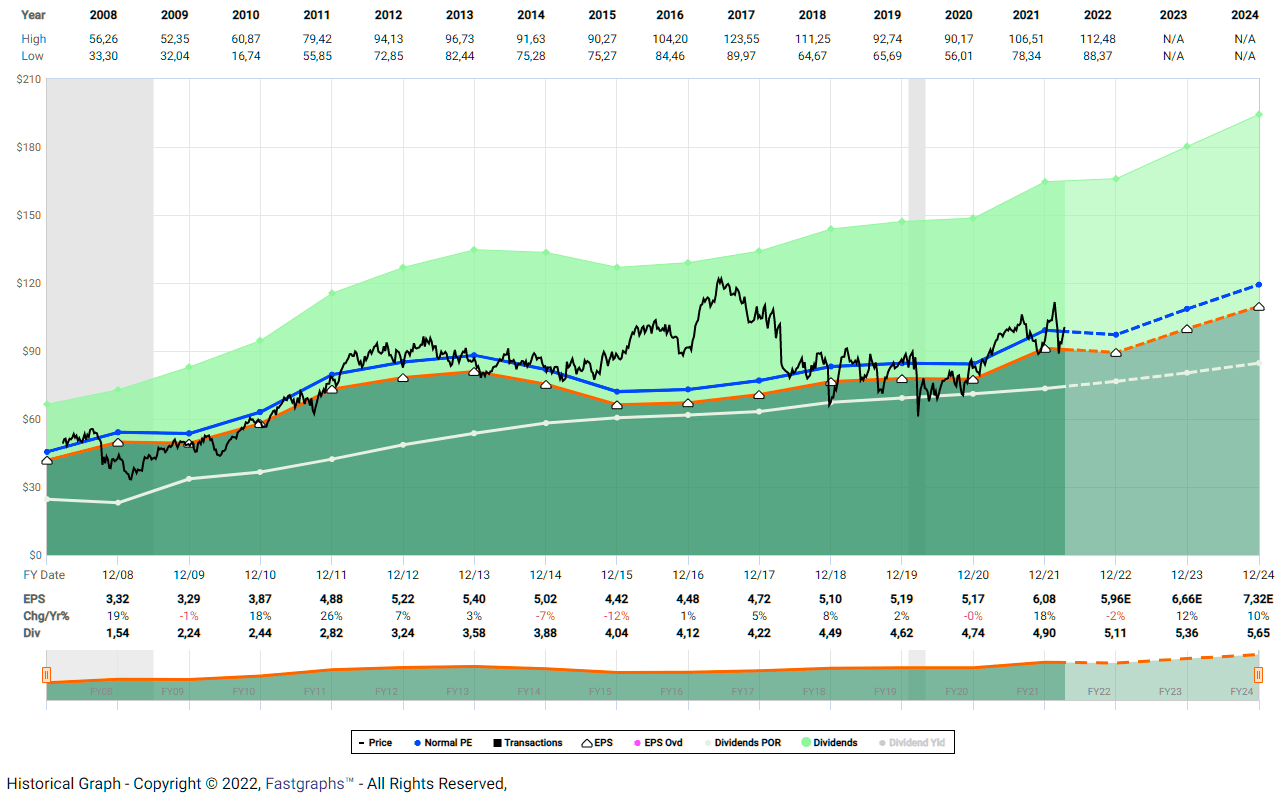
Figure 5: FAST Graphs chart for Philip Morris (PM), based on adjusted operating earnings (obtained with permission from FAST Graphs)
Quick Investor Takeaway
Leggett & Platt, The Home Depot, Starbucks, T. Rowe Price and PM are long-term winners in my opinion. With the exception of Leggett & Platt, all companies have a wide economic moat. Nevertheless, and as has been demonstrated over the past two decades, Leggett also is well positioned, thanks to long-term customer relationships and a continued focus on what it does best. Starbucks and The Home Depot are still somewhat expensive in my opinion, considering the currently (and probably lasting) inflationary environment. However, since it’s impossible to time business cycles precisely, I will soon open a position in both companies, which I will gradually increase over time. T. Rowe Price is a solid value based on current earnings, but that’s certainly a tricky assumption with asset managers. In the event of a recession and/or bear market, earnings are expected to decline and the share price will follow suit. Over the long term, however, T. Rowe Price – as a respected asset manager – can be expected to continue to generate solid returns for its clients and shareholders. Philip Morris International is probably the most conservative pick, given its non-cyclical business, robust balance sheet and customers’ strong brand loyalty. I actually expect PM to do well, not to say profit, in an inflationary environment.
What all five companies have in common is that they are solid companies with a long history and shareholder-friendly managements. Long-term oriented shareholders have been generously rewarded, and I expect this to continue. In the least, investors are compensated by a rising dividend, which is very well covered by underlying earnings. In this way, a sale of one’s own position at a possibly unfavorable valuation during retirement can be safely ruled out and the question posed at the beginning can be answered accordingly.
Appendix
The following metrics are based on each company’s 2021 annual report, the respective share price as of April 14, 2022, as well as own estimations, which take into account the performance of each company over the last ten years. Table 4 contains the results of the quantitative analysis of the individual companies and a corresponding ranking.
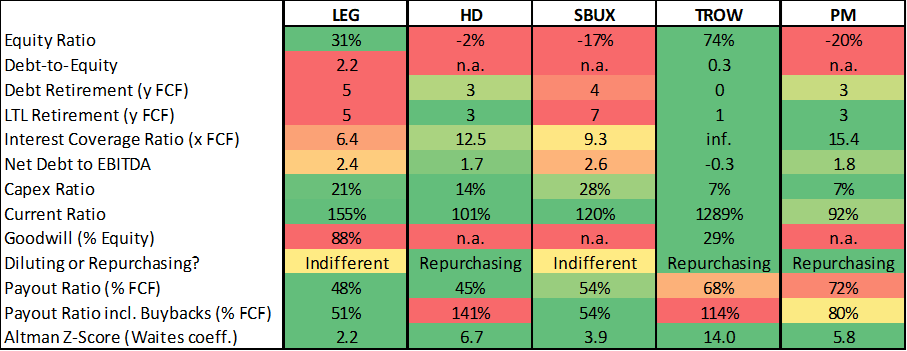
Table 1: Financial stability metrics for LEG, HD, SBUX, TROW and PM (own work, based on each company’s 2021 10-K)

Table 2: Profitability metrics for LEG, HD, SBUX, TROW and PM (own work, based on each company’s 10-K)
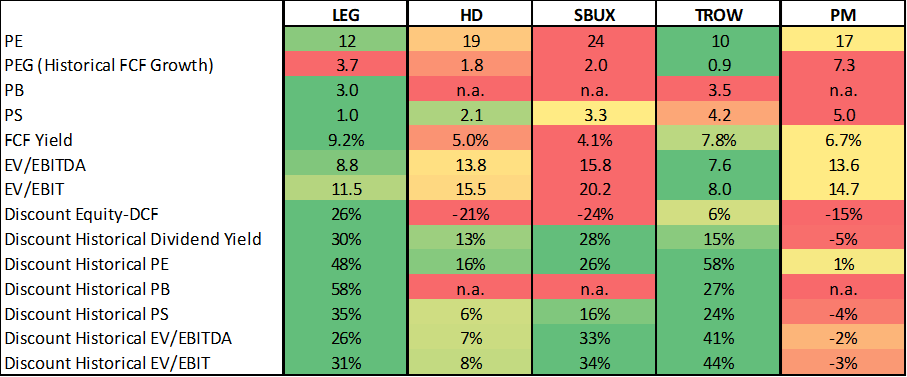
Table 3: Valuation metrics for LEG, HD, SBUX, TROW and PM (own work, based on each company’s 2011 to 2021 10-Ks and share price data from April 14, 2022)
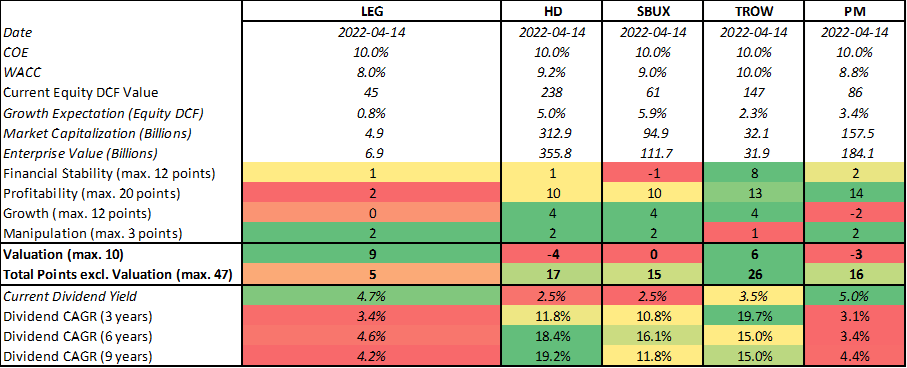
Table 4: Summary of the quantitative analyses of LEG, HD, SBUX, TROW, BMY and PM (based on each company’s 2011 to 2021 10-Ks and share price data from April 14, 2022)
Thank you very much for taking the time to read my article. In case of any questions or comments, I’m very happy to read from you in the comments section below.
Be the first to comment