

bopav
By Rob Isbitts
A generational indicator
“The stock market” can mean many different things, depending on who you talk to. If you are a member of Generations X or Y, you probably think of the S&P 500 as the proxy for how the broader stock market is doing. On the other hand, if you are a Baby Boomer like me (just made that 1964 birth year cutoff), your natural impulse might be the S&P 500, or it might be the Dow Jones Industrial Average. And, if you are part of the so-called “Silent Generation,” my guess is you lean toward the Dow. And perhaps some of the younger investors reading this think of the Nasdaq 100, chock full of FAANG stocks, as the “real” stock market.
There’s no right answer. But the relationship between the Dow and Nasdaq 100 has been the storyteller of 2022’s stock market. This has been the case in past, but I am getting more convinced by the day that this is the “Golden Era” for studying this relationship.
The Dow and Nasdaq are very different market measures. The S&P 500 is somewhere in between. That creates a very interesting pattern of stock market behavior. It is one I have noted through the years and written about on occasion. But in 2022, more than ever, I see this as perhaps the most important stock market indicator to follow.
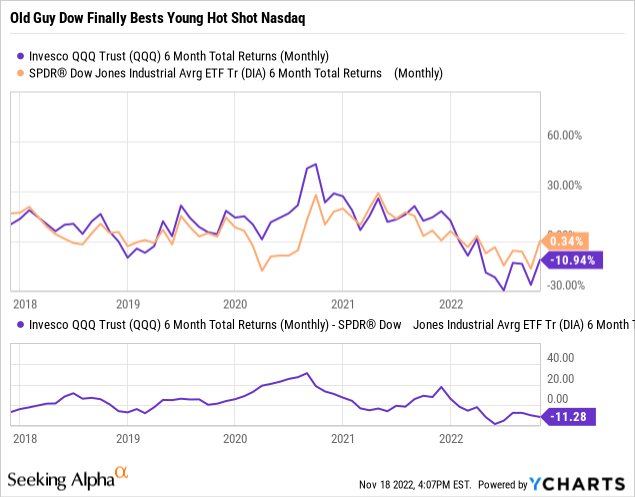
The chart above shows the recent history (5 years back) of this Dow-Nasdaq relationship, using monthly closing prices of 6-month returns. In English, that means that I looked at every 6-month time frame and compared the 6-month return of the Nasdaq and Dow Indexes. So January-June, followed by February-July, and so on.
As you can see, The Nasdaq has outpaced the Dow by some very wide margins at times, from 2018-2021. But in 2022, the Nasdaq has consistently been in the red, not only in terms of its own returns, but also in comparison to its market benchmark buddy, the Dow Jones Industrial Average.
I did a more detailed study of this relationship (not shown), it turns out that the current Dow outperformance of the Nasdaq 100 over the past 6 months (11.28%) is in about the top 10% best 6-month relative performance periods for the Dow versus its “rival” Nasdaq.
Why is this Dow-Nasdaq feud so important now?
On the surface, this might not mean much. After all, markets ebb and flow, right? In the end, we all know what happens. The Nasdaq, led by the mighty FAANG stocks, flies higher than the Dow, and it turns out like it does most of the time: it beats the grand old Dow by a mile. In bull markets, that has been the case since the late 1990s, and the Dot-Com Bubble.
But this is the modern, inflation-ridden, Fed-obsessed, speculation-driven, Crypto-manic stock market era. As such, all investors now have to grapple with the removal of the Fed’s punch bowl at the stock market party.
This means two things:
1. The first time in a long time, the “boring old Dow” appears to be putting up a sustained battle against the Nasdaq.
2. There exists a significant opportunity to exploit this back-and-forth relationship as an investor.
Dow beats Nasdaq: potential implications
Remember a moment ago when I noted that the current Dow outperformance was historically-strong? Well, stock market bulls had better hope that doesn’t get much worse. Because in addition to this year, since the year 2000, with just one exception, every period in which the Dow beat the Nasdaq by more than 11% has occurred in one of the following years: 2000, 2001, 2002, or 2008. That’s 27 out of 28 times that Dow dominance to that level occurred during what was later considered to be a sustained bear market. Recall that the Dot-Com Bust lasted about 36 months, and the Great Financial Crisis of 2008 actually occurred over about 18 months, from 2007-2009. The current market decline started right as 2022 began. That’s less than 11 months ago.
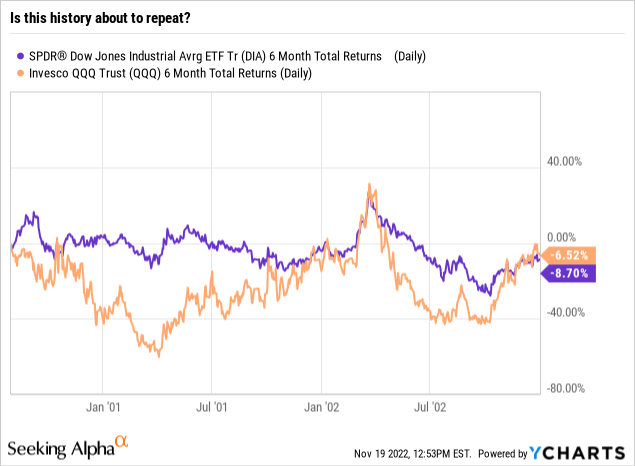
I created the above chart so you can see where this relationship can go if this is, as I suspect it could be, a modern replay of the Dot-Com Bubble Bust from 2000-2003. Remember, this is a 6-month rolling return chart, and in this version, I’ve presented the more granular daily data from late 2000 (which the current market reminds me of in many ways) through late 2002, at which point the Nasdaq finally started to re-gain its extended period of lost momentum.
The Bottom-line: 2022 might just be the start of an extended period of significant outperformance of the Nasdaq. If there’s anything that newer investors have a hard time considering, it is that the FAANG-led Nasdaq could not be the market leader all the time. At this point in the stock market cycle, if history is a guide, this is where the market is more likely to confuse, disappoint and cost investors the most. So, taking note of simple yet significant relationships, or “pairings” such as this one is essential.
Why is this happening?
The Dow has been around for over 100 years. It is the grandparent stock market indicator. Continuing that analogy, the S&P 500, which debuted in 1950 is the child, and the Nasdaq, which to some of us is still a stock exchange, not an index, is the grandchild benchmark. It didn’t enter the world until 1970, and really did not enter the consciousness of the investment mainstream until the mid-1990s. The new kid on the block, if you will. As we know from the ubiquitous TV commercials, the Nasdaq 100 continues to be the center of innovative companies, including the modern market giants.
As time has passed in stock market history, the Dow faded in prominence, partly because of its quirky, old-fashioned weighting system. The Dow is 30 stocks, and those are weighted in the index based on their market prices, not their market capitalization. Quirky, right?
The Nasdaq 100 and S&P 500 are weighted based on how large the stocks are. Over the years, this has created a “big get bigger” situation which seems to go on for years, then implodes. Maybe that is starting again in 2022. We’ll see. But it makes the Dow’s focus on less-sexy, more traditional, longer-tenured public corporations more appealing by comparison. This may not be something that occurs to many investors. But I think it is at the heart of why the Dow has frankly been a decent investment this year, with losses still comfortably in the single digits, percentage-wise. Meanwhile, the Nasdaq 100 is down 28% year-to-date as I write this, even after a solid rally this month.
What if your market measure is the S&P 500, not Dow or Nasdaq?
The S&P 500 is, as noted earlier, somewhere in between grandparent Dow and that “kid,” the Nasdaq 100. However, over the years, the FAANG impact has made the S&P 500 lean more toward being infected by the Nasdaq which the latter measure catches a cold. Or, the flu, as it has in 2022.
For several years, the S&P 500 has acted more like the S&P 10 or the S&P 50 at best, with the vast majority of its roughly 500 members having no influence over the direction of the index. Their weightings are simply too small. The same goes for much of the Nasdaq 100.
The Dow is tilted as well, with about 15 of the 30 components carrying a good deal of the weighting. But as I see it, 2022 has made the Dow relevant again. Not only is a collection of relatively predictable businesses (29 of them pay regular dividends). But it is also an easy set of stocks to track. There are only 30, after all.
The word of the year for stock investors?
This has some potentially excellent implications for stock market investors, as I have seen up close for much of this year. When the Dow is trending much better than the Nasdaq, albeit with some brief, sharp reversals in that relationship along the way, it introduces a bear market strategy that I sum up with one word: Arbitrage.
In other words, there are ways to exploit this pattern of one of those two indexes trouncing the other for sustained periods of time. Whether it is through ETF pairs (long and inverse), stock selection, options, futures or some combination, the opportunity is there. These are highly-visible, easy to track, liquid collections of overlapping but different parts of the U.S. stock market. So it’s a good idea to get more familiar with the current situation, in which the Dow is threatening to pull further away from the Nasdaq.
Be the first to comment