Dilok Klaisataporn
Written by Nick Ackerman, co-produced by Stanford Chemist. A version of this article was originally published to members of the CEF/ETF Income Laboratory on December 6th, 2022.
We very recently provided an update on Doubleline Opportunistic Credit Fund (DBL). In that article, I mentioned that DoubleLine Yield Opportunities Fund (NYSE:DLY) would seemingly be a much more compelling option at this time. Naturally, it makes sense to provide an update on DLY. This is especially timely to update as their new annual reports just dropped.
In our previous update for DLY specifically, I mentioned that it was time to add as the discount has widened. The discount has now widened even further. It has proven it was too early to add to DLY as the fund has slipped even further. Below is a look at the price returns of the fund since the May 7th, 2022, update. With the help of the distributions, it kept the losses much more minimal, but a loss is a loss.
DLY Performance Since Previous Update (Seeking Alpha)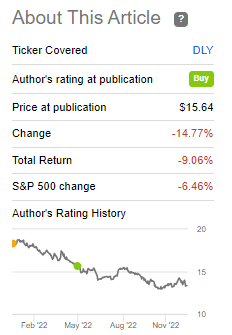
Of course, there is no surprise about the big issue for the fixed-income market (and even the equity market) this year. It’s all about higher interest rates pushing bond prices down. We also have the leverage to worry about in closed-end funds that amplify those moves and cause expenses to rise.
The Basics
- 1-Year Z-score: -1.15
- Discount: 12.01%
- Distribution Yield: 10.51%
- Expense Ratio: 2.60% (including interest expense)
- Leverage: 21.86%
- Managed Assets: $901.334 million
- Structure: Term (anticipated liquidation date February 25th, 2032)
DLY’s investment objective is quite simple: “seek a high level of total return, with an emphasis on current income.” To achieve this, the fund will “invest in a portfolio of investments selected for its potential to provide a high level of total return, with an emphasis on current income. The Fund may invest in debt securities or other income-producing investments of issuers anywhere in the world, including in emerging markets, and may invest in investments of any credit quality.”
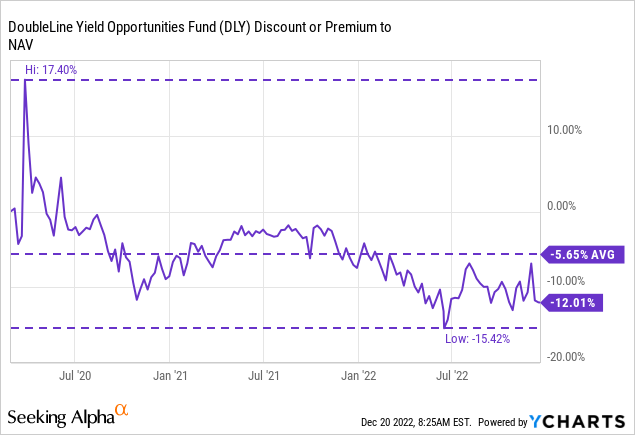
Due to the fund’s discount staying wide for a considerable period of time now, it would appear the 1-year z-score has contracted significantly since our prior update. At that time, it was listed at -2.34. That’s even though the fund’s current discount had only gone from 10.87% to 8.78% as of the latest close. What a 0.18 indicates is that DLY is right about where the average discount has been over the last year.
The fund is moderately leveraged, but that increases risks to the downside nonetheless. It also means higher expenses for the fund as it is based on “one-month daily 2-Day lag SOFR plus 0.10% plus 1.10%.” Being based on a spread above SOFR means as interest rates rise, the leverage costs for this fund rise.
Similar to DBL, they don’t hedge via derivatives such as interest rate swaps, options or futures. Instead, the portfolio provides a bit of a hedge due to the fund’s floating rate exposure. That’s also what keeps its duration lower at 2.46 years.
Leverage can also hurt when deleveraging happens. A fund has a certain amount of assets that generate income and potential gains on its portfolio. When leverage is reduced, that means the income can take a hit.
Performance – Discount Remaining Attractive
One thing that I find quite noteworthy covering more and more fixed-income funds lately is just how poor fixed-income has performed. I know it took a massive hit this year, dragging down all annualized results, but I think it is quite shocking.
Below is DLY’s total share price and total NAV performance. It is a younger fund, so the annualized period doesn’t go back any further than the 1-year standard reporting time frame. DLY has underperformed the benchmark it provided in October, YTD and the last year.
At the same time, the Bloomberg U.S. Aggregate Bond Index is negative in all but the 10-year annualized period.
DLY Annualized Returns (DoubleLine)
Hurting the fund would be its positioning and expense ratio, but mostly I believe it is the leverage in the fund. For a while, DLY was outperforming its benchmark but has since given up those gains when things started going south.
DLY Growth of $10k (DoubleLine)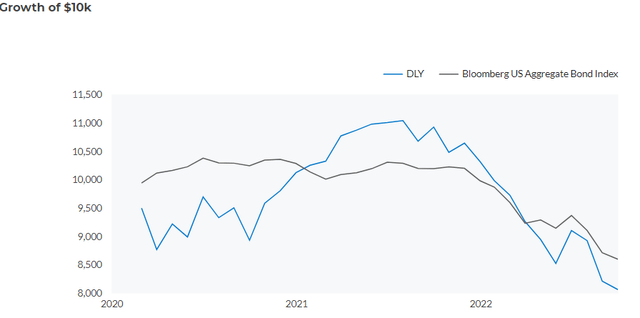
What you can’t do with an index is buy an index. You can buy ETFs that are linked to the index, but those ETFs also can’t provide a discount in the way that CEFs often provide the opportunity. DLY is off of the discount lows it had touched earlier this year but is still quite attractive at this time.
Distribution – Holding Steady, But Watch Coverage
The fund has been paying a $0.1167 monthly distribution since its launch in early 2020. That currently works to a distribution rate of 10.51% and a NAV yield of 9.24%.
As shown below, net investment income or NII year-over-year had a small decline. On a per-share NII basis, we see that it was flat at $1.27 in both years. Helping to stabilize the NII was the higher income the portfolio generated as total investment income or TII climbed a bit from $82.392 million last year to this year’s $83.419 million.
DLY Annual Report (DoubleLine)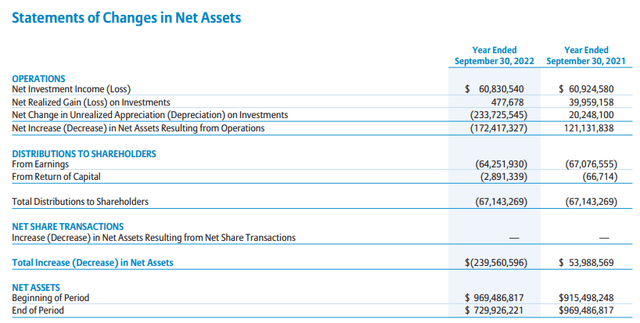
As we touched on above, seeing the fund deleverage this year would mean we see some hits. While TII climbed despite reduced assets, had things held the same, it would suggest that TII and NII would have been even higher. I think that bodes well for the fund as it would seem that the underlying portfolio is providing more income with fewer dollars invested. Seeing this another way, the NII percentage to NAV this year was 7.01%, up from 6.30% last year.
At some point, they had roughly $100 million less in income-generating assets from the fiscal year 2021 to the end of fiscal 2022. In their semi-annual report as of the end of March 31st, 2022, the loan payable was $310 million. So it would appear that the bulk of the deleveraging took place in the latter half of the fiscal year.
All else being equal, we could see another hit to NII going forward, partially offset by the floating-rate loans and bonds in its underlying portfolio. We saw with DBL this was a much bigger impact on the fund. With DLY’s NII distribution coverage still at 90.6%, we may not see a distribution cut for a while. DoubleLine seems to like to hold its payouts steady on its funds. On the other hand, it still isn’t ideal, and as long as that’s the case, a cut is always in the cards.
For tax purposes, we see that return of capital makes its way into some of the classifications. For a fixed-income fund, that’s generally not something you want to see but also expected when earnings aren’t entirely enough to cover the distribution to shareholders. Over time, destructive ROC can eat away at the earnings ability of a fund by paying out its capital little by little.
DLY Tax Character (DoubleLine)
DLY’s Portfolio
Above I touched on the fund’s discount at the CEF level, that is, the fund’s share price relative to its NAV per share. However, we also know that bonds are being discounted at this time. Currently, the average market price for DLY’s portfolio is $81.21, which means that the portfolio is quite heavily discounted.
Of course, some of this is because they invest in below-investment-grade holdings or junk. Areas of the bank and loans market where getting face value back from the original investment isn’t going to happen at 100% of the portfolio. There will be losses. With heightened credit risk entering a year expected to have a recession, the chances for losses are greater. This bond discounting is happening above and beyond just the damage done by rising interest rates.
So that is definitely something to consider before jumping into a fund like DLY. Only a rather minimal 15.7% is listed as investment-grade. Government debt is at a smaller 0.72%, and agency exposure is at a 1.14% sliver. The below investment grade makes up 63.36%, and another 19.09% rounds out the portfolio listed as unrated.
DLY Credit Quality (DoubleLine)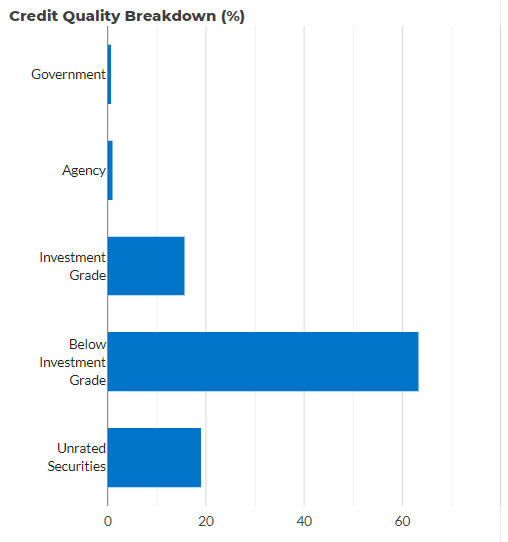
The portfolio is most heavily invested in non-agency CMBS, followed by high-yield corporate bond exposure, then non-agency RMBS. The non-agency exposures here dwarf the safer agency MBS exposure by many multiples. CLOs (collateralized loan obligations) and emerging markets also make up the 13.6% and 13% weightings following that. Weightings that can bring a material impact to the fund.
DLY Sector Breakdown (DoubleLine)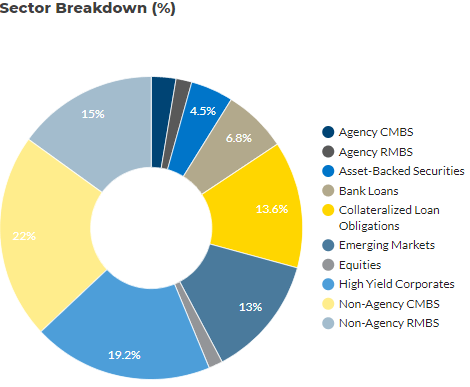
To help mitigate the higher risks that these sorts of weightings pose to DLY, they invest in hundreds of positions. That’s listed at 452, according to CEFConnect. However, within the MBS and CLO holdings are yet further loans that make up these securities. MBS, of course, is backed by bundles of mortgages. CLOs are pooled together senior loans that are divided up into tranches that can be invested in. At the end of the day, there are likely thousands of positions if you take each of these securitized pieces apart.
The CLO and bank loans provide floating rate exposure. As touched on above, that can be helpful when interest rates are rising. Those are a natural hedge to the higher interest expenses of the underlying leverage that DLY employs. At the same time, they’ve also positioned what would appear to be a significant portion of its capital into floating rate MBS as well. That’s both the non-agency and agency, residential and commercial, positions into those based on floating rates.
Conclusion
The Fed is still raising interest rates, so we could continue to see pressure on this fund and the entire fixed-income space. However, I suspect that we are now closer to the end of the rate hiking cycle than the beginning. As we’ve seen already, yields have come down substantially.
Ycharts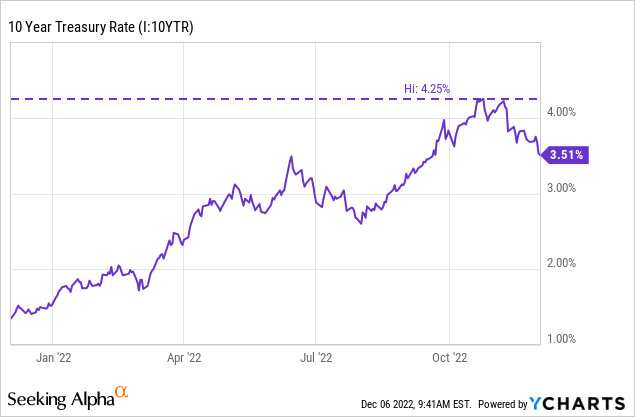
Whether this reversal sticks or not is yet to be seen. For an investor that is more patient, they could continue to hold off investing in anything and wait to get a clear signal. For other investors, utilizing a dollar-cost averaging approach is also an option. I invest a little bit every month, so that’s the route I take to construct my portfolio overall.


Be the first to comment