

Brandon Bell
By Valuentum Analysts
At Valuentum, we use discounted cash-flow analysis (“DCF”) as the bedrock of our process. However, we also use relative valuation and technical and momentum indicators and blend that into an output called the Valuentum Buying Index rating, or the VBI rating.
Our process starts with discounted cash-flow analysis, evaluates the relative valuation characteristics of the company, and then assesses technical and momentum indicators to derive a rating between 1 and 10 (10=best) for each company in our coverage universe.
The center of the Venn diagram above, the Valuentum Buying Index (VBI) combines rigorous financial and valuation analysis with an evaluation of a firm’s technicals and momentum indicators to derive a rating between 1 and 10 for each company (10=best). Because the process factors in a technical and momentum assessment after evaluating a firm’s investment merits via a rigorous DCF and relative-value process, the VBI attempts to identify entry and exit points on what we consider to be the most undervalued stocks. (Image Source: Valuentum)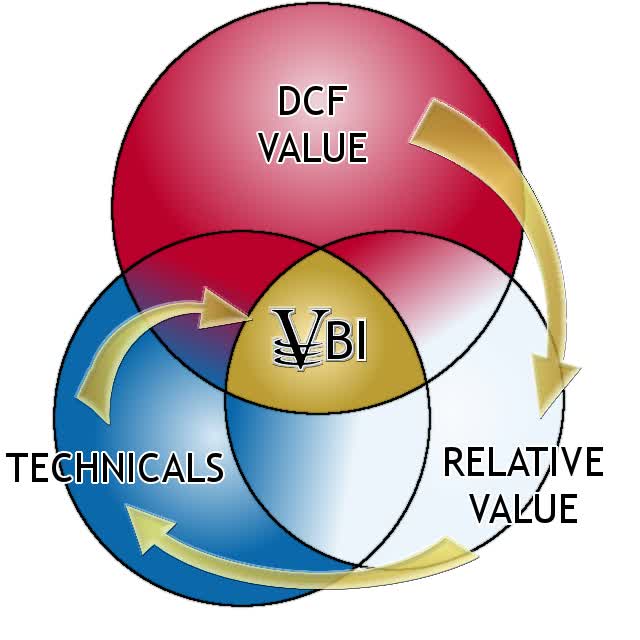
The flow chart on how we rank stocks in our coverage universe. (Image Source: Valuentum)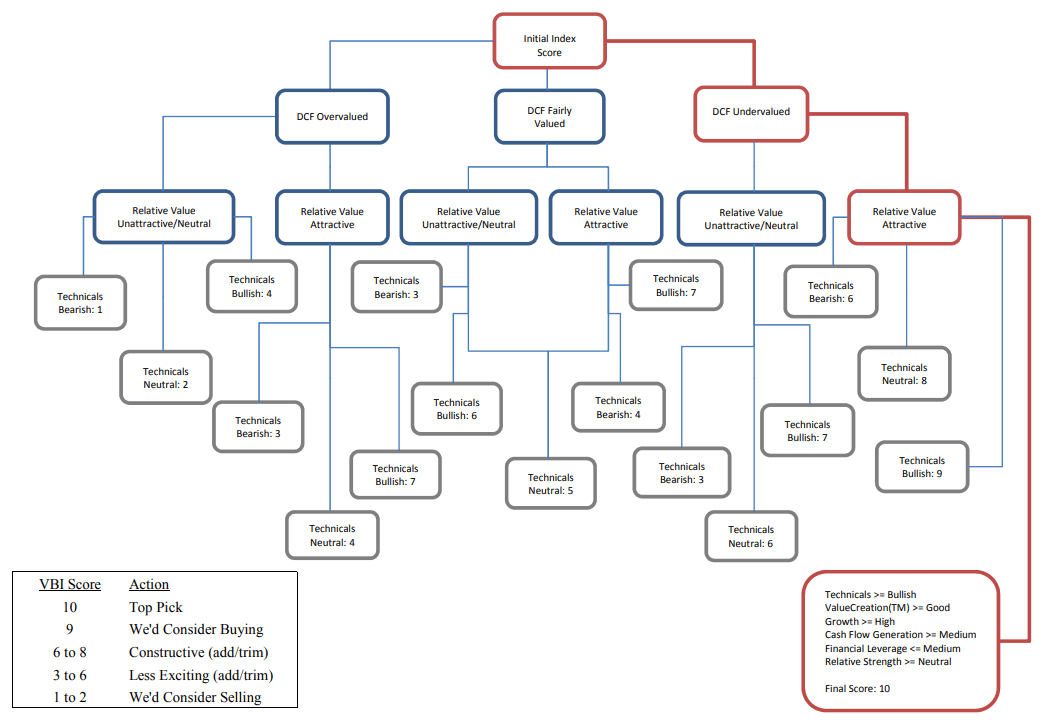
Domino’s Pizza, Inc. (NYSE:DPZ) currently registers a 4 on the Valuentum Buying Index on the basis of three of its key investment considerations that we’ll talk about soon (DCF Valuation, Relative Valuation, and Technical Evaluation). This rating means we’re relatively neutral on shares (“less exciting”) in the context of the market environment, but we still believe Domino’s makes the cut for inclusion into our simulated Best Ideas Newsletter portfolio.
But why? Well, we use the Valuentum Buying Index to source ideas for the simulated Best Ideas Newsletter portfolio, but other considerations such as strong free cash flow generating capacity, a strong balance sheet, as well as solid secular growth prospects are very important, too — and this is where Domino’s is a slam dunk!
Portfolio information as of published date in top, left corner of table above. The Best Ideas Newsletter portfolio is not a real money portfolio. Past results are not a guarantee of future performance, and actual results may differ from simulated information provided. There is substantial risk associated with investing in financial instruments. (Image Source: Valuentum)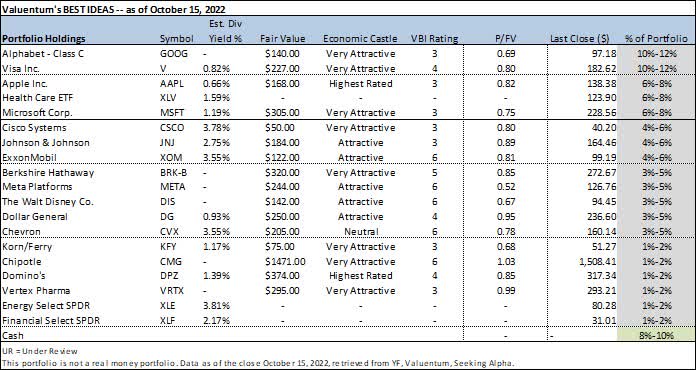
With that backdrop clearly stated, let’s now dig into our fundamental, cash flow and valuation analysis of Domino’s Pizza.
Domino’s Pizza Key Investment Considerations
Image Source: Valuentum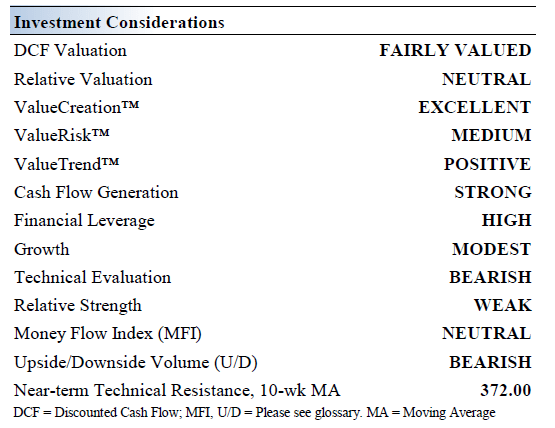
Domino’s Pizza is the number one pizza delivery company in the U.S., based on reported consumer spending. The firm also has a leading international presence and ranks as one of the largest pizza companies in the world, based on number of units and sales. Domino’s has 18,000+ units operating in over 90 markets, and ~98% of its stores are franchised.
While Domino’s generates meaningful free cash flows, it also carries a large net debt load. We see that burden as manageable, but caution that its annual interest expenses could become quite burdensome should the firm stumble.
Domino’s sees room to add 15,000+ incremental restaurant locations to its operations across its 15 top markets worldwide. Its growth runway is extensive in both developed and developing markets. In the U.S., Domino’s forecasts it could grow its total store count up to around 8,000, a nice jump from current levels.
We like the franchise-oriented business model and global focus of Domino’s. Its impressive pricing power has helped offset growing inflationary headwinds seen of late, to a degree. Its top-notch digital platform and home delivery operations represent key competitive advantages for the company.
Domino’s return on invested capital is simply a sight to see. If it is not the greatest value-generator in our coverage universe, it certainly is within the restaurant space. We expect continued new store growth. Domino’s is a great growth story.
Domino’s Pizza Economic Profit Analysis
The best measure of a firm’s ability to create value for shareholders is expressed by comparing its return on invested capital [ROIC] with its weighted average cost of capital [WACC]. The gap or difference between ROIC and WACC is called the firm’s economic profit spread. Domino’s Pizza’s 3-year historical return on invested capital (without goodwill) is 186.4%, which is above the estimate of its cost of capital of 7.8%.
As such, we assign Domino’s a ValueCreation rating of EXCELLENT. In the chart below, we show the probable path of ROIC in the years ahead based on the estimated volatility of key drivers behind the measure. The solid grey line reflects the most likely outcome, in our opinion, and represents the scenario that results in our fair value estimate. A focus on improving ROIC gives Domino’s an attractive Economic Castle rating.
Return on Invested Capital (Image Source: Valuentum)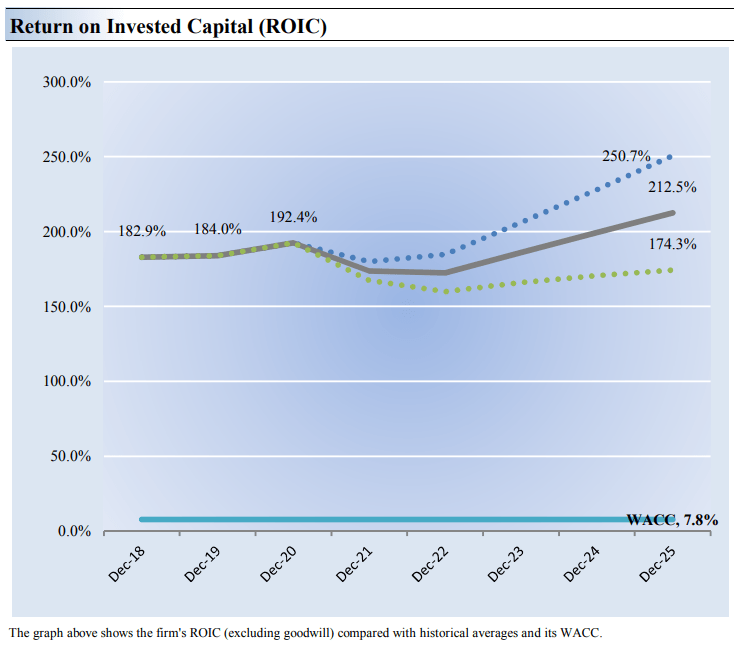
Domino’s Pizza Cash Flow Valuation Analysis
Image Source: Valuentum
We think Domino’s Pizza is worth $369 per share with a fair value range of $277-$461. Shares are trading at ~$320 at the time of this writing. The margin of safety around our fair value estimate is driven by the firm’s MEDIUM ValueRisk rating, which is derived from an evaluation of the historical volatility of key valuation drivers and a future assessment of them.
Our near-term operating forecasts, including revenue and earnings, do not differ much from consensus estimates or management guidance. Our model reflects a compound annual revenue growth rate of 5.7% during the next five years, a pace that is lower than the firm’s 3- year historical compound annual growth rate of 13.9%.
Our model reflects a 5-year projected average operating margin of 18.2%, which is above Domino’s Pizza’s trailing 3-year average. Beyond year 5, we assume free cash flow will grow at an annual rate of 3.2% for the next 15 years and 3% in perpetuity. For Domino’s Pizza, we use a 7.8% weighted average cost of capital to discount future free cash flows.
Domino’s Pizza Margin of Safety Analysis
Image Source: Valuentum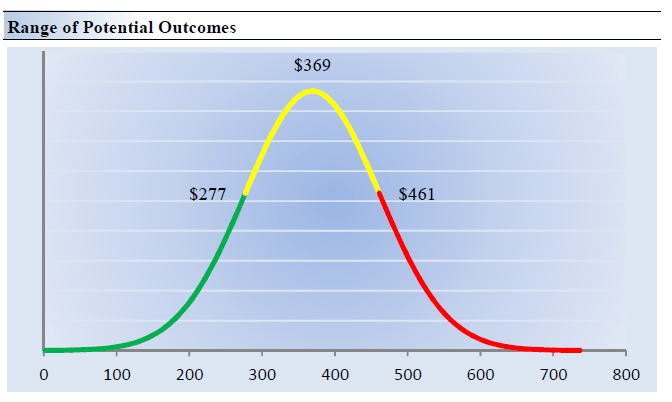
Our discounted cash flow process values each firm on the basis of the present value of all future free cash flows. Although we estimate the company’s fair value at about $369 per share, every company has a range of probable fair values that’s created by the uncertainty of key valuation drivers (like future revenue or earnings, for example). After all, if the future were known with certainty, we wouldn’t see much volatility in the markets as stocks would trade precisely at their known fair values.
Our ValueRisk rating sets the margin of safety or the fair value range we assign to each stock. In the graph above, we show this probable range of fair values for Domino’s Pizza. We think the firm is attractive below $277 per share (the green line), but quite expensive above $461 per share (the red line). The prices that fall along the yellow line, which includes our fair value estimate, represent a reasonable valuation for the firm, in our opinion.
Why We Love the Discounted Cash Flow [DCF] Model
The image above shows how the theoretical underpinnings of the P/E ratio rest in enterprise valuation. The numerator is the enterprise valuation model, which arrives at a per-share fair value estimate (price), while the denominator is next year’s earnings per share (EPS). (Image Source: Value Trap)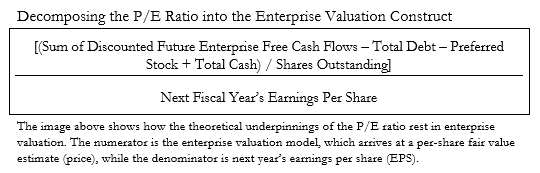
The discounted cash flow [DCF] model gets a lot of criticism these days, but it’s still the best way to look at companies. For starters, we may never know, or rather can never know, with precision the exact intrinsic value of a stock because of the forward-looking nature of forecasts and the subjective substance of estimating discount rates, among other future considerations. To be successful, the analyst, however, does not have to know the true intrinsic value with precision.
The goal of enterprise valuation in stock analysis, or valuation approaches in equity investing, more generally, is not to pinpoint precisely what a company’s stock is worth. This is impossible. Where most criticisms of enterprise valuation rest is that the output of the process, the fair value estimate, is very sensitive to several key future assumptions and forecasts.
However, the very idea that those future forecasts are difficult to predict is consistent with the concept of pricing volatility, as future market expectations iterate over and over again, and logically defines enterprise valuation as an important causal pricing framework. Market volatility can be explained in part by changes in expected growth rates, interest rates, tax rates and other key drivers of the enterprise process.
That these assumptions are ever-changing and that prices are ever-changing is an important logical link. If, on the other hand, everybody knew the future, and therefore, the exact intrinsic value of stocks, we wouldn’t see much volatility in the markets at all. Stocks would, or rather should, trade at their “known” fair values. The fair value estimate sets the anchor for prices.
In some ways, it is the imprecision and sensitivity of enterprise valuation that may offer a core analytical advantage. In evaluating the sensitivities of certain drivers behind the company to changes in forward assumptions, one gets a feel for the valuation impact of a change in a particular driver. For example, a one percentage point change in the mid-cycle operating-margin assumption for a company such as Amazon (AMZN) could have widespread implications on an intrinsic value estimate given the company’s significant earnings leverage and sensitivity to small changes in its operating margin.
The same one-percentage point change in the mid-cycle operating-margin assumption for a company such as Microsoft (MSFT), however, could be immaterial. The analytical inferences of assessing such sensitivities not only explains how changes in value occur, their drivers, but also why the share prices of some stocks are more volatile than others as a result.
To focus on precision in value estimation is folly, and it is neither the goal nor even the endeavor to pursue precise value estimation, as it is unreasonable to believe that even the most talented analysts can get every future assumption “correct” within the enterprise framework. Even if the analyst did get everything “correct,” the stock price may still not fully converge to that estimated intrinsic value if the market simply disagrees.
Incidentally, this is why paying attention to the information contained in share prices matters, even for value-focused investors (more on this later). In instances where price-to-estimated fair value convergence may never occur, however, it still is helpful to use the enterprise valuation framework to understand the drivers behind security pricing, and to arrive at a better understanding of the behavior of a subset of active management, or those that apply extensive discounted cash-flow modeling as a key driver of buying and selling activity, which causes price changes.
It should not reduce the utility of enterprise valuation even if one fully embraces the criticism that the future enterprise free cash flows of an entity will always be unpredictable to varying degrees. The future enterprise free cash flows of consumer staples stocks such as Coca-Cola (KO) or Kimberly-Clark (KMB) may be steadily growing, and analysts may be able to estimate such future enterprise free cash flows with only a very slight margin of error when they are reported.
On the other hand, the future enterprise free cash flows of a fast-growing Internet-darling such as Meta Platforms (META) or Alphabet may result in a much larger disparity between future projections and actual results when they come in. Therefore, it is only reasonable to assume that the analyst may require a much larger share-price discount to estimated intrinsic value in considering an investment in Meta Platforms or Alphabet than for Coca-Cola or Kimberly-Clark.
The concept of a margin of safety is well-documented in the writings of Benjamin Graham and the works of his student Warren Buffett. A stock trading at $50 per share, for example, but estimated to be worth $100 per share may offer the investor an adequate margin of safety because, even if the true intrinsic value of the company is $75, the large difference between price and the estimated fair value offers the investor a very important safety-net against losses.
Whether the market ever comes to price the stock at $75, however, is another thing altogether, and a consideration that makes observing price activity and the information contained in prices all the more relevant. Graham and Buffett’s margin-of-safety framework can be further extrapolated to view equity valuation in the context of a range of fair value outcomes or a cone of fair value possibilities, with the fair value estimate being the most likely probability along a fair-value distribution function.
For example, it may not necessarily be accurate to say that a company is worth precisely $25 per share, when the stock is likely worth somewhere between $20-$30 per share, and it may not be truly undervalued or overvalued, respectively, until it breaches these bounds around the fair value estimate. But why? Well, an analyst can only estimate what a company’s future enterprise free cash flow stream will look like.
Certain factors will hurt that enterprise free cash flow stream relative to forecasts, while other factors will boost performance relative to expectations. That’s how a downside fair value estimate and an upside fair value estimate could be generated to form a fair value estimate range of $20-$30 in this instance. Value can never be a precise point fair value estimate because the future cannot be predicted with precision.
The discounted cash flow model gets a lot of criticism these days, but it is the best way to estimate the intrinsic value of a company, in our view. Multiples suffer as they use single-year snapshots of a particular metric, and those that use multiples make all the assumptions of a DCF in one fell-swoop because every multiple can be expanded to a DCF. Those that use multiples instead of the DCF may not even know they are implicitly using the DCF whenever they assign a multiple to a stock!
Let’s introduce a multiple choice question to hammer home why the DCF is better than multiples? What is wrong with enterprise-value-to-EBITDA (EV/EBITDA)?
A. price-observed multiple, not value-derived
B. only uses single-year snapshot of fundamental anchor
C. it has no long-run or normalized considerations
D. EBITDA is not a good measure of enterprise free cash flow
E. all of the above
Answer in the comments section, and let’s discuss!
Concluding Thoughts
Our fair value estimate of Domino’s on the basis of our discounted cash-flow model is $374 per share, which is north of its last closing price. We like to use a margin of safety in our process given the range of fair value outcomes that are derived with respect to future assumptions.
One of Domino’s biggest strengths comes from its franchise-oriented business model. That allows the firm to run an asset-light balance sheet with modest capital expenditure requirements. From fiscal 2019 to fiscal 2021, its annual free cash flows averaged ~$0.5 billion while its annual dividend obligations averaged ~$0.1 billion during this period. The firm has done a stellar job building up top-notch home delivery and digital operations, which supports its same-store sales growth trajectory over the long haul. While Domino’s outlook is bright, we caution competing uses of capital, namely share buybacks, weigh negatively on its dividend growth outlook.
Though there is a lot to like about Domino’s, its balance sheet remains bloated. We caution that as of the end of fiscal 2021, its net debt load stood at ~$4.9 billion (inclusive of short-term debt, exclusive of restricted cash). Domino’s also has significant operating lease liabilities on the books to be aware of. We view Domino’s net debt load as manageable given its high quality cash flow profile, though should the company stumble, its annual financing expenses could become quite onerous. Domino’s operates in an incredibly competitive industry. Staying on top of shifting consumer preferences and running effective marketing campaigns are top priorities for the company. All things considered, however, Domino’s is one of our best ideas.
This article or report and any links within are for information purposes only and should not be considered a solicitation to buy or sell any security. Valuentum is not responsible for any errors or omissions or for results obtained from the use of this article and accepts no liability for how readers may choose to utilize the content. Assumptions, opinions, and estimates are based on our judgment as of the date of the article and are subject to change without notice.
Be the first to comment