

gchapel
While there might be some blood in the water for S&P-500 (SPY) names with moderate fear and worried investors, the producers in the Gold Miners Index (GDX) have been torn to shreds, and it’s a feeding frenzy with blood everywhere. There’s so much damage and broken spirits that we look to be between the panic stage and complete despondency. This is the result of the GDX’s 45% decline, which has likely left many investors that are either leveraged or holding low-quality names unable to look at their portfolios out of disgust.
Normally, the large-cap names can buck this trend slightly and give up ground more grudgingly than the index. However, in Barrick’s (NYSE:GOLD) case, the stock has underperformed the GDX since Q3-20, sliding 50% from its highs. This has left this high-quality and diversified business trading at just ~6x cash flow and ~0.80x P/NAV, a valuation typically reserved for a struggling or highly indebted business. However, under CEO Mark Bristow, Barrick has a strong balance sheet, and its project pipeline has rarely ever looked better. Therefore, I see this pullback in the stock as a gift for patient investors.
Cortez Complex Operations (Company Presentation)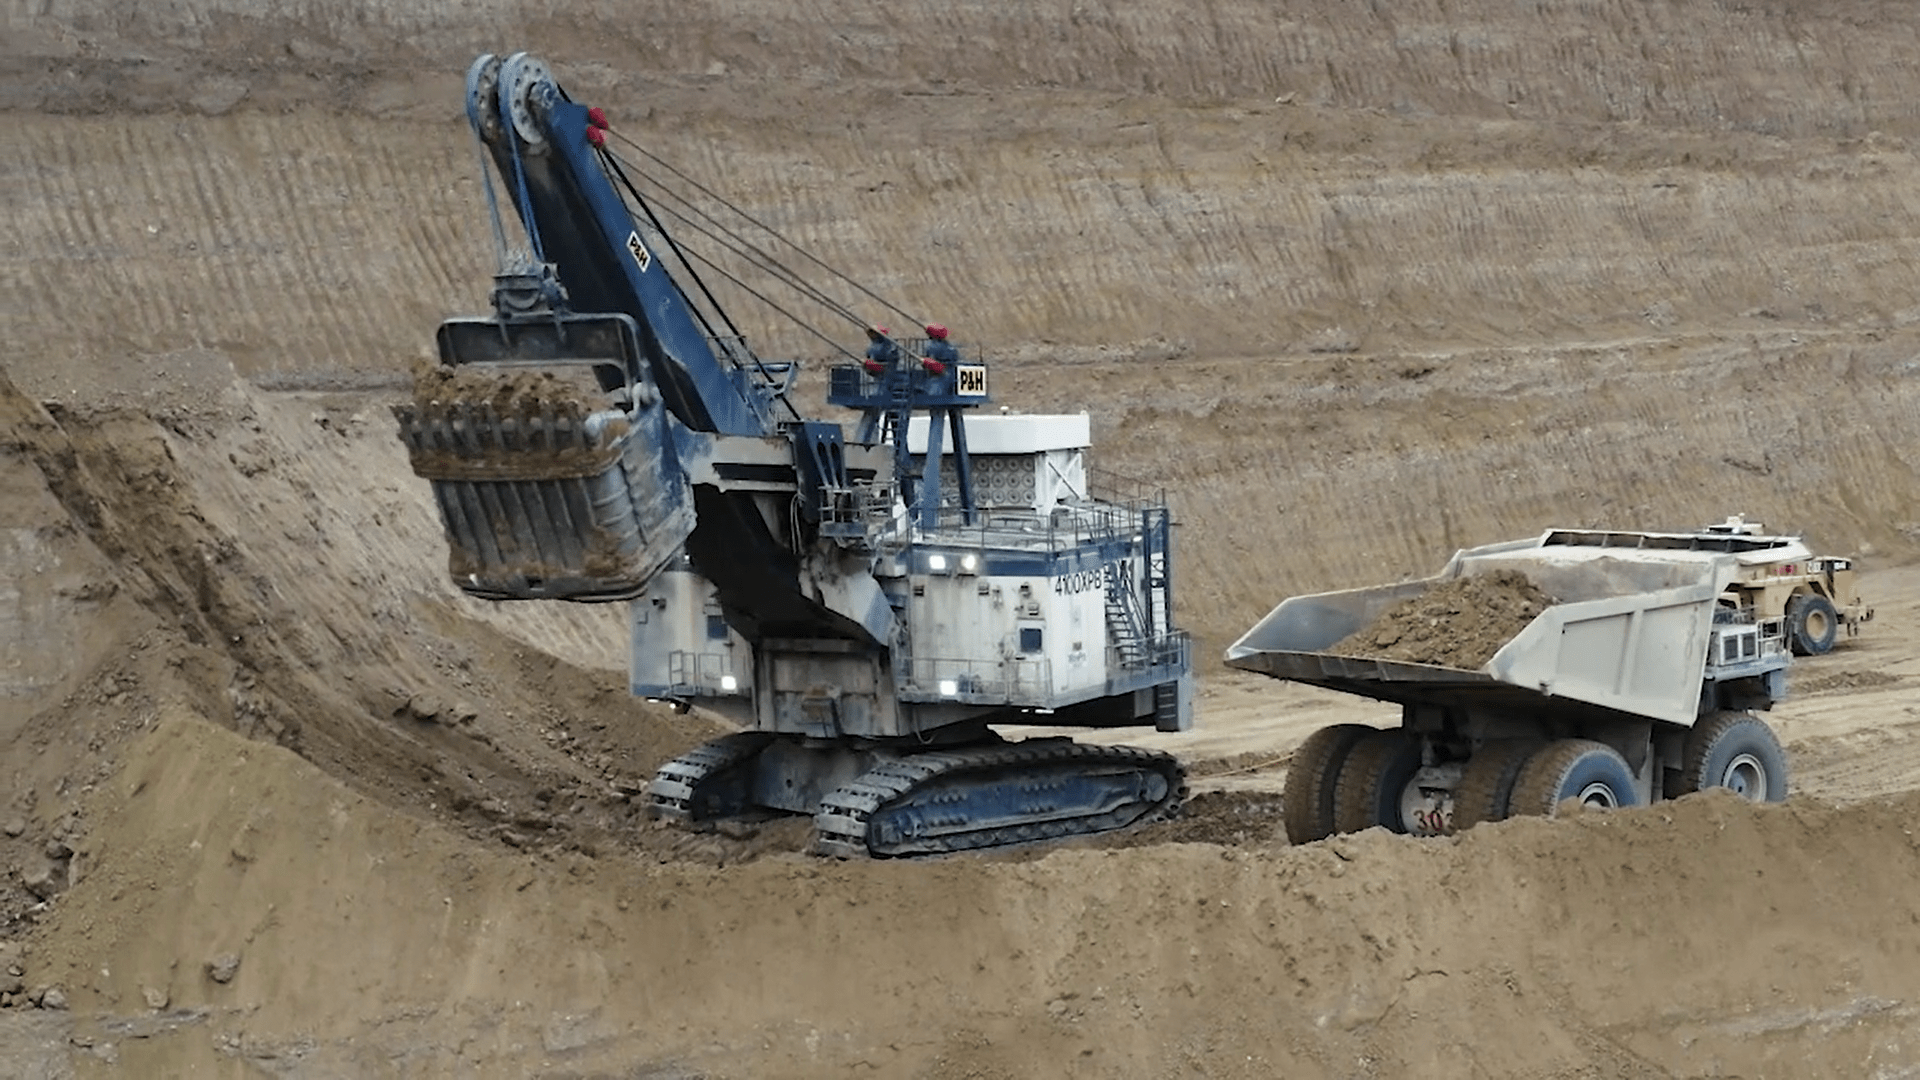
Q2 Production
Barrick Gold (“Barrick”) released its preliminary Q2 results this week, reporting quarterly production of ~1.04 million ounces, a marginal increase from the year-ago period. This was driven by a strong quarter out of Nevada with ~462,000 attributable ounces produced, a much stronger quarter from Veladero (~58,000 ounces), and another phenomenal quarter at Loulo-Gounkoto, which produced ~140,000 ounces. The strong production from these assets was offset by Hemlo, which continues to lag, and a softer quarter from Pueblo Viejo, with just ~105,000 attributable ounces produced.
Barrick Gold – Quarterly Gold Production (Company Filings, Author’s Chart)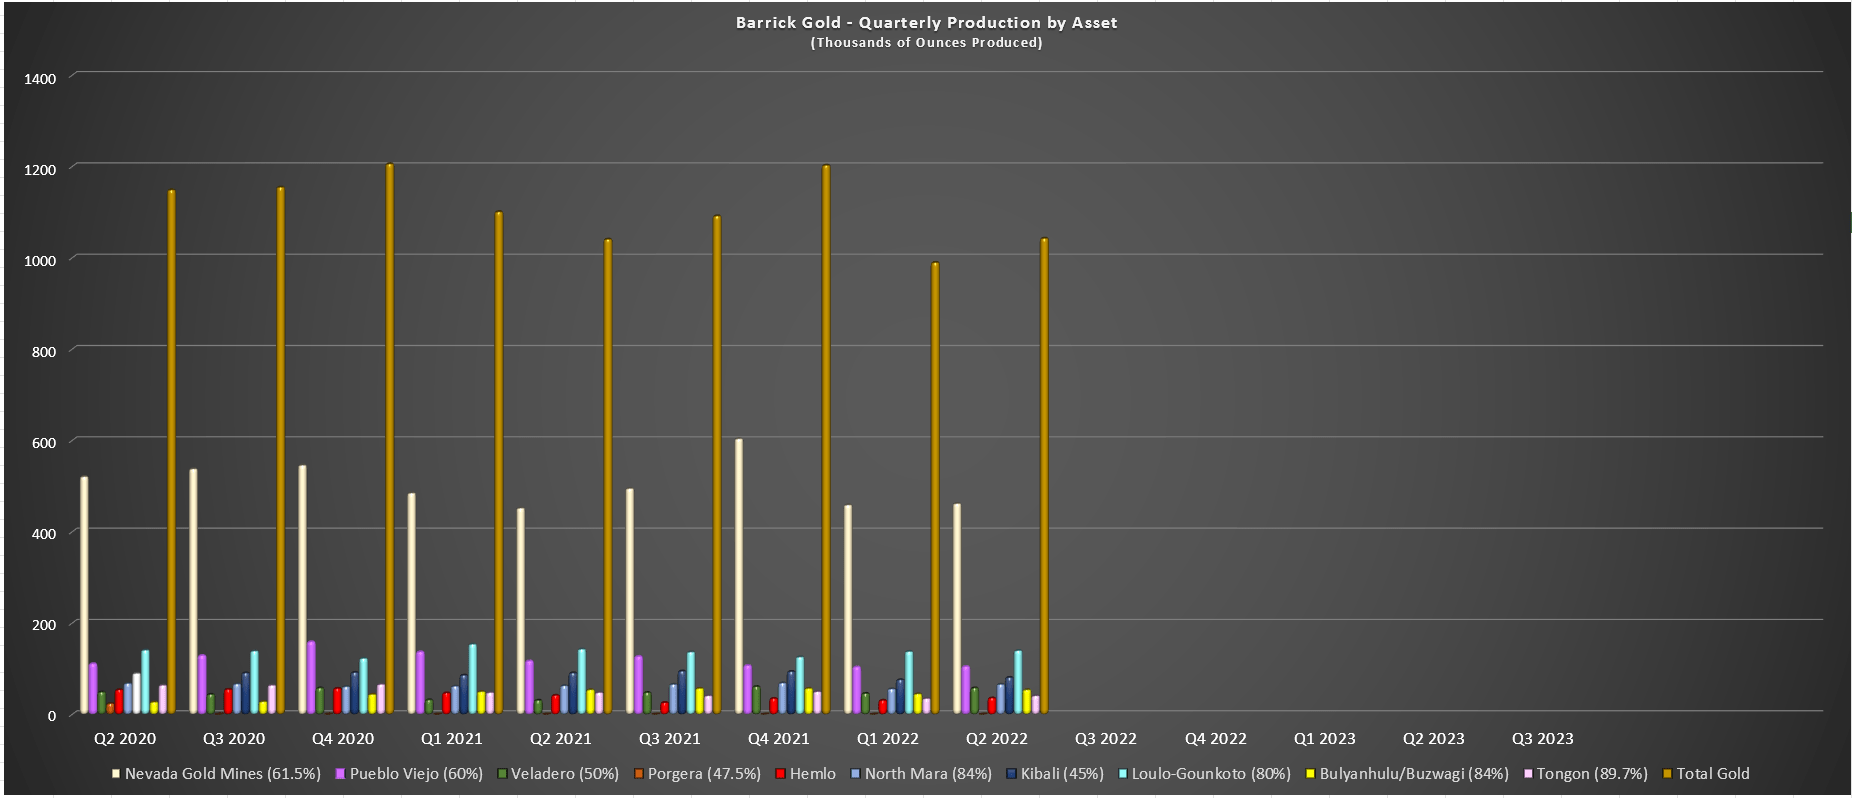
Based on year-to-date production of ~2.03 million ounces, some investors might be worried about Barrick’s ability to meet its guidance of 4.2 to 4.6 million ounces of gold. However, it’s important to note that the company is expecting a roughly 47/53% split for H1 vs. H2 production, which would place the company on track to deliver into guidance, and tracking only slightly behind its guidance mid-point of 4.4 million ounces of gold. While this might be discouraging for some investors, with the potential for Barrick to see another year of declining production (2021: ~4.44 million ounces produced), it’s important to note that next year should mark a change in trend.
Barrick Gold – Quarterly Gold Production & 2023 Estimated Run Rate (Company Filings, Author’s Chart & Estimates)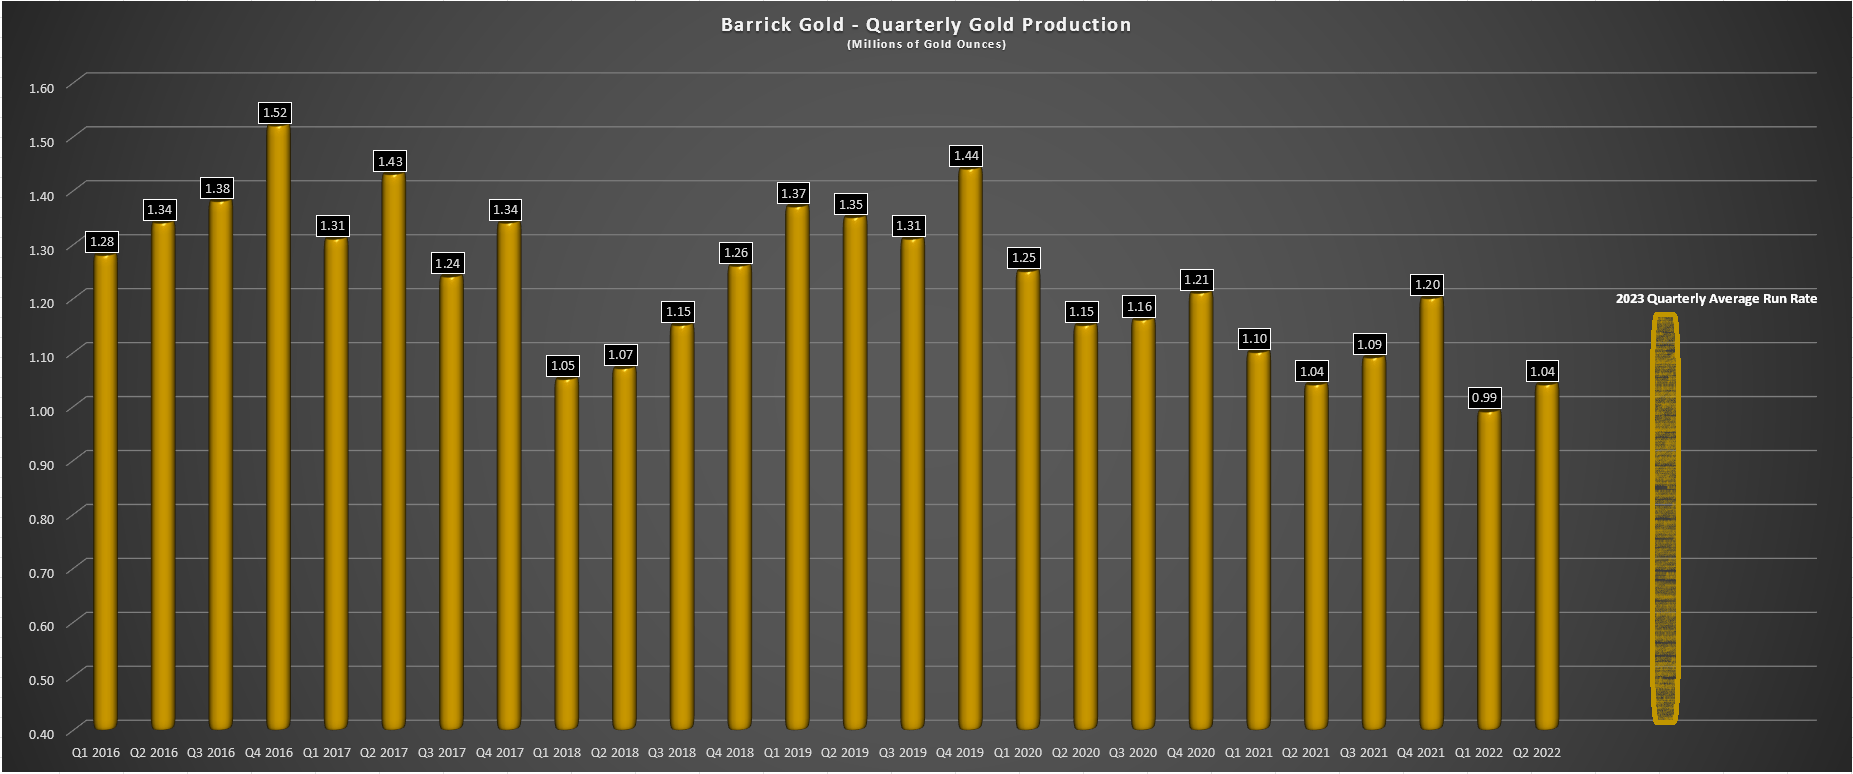
This is because Barrick should be able to produce at least 4.65 million ounces next year, with Porgera expected to return to commercial production by Q2 2023 and higher production from its Cortez Complex. This will push the company’s quarterly average production rate back to ~1.17 million ounces of gold, and at the same time, Barrick should benefit from lower all-in sustaining costs. Meanwhile, on the copper side of its business, production is expected to increase to more than 470 million pounds (FY2022 guidance mid-point: ~445 million pounds), translating to a mid-single-digit increase here as well. Higher copper production will be attributed to increased production at Lumwana and Zaldivar.
So, while investors might look at the H2 results and be relatively unimpressed, it’s important to note that this was the higher capex portion of the year and the lower production portion of the year. This means that operating costs should dip in H2 2022 as production increases, with Barrick set up for a very strong second half. Therefore, investors should be most focused on 2023 and the long-term picture, which points to potential growth later this decade with key projects set to begin contributing. These include Reko Diq (gold-copper), Goldrush, potential growth at the Carlin Complex from Ren and North Leeville, and further upside from Cortez at Fourmile/Cortez Hills Underground (Hanson Target).
Barrick – Nevada Targets (Company Presentation)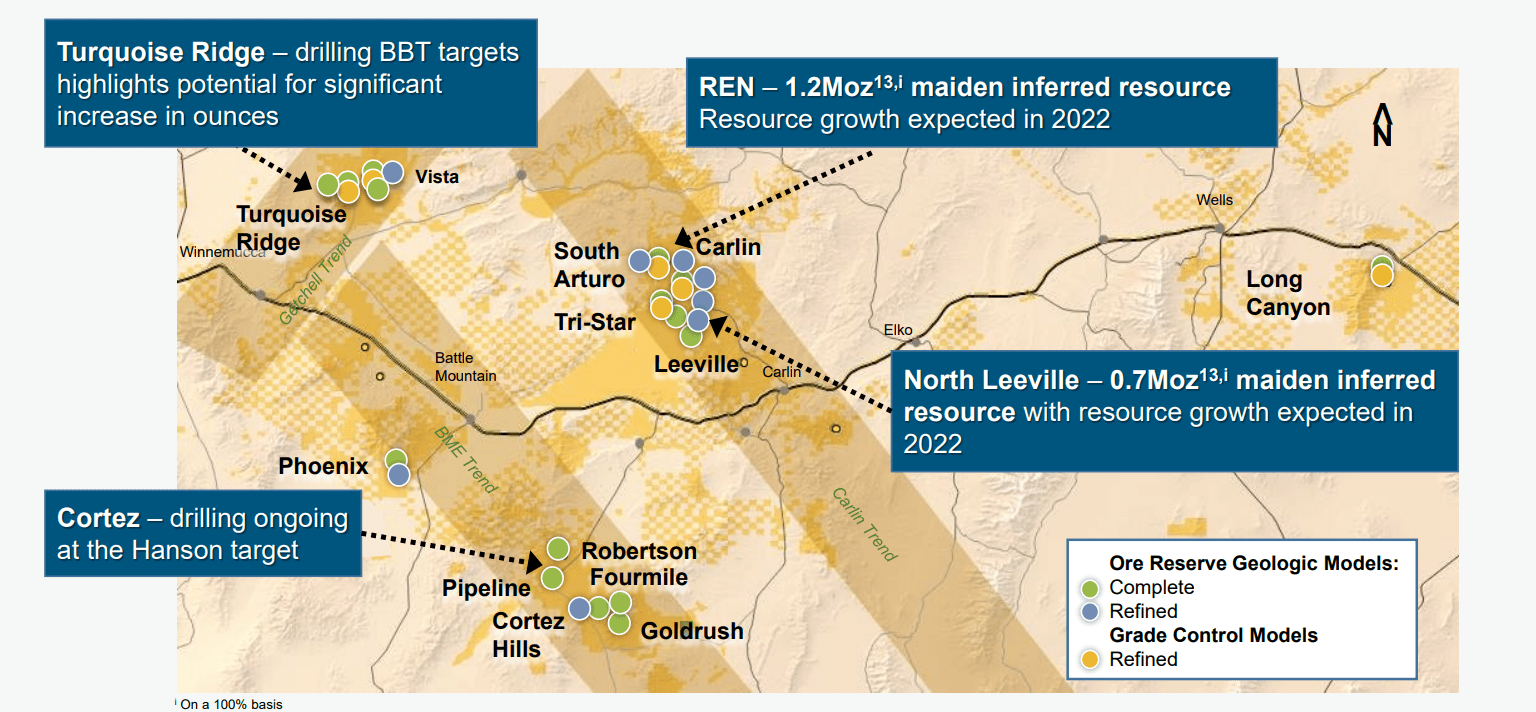
Metals Prices
Unfortunately, this brighter future and the operational excellence under new CEO Mark Bristow have been overshadowed by recent gold and copper price weakness. This has led to a less robust margin outlook for Q3 2022, with the average realized gold price expected to dip to sub $1,800/oz if it can’t recover, down from $1,871/oz in Q2 2022. Meanwhile, Barrick’s average realized copper price could slide below $3.50/lb, down from an average realized price of ~$3.75/lb in Q2 2022.
Gold Futures Price (TC2000.com)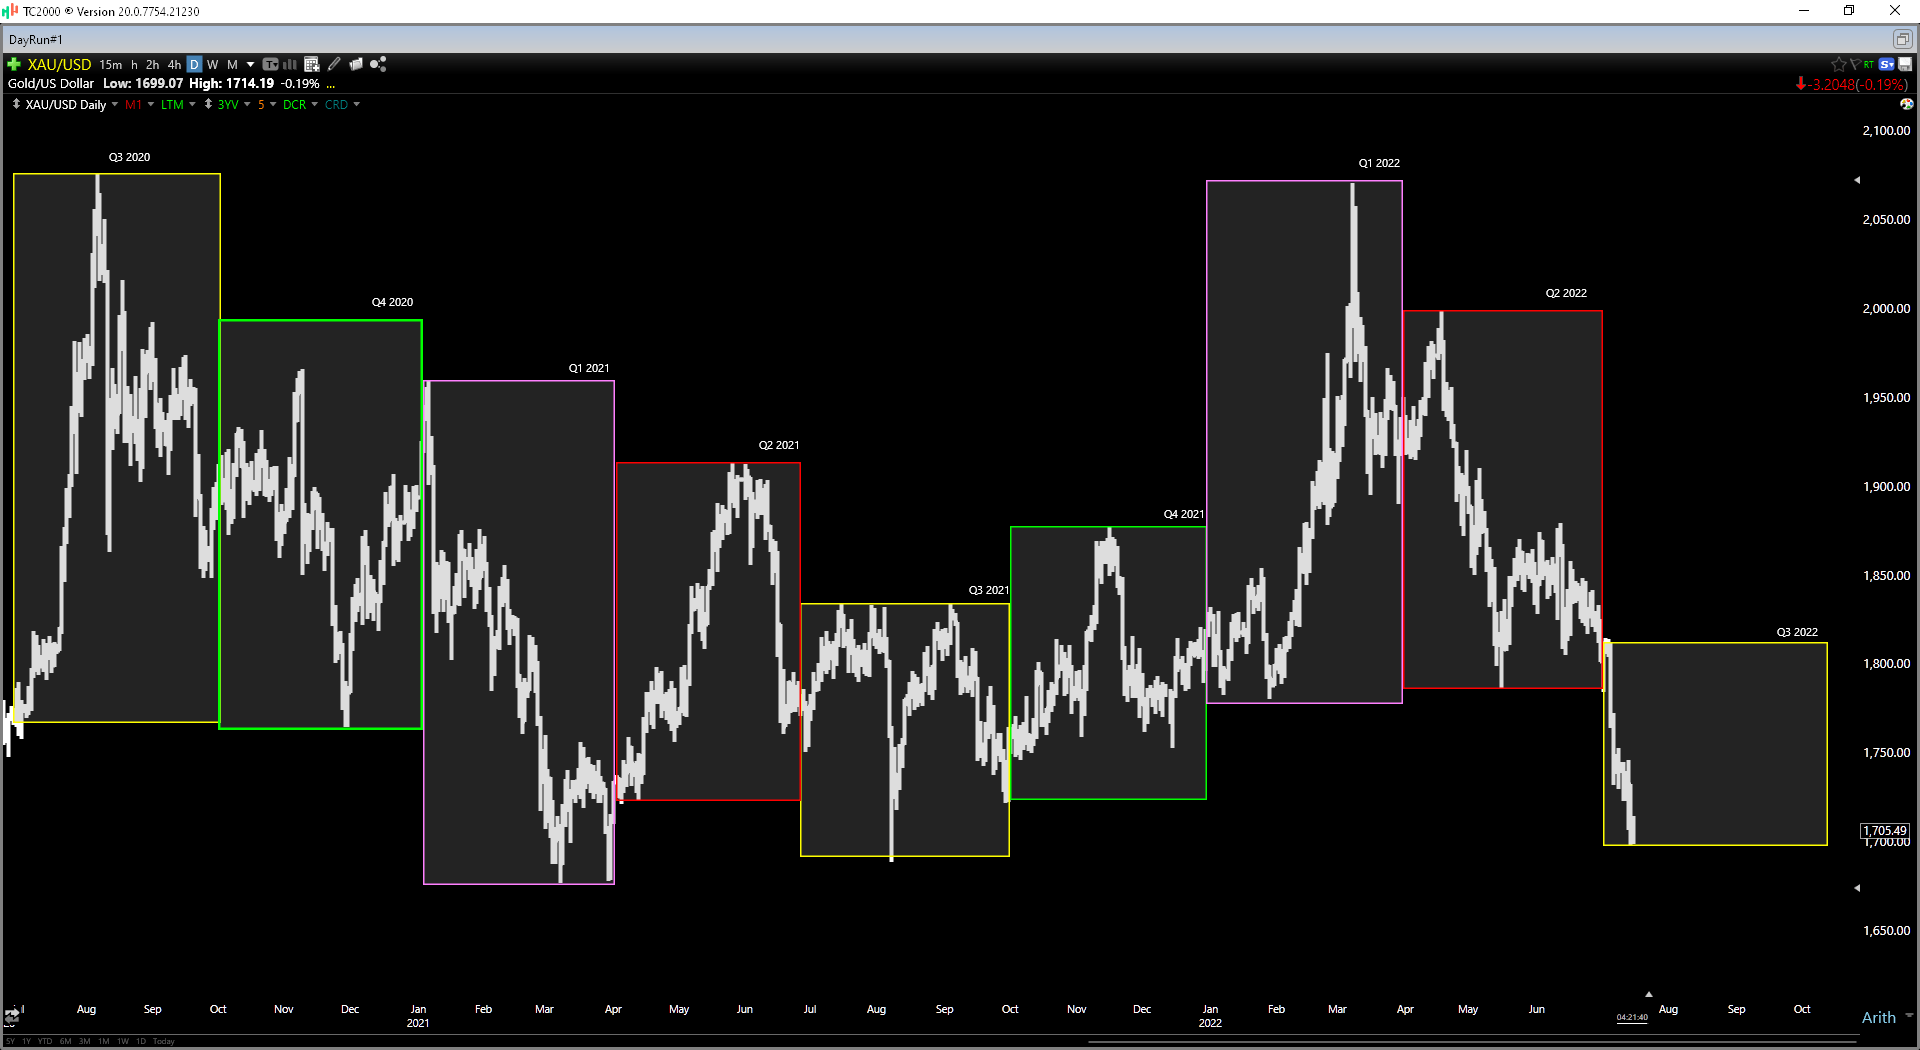
Although this recent weakness is not ideal, it’s worth noting that Barrick is still enjoying solid margins at current prices. This is because it has expected all-in sustaining cost margins of ~$700/oz for gold ($1,830/oz gold price assumption for 2022) and $1.05/lb for copper (~3.90/lb copper price assumption for 2022). These margin figures translate to ~38% AISC margins and ~27%, respectively, allowing Barrick to ride out this downturn easily. The reason is that it benefits from economies of scale (multiple Tier-1 mines), a large supplier network, and the ability to invest in technology and innovation to make its mines leaner. Finally, its balance sheet is in great shape, with ~$800 million in net cash.
When it comes to smaller producers with relatively small operations that are moving low-grade material, like Argonaut Gold (OTCPK:ARNGF), their margins are razor-thin, and further weakness in the gold price could complicate things considerably. The same goes for producers like Great Panther (GPL), Pure Gold (OTCPK:LRTNF), and McEwen Mining (MUX) which have high-cost operations, weak balance sheets, and can’t even meet guidance when they set the bar merely inches off the ground. However, even though Barrick is relatively insulated from this downturn, it’s being sold off like a small-cap stock with flimsy margins, which is unjustifiable.
World Gold Production (Nrcan.Gc.Ca)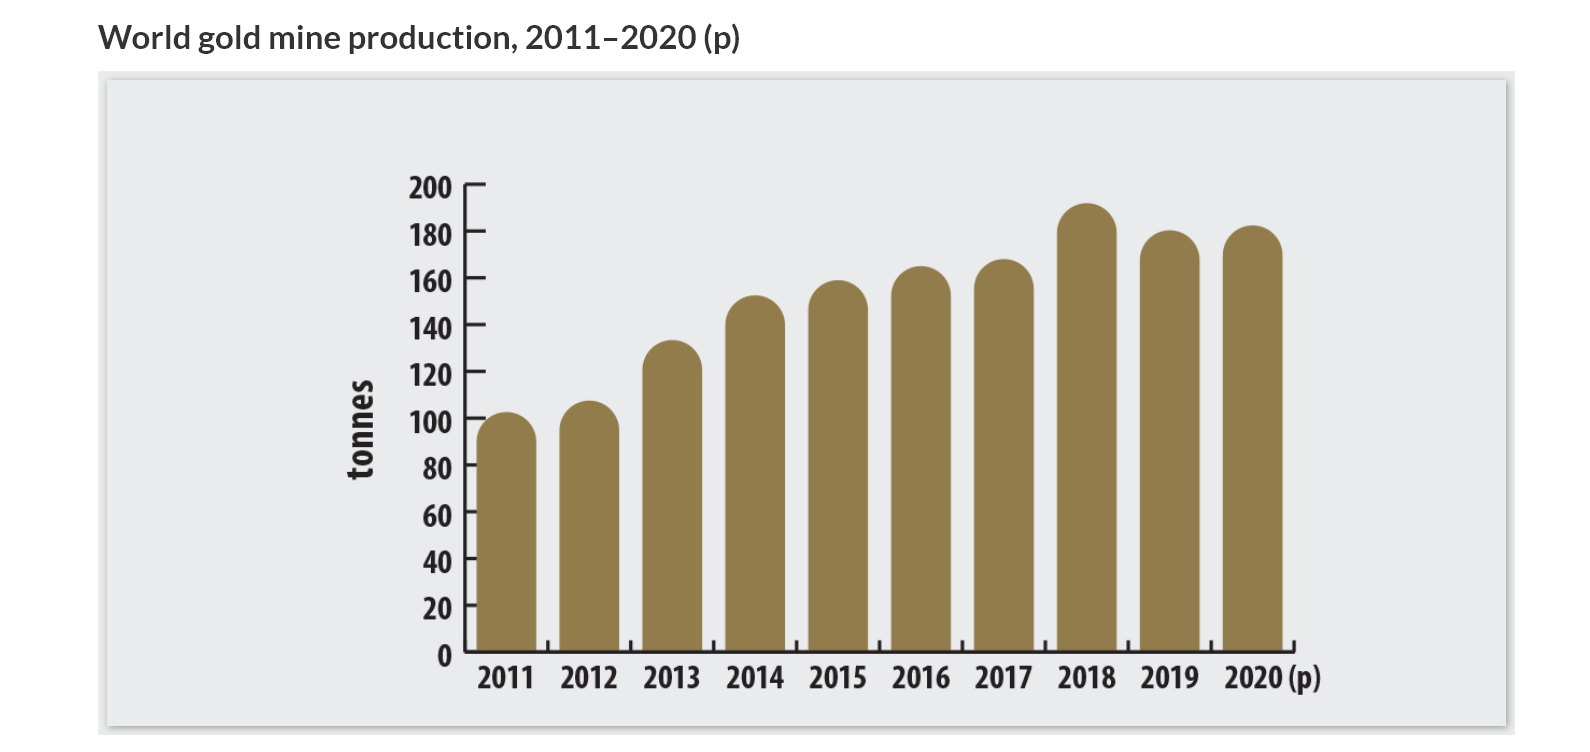
While no one long this sector likes downside volatility in the gold price, I would argue that the recent gold price weakness is a positive for the sector. This is because it could lead to peak gold production. The reason is that several operators that can’t keep costs down or haven’t invested enough in the past few years to create sustainable operations might be forced to move their operations into care & maintenance. This is because inefficient operations can be masked by a $1,900/oz gold price, enabling management to keep doling out salaries to themselves even while destroying shareholder value.
Unfortunately (for these companies), they will have a much harder time camouflaging themselves among profitable producers going forward because the wheat of the industry quickly gets separated from the chaff when the gold slides by this magnitude. This is especially true given the inflationary pressures sector-wide, which have pulled operating costs/capex up at a much higher rate than in previous years.
Smaller producers putting up ~150,000 or fewer ounces per annum might not seem that significant in the grand scheme of things (110+ million ounces produced each year). However, there are several marginal producers, and adding them together could make up a fraction of global gold production. In addition, there are several projects that look great at a $1,900/oz gold price but are much harder to justify at a $1,700/oz gold price. These projects are unlikely to be pursued unless we see a rebound in the gold price.
Finally, we have seen negative developments from a jurisdictional standpoint over the past year. This is evidenced by some South American countries appearing much less friendly towards new investment, and other nations no longer being open for business, with several Western corporations pulling out. This could impact future investment in these countries with considerable geological potential, such as Russia, Colombia, Kyrgyzstan, and Ecuador.
Global Gold Demand (Fortune.com, Will Daniel, World Gold Council)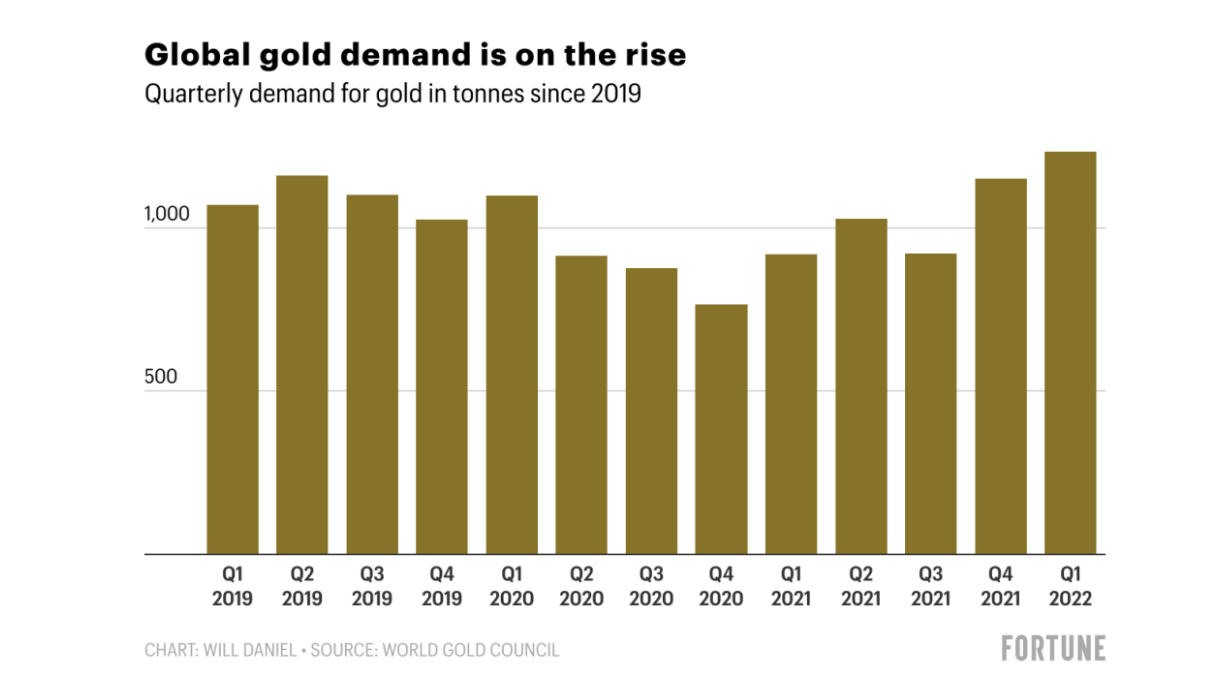
So, while the previous view might have been that we would see global gold production growth from 2022-2026, this is looking less likely. This is because a few of the largest operators may grow production this decade, but this will be offset by several marginal operators forced to curtail production at their least robust assets or pack up completely if they can’t weather the downturn (weak balance sheets). The potential for a flatter trend in global gold production is being met with increasing demand, pointing to a more attractive supply/demand picture for the metal.
It’s important to note that I am not predicting that several producers will close down operations this year simply because the gold price has pulled back to $1,700/oz. However, if the gold price cannot regain the $1,800/oz level and stay above here, and with many producers having all-in costs above $2,000/oz, there’s only so long that they will be able to keep the lights on. This is especially true given that many of them aren’t (and have not been) investing an adequate amount in growth capital anyways, nor in drilling to build up their reserves.
Based on this, I believe that producers that can keep the lights on even at $1,300/oz and are run by successful and experienced management should command a premium multiple. This is because they’re the only ones that are investable, allowing investors to gain leverage to the gold price without risk, unlike marginal names that could be reduced to penny stocks if they don’t figure out how to run their mines more efficiently. However, despite Barrick meeting this criterion (high margins, steady production, conservative reserve price assumptions) and the supply/demand picture for gold looking better at these prices, the stock is trading at its lowest valuation metrics in years.
In my view, this suggests that investors in Barrick are panicking and selling the stock because they paid too much and can’t stomach the drawdown; they don’t properly understand the business, or they don’t know why they invested in the first place. If they did, they would realize that they’re selling the stock at a ~10% free cash flow yield while the company is aggressively buying back stock, leading to a steady increase in cash flow and net asset value per share.
Valuation
Based on an estimated ~1,760 million shares outstanding at year-end and a share price of US$15.50, Barrick now trades at a market cap of ~$27.3 billion, despite being on track to generate over $4.5 billion in operating cash flow this year ($2.55 per share). This leaves the stock trading at just ~6x operating cash flow, cheaper than where it traded in March 2020 and at its September 2018 lows. The difference is that this time around, the stock is paying a more than 4.0% dividend yield, sitting on a net cash position of close to $1.0 billion, and is clearly more disciplined than in the past, not rushing in to acquire companies at premium valuations, like some companies made the mistake of doing last year.
Barrick has historically traded at ~10.3x cash flow, placing its fair value at $26.30 per share, a 70% upside from current levels. I believe a cash flow multiple of 11 can easily be justified, but even under more conservative assumptions (10.3x cash flow), there’s clear value in the stock at current levels. This is especially true on a forward basis, with the company on track to generate up to ~$5.0 billion in cash flow next year, benefiting from its Porgera Mine in Papua New Guinea returning to commercial production by Q2 2023.
Barrick Gold – Historical Cash Flow Multiple (FASTGraphs.com)
From a net asset value standpoint, Barrick is also dirt-cheap, with an estimated net asset value of $34.4 billion at a $1,700/oz gold price assumption. If we compare this to the company’s market cap of ~$27.3 billion, Barrick is trading at a deep discount to net asset value, sitting at ~0.80x P/NAV. It is very rare for the major producers to trade at a discount to net asset value, and it’s important to note that this incorporates the recent metals price weakness, with a gold price assumption of $1,700/oz. In fact, this net asset value assumes that the gold price makes zero progress over the next decade when it’s historically appreciated at more than 3% per annum.
Barrick – Share Buybacks (SEDI Insider Filings)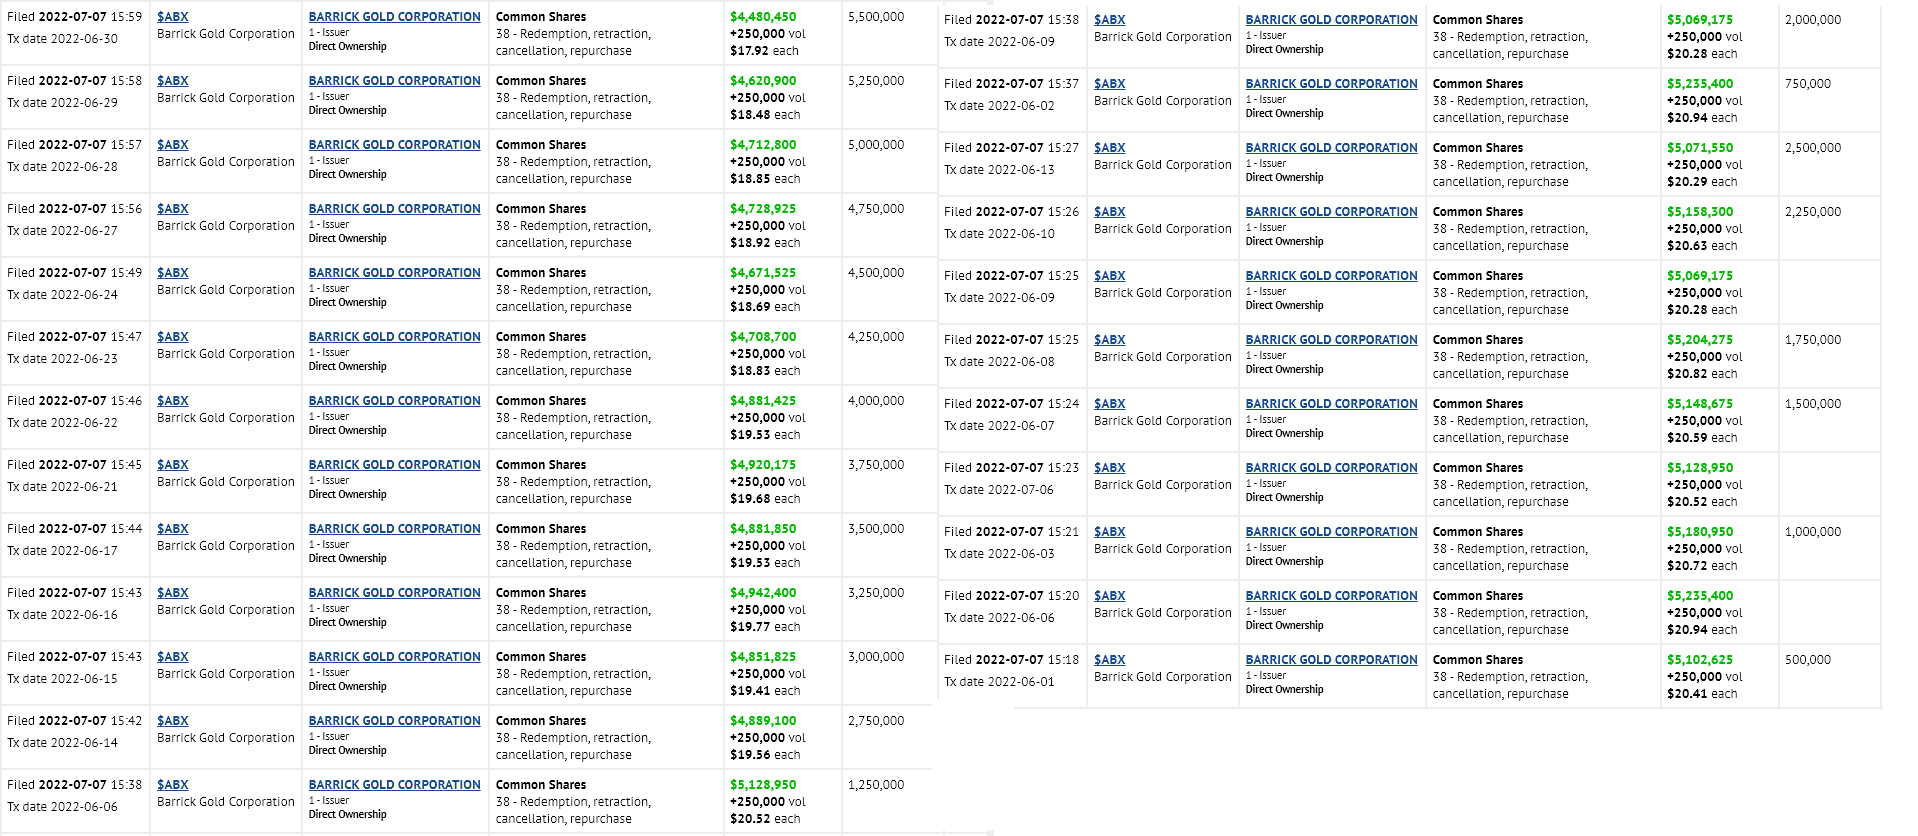
Fortunately, Barrick has unveiled a new tool to deal with market volatility and is not sitting and watching its share price plunge from the sidelines without any way to defend the irrational selling this time around. This is because the company has put a share buyback program in place, and it’s been very active, buying back 8.5 million shares or approximately 0.50% of its float between May and July at prices ranging from $17.90 to $21.80. Based on the ~$180 million in share repurchases to date, Barrick appears to have more than $800 million left on its share buyback program. With the share price now even lower, I would expect the company to be soaking up shares in the open market, given the stock’s deep discount to fair value.
At current values, the company could buy back ~50 million shares, or another 3% of its float.
Summary
While the major miners may continue lower short-term if the gold price remains under pressure, the goal for an investor should be to diversify one’s portfolio with high-quality businesses when they’re being given away and no one wants them. With Barrick trading at ~6x cash flow, ~0.80x P/NAV, and sporting a ~4.0% dividend yield, the company is the most attractively valued it’s been in years. To summarize, I see this as a rare opportunity to start a position with limited downside.
Be the first to comment