

maradek/iStock via Getty Images
Duff & Phelps Select Income Fund (NYSE:DNP) is one of the closed-end funds that investors swear by. The primary reason is of course the unfettered distribution stream that goes back over three decades. DNP has not cut its distribution, and on Seeking Alpha, you can find some great arguments as to why they’re likely to maintain this going forward. We are here to take the other side.
The Fund
The fund primarily invests in a diversified portfolio utilities equities, bonds and preferred shares. DNP’s primary investment objective is current income. It also states that it aims for long-term growth of income, though distribution increases have not come by in recent times. DNP states that capital appreciation is a secondary objective and as we shall see, it’s highly improbable that it will remotely produce that from this point.
DNP is one of the larger closed-end funds with $4 billion plus of investment exposure. DNP uses decent amounts of leverage, which is about in the middle of the range for closed end funds.
CEF Connect DNP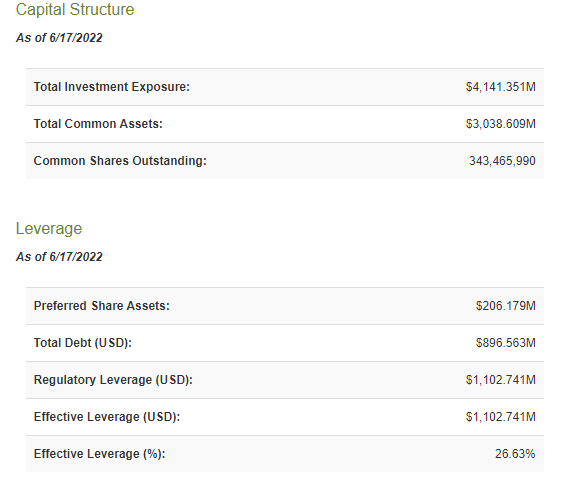
Expense ratio of 1.77% is not unusual for the fund, but that ratio is likely to rise in the years ahead as interest expenses move up.
CEF Connect DNP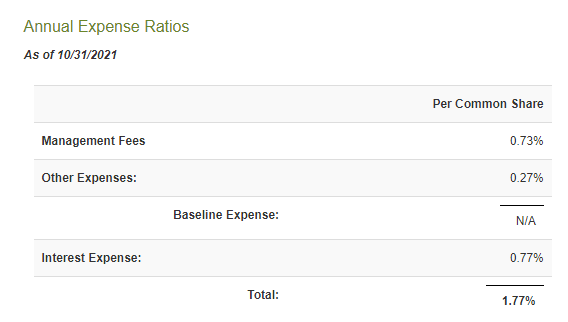
Holdings
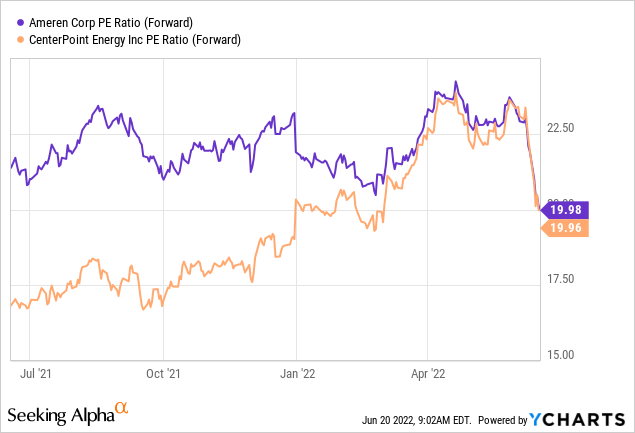
The fund at last check had about 85% invested in utilities with stocks like Ameren Corp. (AEE) and CenterPoint Energy, Inc. (CNP) gracing the top 10.
CEF Connect DNP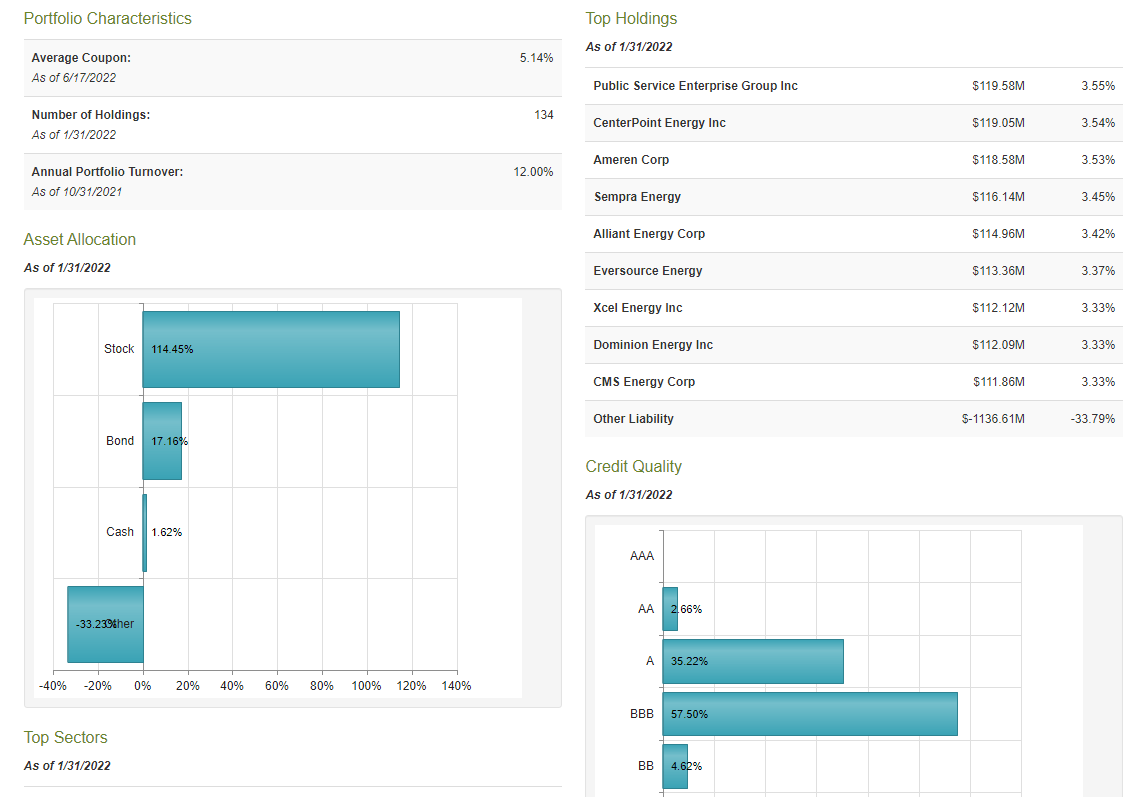
Bond investments were primarily of investment-grade and portfolio turnover was extremely low.
Performance
DNP’s longer-term performance has been excellent with the fund delivering 175.1% total returns over the last decade. This was about in line with Utilities Select Sector SPDR (XLU), but the fund did far better than Reaves Utility Fund (UTG) and BlackRock Utilities, Infrastructure & Power (BUI).
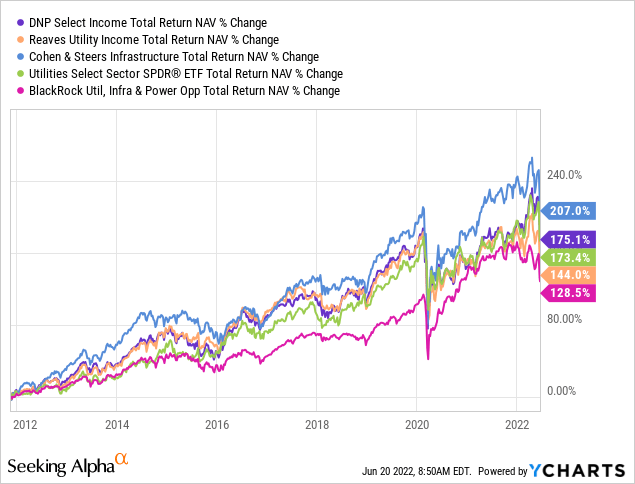
One might wonder why we are giving credit to a CEF for doing as well as an ETF. The rationale behind that is the very large set distribution by DNP does make it harder to manage the same returns. XLU is not handicapped by that requirement. Cohen & Steers Infrastructure Fund (UTF) was one which did exceedingly well, and we will address that at a future time.
Why We Think The Next 5 Years Will Make It Hard To Sustain Distributions
DNP is beholden to the utilities sector and its fate will depend on how the sector does. In trying to assess what the sector will deliver, we have to see four factors.
1) The Current Valuation
2) The Final Valuation
3) Dividend Yield
4) Earnings Growth (also a proxy for dividend growth)
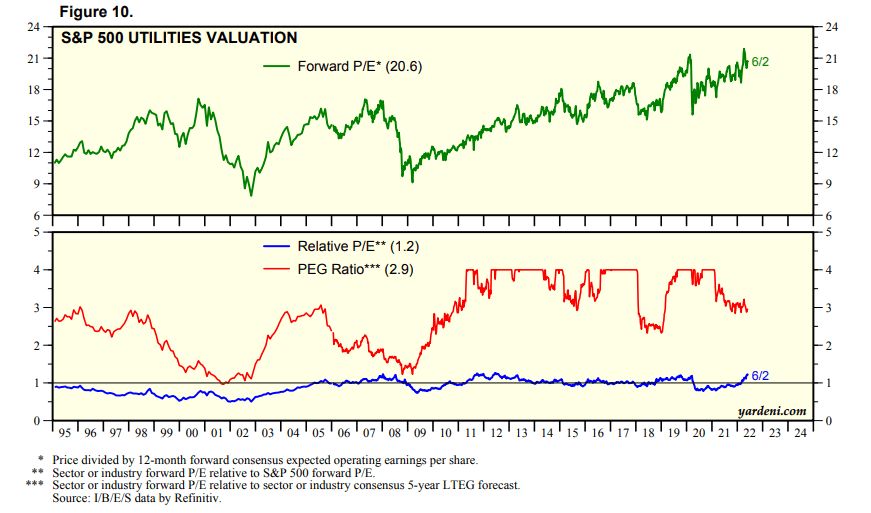
The current valuation is high. The sector trades at close to 19X-20X forward earnings.
This multiple is understated as analysts are generally behind the curve at turns. They have not priced in inflationary pressures or interest rate increases which will play a role at refinancing.
In terms of the final valuation, say about five years later, we would look for a 14X-15X multiple. This is hardly an unusual number and the forward P/E over the last three decades has been about 14X.
The sector dividend yield is easy to pull up, and XLU’s dividend yield is a good proxy.
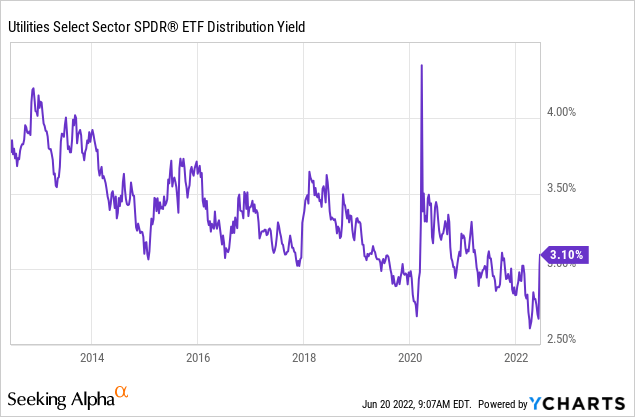
XLU’s numbers tend to lag and don’t immediately incorporate announced dividend increases, so we can use about 3.25% here. Finally, we can look at earnings growth rate for the sector, and here’s where we will take a radically different stand than most. We think the sector will really struggle to deliver even a 2% earnings growth from here. We will see multiple level pressures from inflation and pushbacks from regulatory bodies approving rate hikes. Pinnacle West Capital Corporation (PNW) may be an extreme case, but one that is well worth examining. The change in benchmarks by Arizona regulatory boards means that the $5.47 in earnings of 2021, will not be surpassed even in 2026.
Seeking Alpha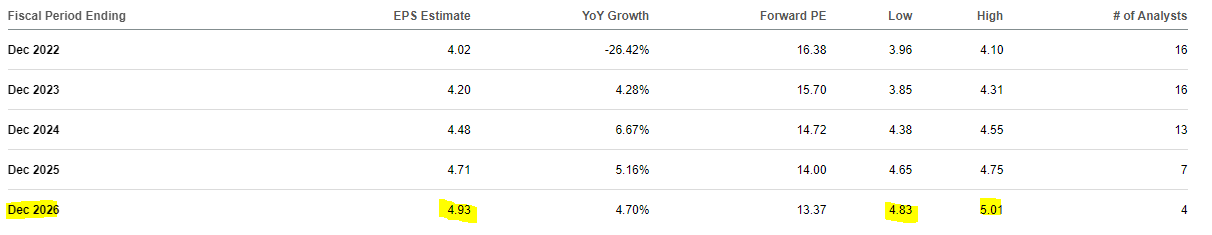
We expect a lot more of that coming down the line. Refinancing debt at higher rates will also suck the wind out of earnings. In fact, we see most utilities having to deleverage, a lot, in this climate. For making our case here though, we’re using a 4% earnings and dividend growth rate, something we see as close to impossible. What we want to show is that even under optimistic conditions, things don’t look too good.
If we use the above set of assumptions, we will get a feel for why the next few years are likely to see very poor total returns for the sector. In our 4% growth scenario, price constricts by 8.75% over the next five years.
Author’s Calculations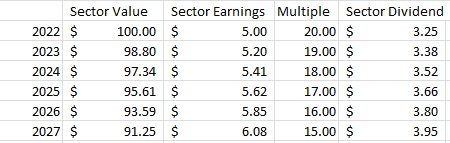
Total returns are positive, thanks to dividends, but we are looking at about 2% total annual returns.
Verdict
If you don’t buy into our sector outlook, then the rest of this is pointless. But if you do, then you have to realize just how outlandish the current distribution yield for DNP is.
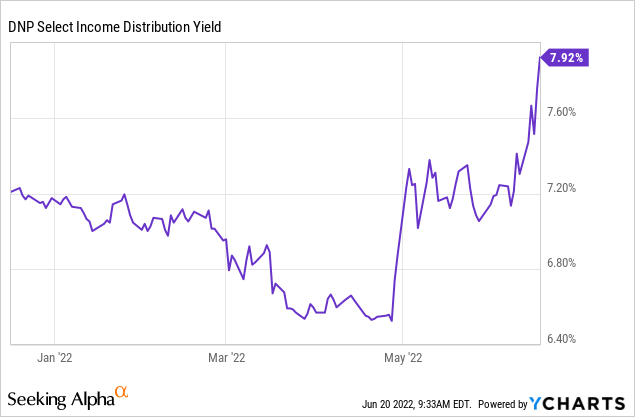
It’s rendered even more outlandish as DNP is trading at an enormous premium to NAV.
CEF Connect DNP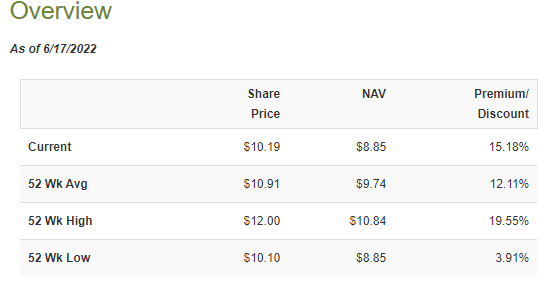
So DNP is distributing about 8.9% on NAV, when our outlook is for about 2% total returns. This should be extremely NAV depleting and will test the mettle of the managers to keep paying out at this rate. Recent distributions have had a high return of capital component.
CEF Connect DNP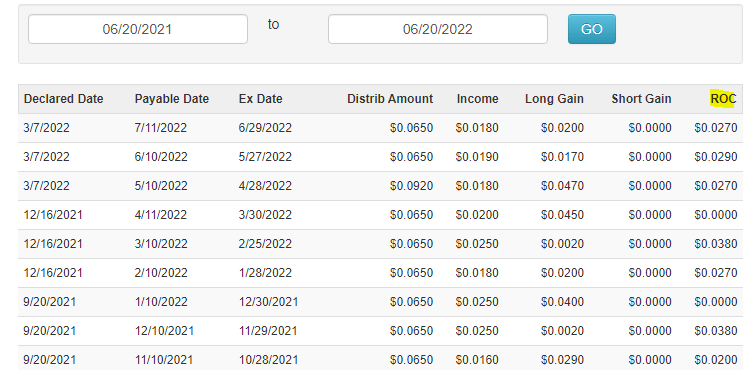
A long time back, this was exclusively all income.
CEF Connect DNP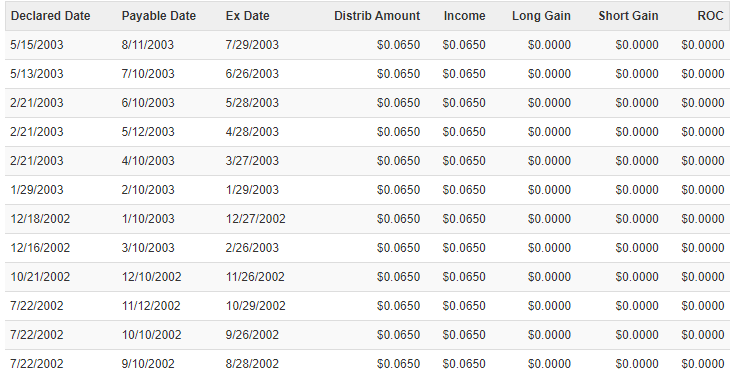
If you think back, utilities traded at single-digit P/E multiples then with 6% yields. With a little leverage, you could get your entire dividend from the underlying holdings. Over time, DNP had to rely increasingly on capital appreciation and valuation expansion. We believe we’re done with that phase and the next few years will prove challenging, at the minimum. Our exercise also stops at a P/E of 15X. Investors can run their own conclusions if the ending valuation reset is like 2002 or 2009. We don’t think the 15% premium to NAV is justified here, and that’s the primary reason for the sell rating. We would look for alternatives for income investing. As dour as our medium to longer-term outlook is, please don’t assume that means the distribution cut is happening next week.
Please note that this is not financial advice. It may seem like it, sound like it, but surprisingly, it is not. Investors are expected to do their own due diligence and consult with a professional who knows their objectives and constraints.
Be the first to comment