

xijian/E+ via Getty Images
Solar energy stocks go through significant boom and bust periods. Right now, though, the Invesco Solar ETF (NYSEARCA:TAN) is simply rangebound. Traders await the next big catalyst to spark a trend. Let’s dive into the solar situation and charts to see where this industry might be headed.
For starters, solar energy is on the rise. As summer starts Tuesday (and the sun angle is most direct), solar energy’s capacity factor is at its highest. RTOs like CAISO, ERCOT, and even the New England ISO have a decent chunk of their power generation coming from solar during the middle of the day. Moreover, EIA data show that solar is the fastest-growing fuel source (on a percentage basis). Wind also is growing fast.
Solar Tailwinds: U.S. Power Sector Generation Mix Changing
EIA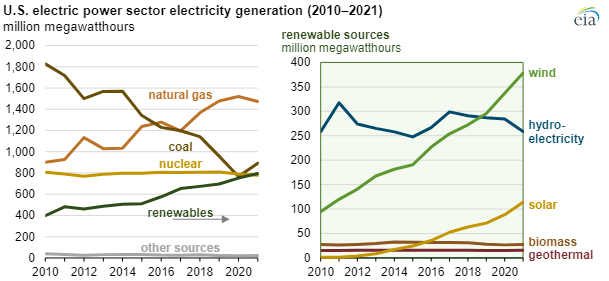
Turning away from the electricity market and back to the financial market, the TAN ETF has been a relative winner of late. The below one-month ETF performance heat map illustrates that TAN is glowing with a 10% advance vs. sharp equity market drops. Solar stocks are higher even as traditional oil and gas and commodities names falter.
One-Month ETF Performance Heat Map: TAN Catches A Bid
Finviz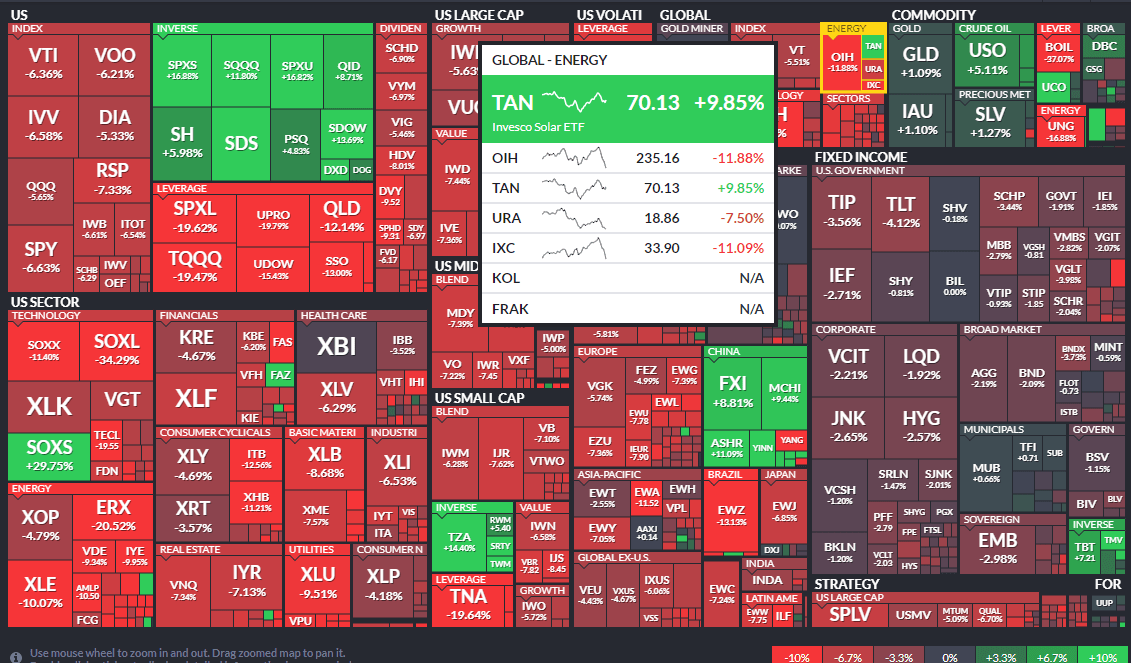
TAN is a concentrated fund. The top two holdings account for nearly 20% of the ETF. It’s important to monitor events and price action with Enphase Energy (ENPH) and SolarEdge (SEDG).
TAN Portfolio: Watch Enphase and SolarEdge
Invesco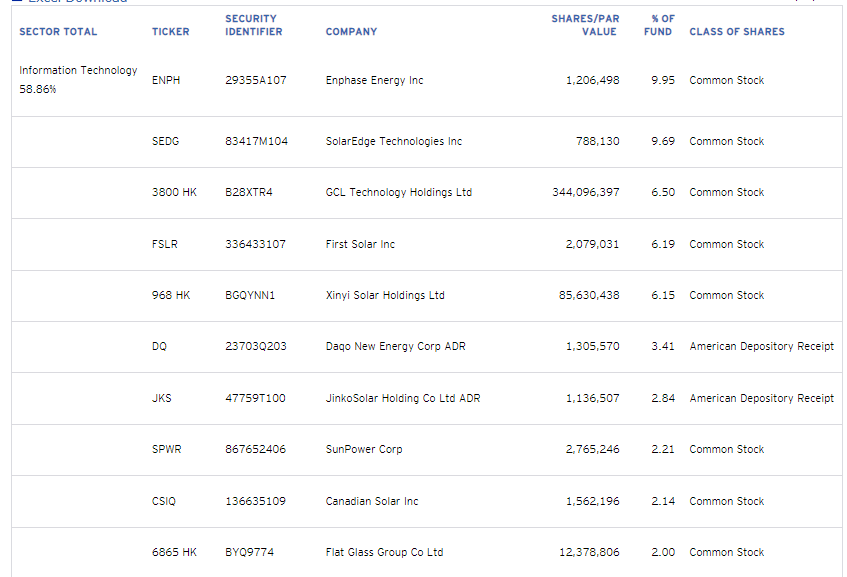
This week, for example, there are a few industry events that could cause volatility in solar names. Wall Street Horizon’s corporate event data show that SEDG has a shareholder meeting Monday, and there’s a pair of renewable energy conferences during the middle of the week. Check them out here and here.
Two Industry Conferences This Week
Wall Street Horizon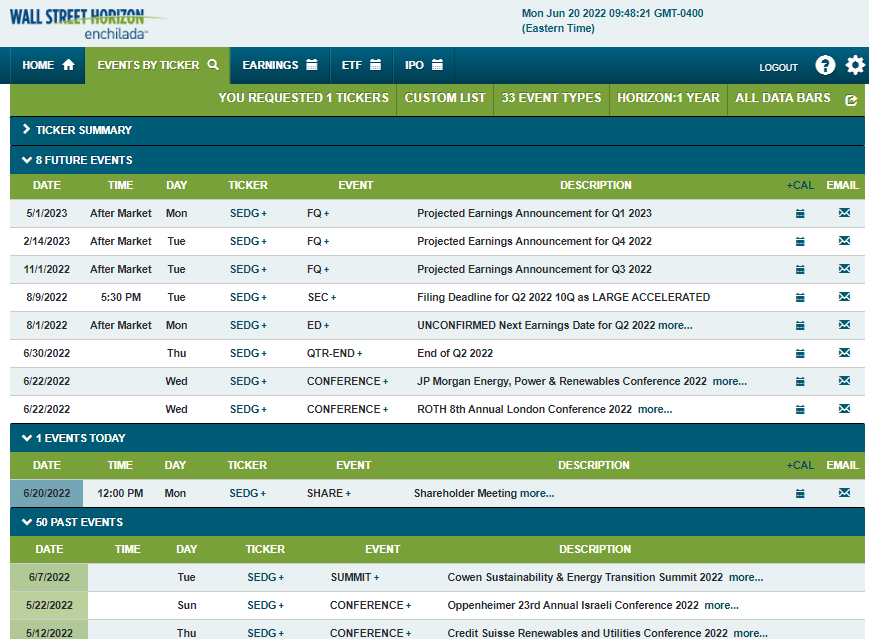
What’s interesting about TAN is that it’s more of an Information Technology fund vs. an Energy play, at least according to Invesco. IT is 59% of the ETF while Utilities represent 24% of TAN. I still contend that the goings-on within the Energy sector are more important, though.
TAN Breakdown: IT and Utilities Sector Exposure, Mainly U.S. and China
Invesco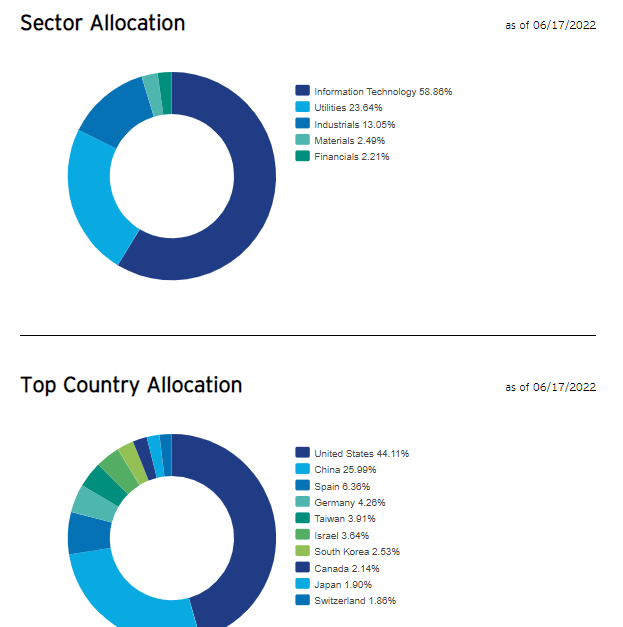
With Tuesday being the solstice, I thought reviewing TAN’s seasonality might be interesting. Indeed, solar stocks tend to do well now through the middle of October. I noticed, however, that 2020’s massive advance contributed to much of the seasonal average trend.
Summer Seasonality Takes A Shine To TAN
EquityClock.com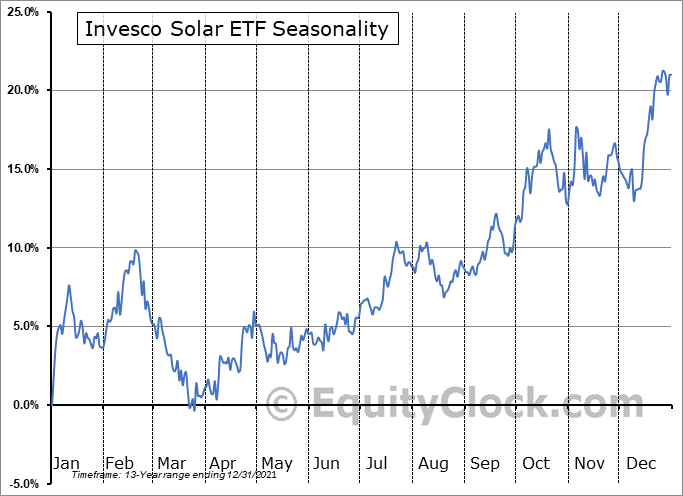
The Technical Take
So, what do the charts say? From a long-term perspective, there’s support near $50. That was the double-top peak from 2014 and 2015. That’s a key spot for long-term investors. Nearer term, there’s a downtrend resistance line that comes into play just above $80.
TAN Long-Term Chart: Solid Support At $50, Recent Downtrend/Consolidation
StockCharts.com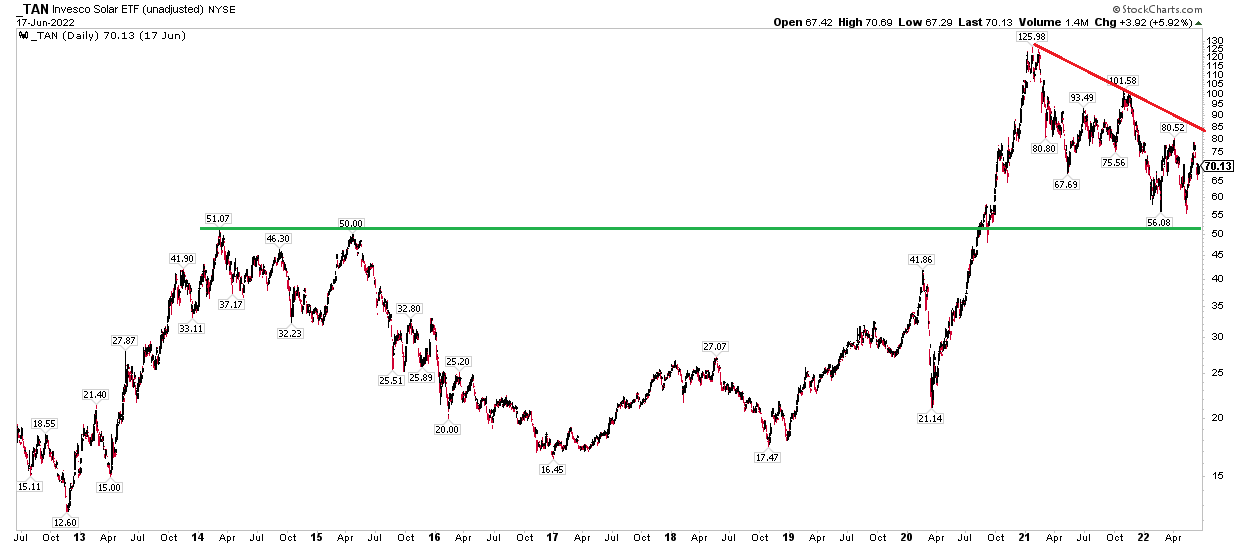
Zooming in, we can find additional support and resistance prices. This year features sideways price action, which is actually relative strength vs. the broader market (but relative weakness vs the Energy Sector ETF (XLE)). TAN bulls want to see a breakout above $80 (which would also be a breakout from the downtrend resistance line on the log-scale chart mentioned earlier). There’s a bullish bottom at $55 for near-term support. A break below that price could lead to a $50 test.
TAN 3-Year Chart: Rangebound For Now. Patience Is A Virtue
StockCharts.com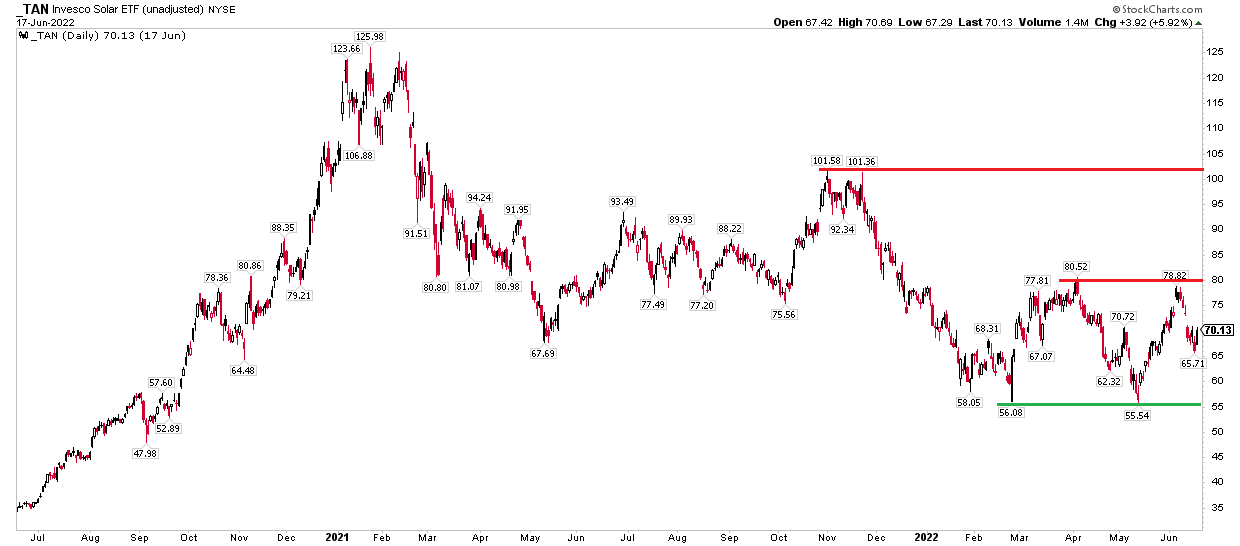
The Bottom Line
TAN is rangebound right now but has relative strength vs the S&P 500 in the last month. Seasonal trends are favorable and there could volatility catalysts this week care of two conferences on Wednesday. Ultimately, the $55 to $80 range looks firm for now. Watch for a breakout or breakdown before placing your solar bets.
Be the first to comment