

Darren415
This article was first released to Systematic Income subscribers and free trials on Aug 3.
In this article, we take a look at two Western Asset credit CEFs: the Western Asset Mortgage Opportunity Fund (NYSE:DMO) and the Western Asset Diversified Income Fund (NYSE:WDI). The two funds are trading at similar yields of near 10% and feature relatively wide discounts of 9.% and 8.5%, respectively. Both funds remain attractive in our view; however, they have a number of features that can appeal to different types of income investors.
Fund Structure
DMO was set up in the aftermath of the Global Financial Crisis to take advantage of attractive pricing in the legacy non-residential mortgage sector. This sector was nearly destroyed by the sharp turn in sentiment away from mortgages that were not implicitly (or explicitly) backed by the US government. Previously, many investors piled into this investment space on the back of attractive yields for its credit rating; however, most were disappointed in the eventual performance as much of the modeling by credit rating agencies proved to be overly optimistic, discounting the likelihood of a nationwide housing crash as well as being the victim of (often undisclosed) poor mortgage underwriting standards. AAA-rated subprime tranches fell as much as 70% through the crisis before recovering.
Systematic Income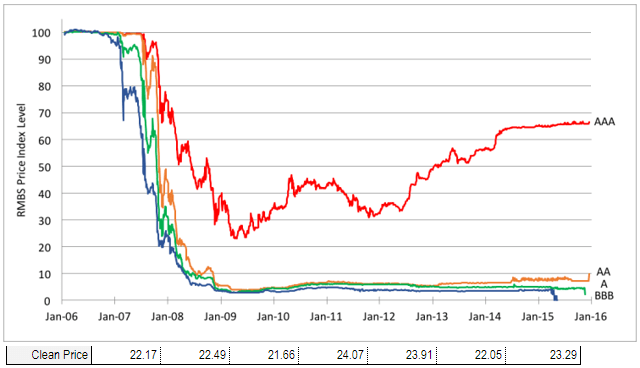
The fund’s management clearly saw great potential in the sector (as did PIMCO which loaded up on these assets in a number of its taxable CEFs) and set up DMO to allocate to the space. The fund’s impressive 8.2% total NAV CAGR over the last 10 years (and 9.6% since inception in 2010) exceeds a number of PIMCO taxable funds and highlights the attractive opportunity that existed in the sector in the fallout of the GFC.
DMO, which was initially called the Western Asset Mortgage Defined Opportunity Fund, was initially set up as a term fund with an expected termination date in 2022. The idea was that whatever “defined opportunity” there was in non-agency RMBS would have been fully monetized by 2022. However, the fund asked its shareholders to remove the termination date which was approved. Since then, the fund has traded as a perpetual CEF, having changed its name to Western Asset Mortgage Opportunity Fund.
WDI was also set up as a term fund with an expected termination date in 2033. However, given what happened with DMO, we don’t attribute any value to this feature. There are three options for a term CEF that is nearing its termination date. One is that it can simply terminate. Two, it can ask its shareholders to approve a removal of the termination date and this can be approved (as was the case for DMO) or rejected. And three, the fund can carry out a tender offer at the NAV and if there are enough assets remaining can switch to a perpetual CEF with shareholder approval. Options one and three allow investors to exit at the NAV. This is a very valuable option as it can provide significant uplift in returns for funds trading at a discount. For instance, a fund trading at a 6% discount would allow investors to exit at a zero discount – a 6% tailwind. However, since DMO went with the second option, investors shouldn’t necessarily expect this tailwind for WDI. A slight complication in this analysis is that DMO was trading at a premium at the time the shareholder vote was held and this may have swayed management to not hold a tender offer since it wouldn’t have made sense. Had the fund traded at a discount they may have carried out a tender offer or allowed the fund to terminate.
In terms of fees, DMO has a 1% management fee while WDI has a 1.1% fee. The trend has been for CEF fees to increase over time – we have seen something similar for PIMCO CEFs. This is unfortunate since the increase in fees also coincided with a broad drop in credit yields, meaning fees were eating up a larger share of the overall yield available to investors.
Allocation Profile
The biggest difference between the two funds is in their allocation profile. DMO is very much a pure-play mortgage fund. Specifically, it is allocated to legacy non-agency mortgages as well as newer securities issued by the US agencies called CRT (Credit Risk Transfer) notes. These securities carry mortgage repayment risk in contrast to the more familiar agency mortgage securities which carry no credit risk.
On the other hand, WDI is more of a true multi-sector credit fund with allocations across high-yield corporate bond, bank loans, MBS, ABS and others.
Franklin Templeton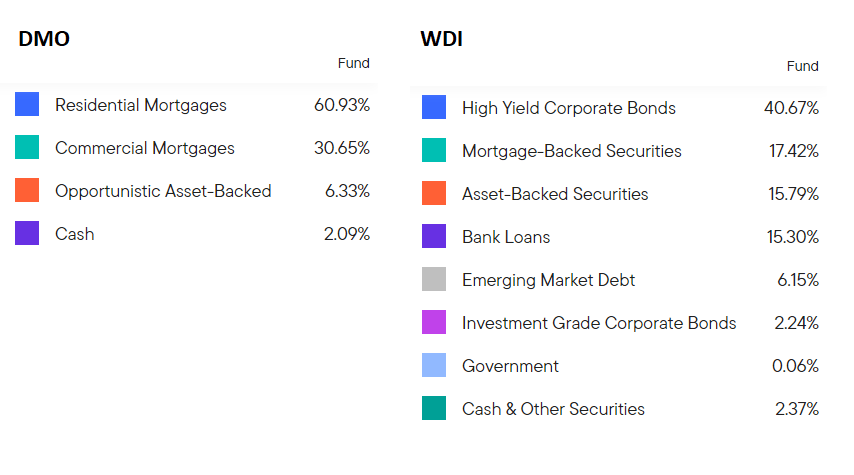
As of June, DMO and WDI had leverage of 36% and 33%, respectively. This is in the ballpark of a typical leveraged credit CEF.
Both funds feature relatively modest durations of 4.7 for DMO and 3.2 for WDI.
Income Profile
Given the sharp moves in short-term rates so far this year, an important question to ask is how will this dynamic carry over to the income profile of both funds. The short answer here is that it will be a benefit for both funds, though DMO will benefit to a much greater degree.
There are three main drivers of fund income changes – the fund’s assets, its liabilities and its off-balance sheet derivatives. DMO has primarily floating-rate assets and fixed-rate liabilities (fixed until mid-2023, to be more precise) which means that its income profile is highly geared to rising short-term rates.
About half of the assets of WDI are floating-rate while its credit facility (i.e. its liability) is floating-rate. Net-net, it has a bit more floating-rate assets than floating-rate liabilities which means that rising short-term rates will increase the fund’s income level. Despite being a very young fund – it got going only about a year ago – it has already raised its distribution. The fund has been earning about $0.12 of monthly net income per share while also carrying a positive UNII balance. After its hike, the fund has a distribution coverage of 100%. We expect its net income to keep growing steadily through the rest of the year, leading to another potential hike, all else equal.
While DMO will see its net income grow much more quickly than WDI, it will take some time before investors can hope for a distribution hike. This is because it is starting at a much lower distribution coverage level – 70% as of Q1. At the current level of Libor of around 2.8%, we estimate its coverage is already around 100%; however, it will take time for official net income to rise to its distribution of $0.10. This is because Libor is reset only quarterly and then only at the rate at the start of the accrual period. This means that cash flows accruing now will keep accruing at the lower level of Libor and will take a bit of time to reset to higher levels.
Return Profile
Just as WDI is more of a typical multi-sector fund, its performance is also fairly typical of the sector. Year-to-date, DMO has one of the best total NAV returns in the sector at -8% vs. an average of -12%. WDI boasts a slightly worse return than the average of -15.6% in total NAV terms. By comparison, the PIMCO taxable funds have total NAV returns ranging from -10% to -18% in total NAV terms year-to-date.
If we plot the total NAV return over the past year (about as much as we have for WDI) and include the more familiar PIMCO funds PTY and PCM, we get the following chart. PTY is more of a corporate bond focused fund just as WDI while PCM has more of a residential MBS focus just like DMO. We see that DMO has outperformed so far this year which is owed to both its lower leverage level and its lower-beta RMBS assets.
Systematic Income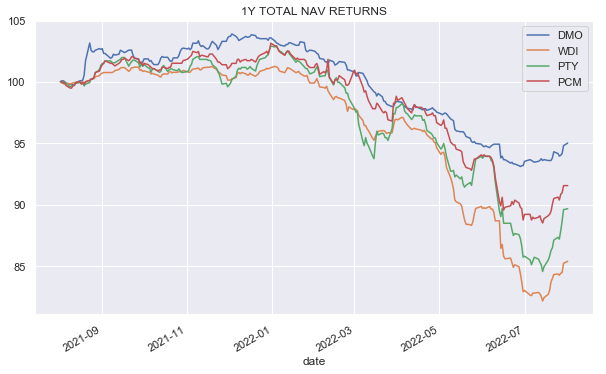
Valuation Profile
Both DMO and WDI continue to trade at a wider discount to Multi-Sector CEFs.
Systematic Income CEF Tool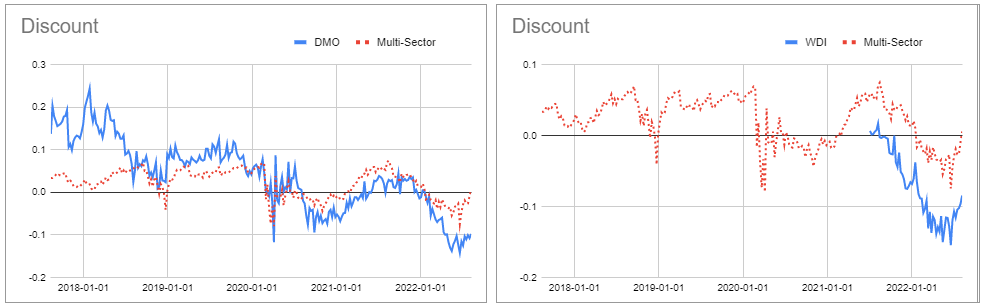
WDI has tended to trade at a wider discount to DMO but has recently moved to a slightly tighter one. Overall, DMO is the slightly cheaper one of the two funds.
Systematic Income CEF Tool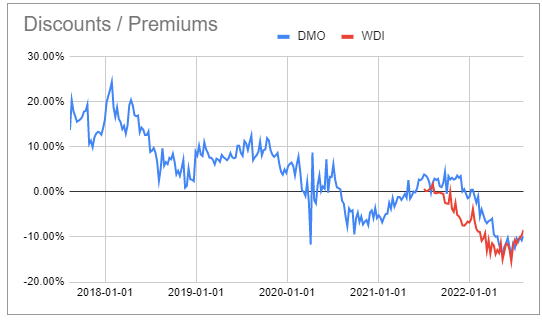
Takeaways
There are a few considerations for investors looking at these two credit CEFs.
First, although DMO is itself undiversified it can actually diversify typical income portfolios to a greater extent. This is because most income portfolios are heavily allocated to corporate credit. DMO is one of the few funds (such as JLS, PCM) that allows investors to take exposure to the household sector.
Second, DMO is also a lower-beta fund than WDI which can have pros and cons. The obvious pro is that it has held up much better than most other credit CEFs. The downside is that it may be less compelling for investors looking to jump on the most beaten down assets in search of capital gains.
Third, the income profile of DMO is more responsive to rising short-term rates and should increase more quickly as the Fed continues to hike. At the same time, investors who are convinced that the Fed will, shortly, be forced to reverse all their hikes (not our base case but not impossible) due to a hard landing may find WDI with its more stable income level more appealing.
Finally, both funds remain attractively valued with DMO being slightly cheaper.
Overall, we see value in both funds and continue to hold both funds in our High Income Portfolio. That said, some investors may want to tilt to one or the other depending on their views and portfolio allocation goals.
Be the first to comment