

Floriana/E+ via Getty Images
This dividend ETF article series aims at evaluating products regarding the relative past performance of their strategies and quality metrics of their current portfolios. Holdings and their weights change over time: reviews are updated when necessary.
DIVB strategy and portfolio
The iShares U.S. Dividend and Buyback ETF (BATS:DIVB) has been tracking the Morningstar US Dividend and Buyback Index since 11/07/2017. It has 343 holdings, a distribution yield of 1.76% and a total expense ratio of 0.25%. Dividends are paid quarterly.
As described in the prospectus by iShares, the underlying index “consists of companies with the largest dividend and buyback programs in the market measured by dollar value (…) securities of the Parent Index with aggregate dividend yield and buyback yield in excess of 0.1% are added to the Underlying Index in order of decreasing total shareholder payout dollars until the Underlying Index represents 90% coverage of the aggregate total shareholder payout dollars of the Parent Index. Each individual constituent is capped at 4.9% of the Underlying Index“.
It looks like a shareholder yield strategy, but it is not really one: the ranking factor is the total shareholder payout, not the yield. It means large-cap companies are privileged. Moreover, the third component of shareholder yield (debt reduction) is ignored.
The fund invests almost exclusively in U.S. companies (98.5%), mostly in large caps (87%).
Compared to the S&P 500 (SPY), DIVB overweights financials, and to a lesser extent, consumer staples and communication. It underweights consumer discretionary, healthcare, utilities and real estate.
Sector weights (chart: author, data: Fidelity)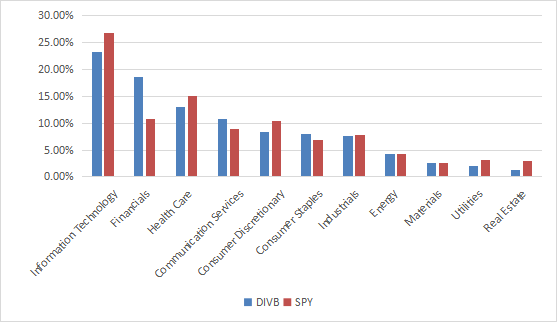
The next table lists the top ten companies with their weights and some ratios. They represent 25.6% of asset value. The heaviest one (Apple Inc.) weighs about 5%, so exposure to risks related to individual stocks is moderate.
|
Ticker |
Name |
weight % |
EPS growth % ttm |
P/E ttm |
P/E fwd |
Yield % |
|
Apple Inc. |
5.04 |
38.05 |
23.01 |
23.08 |
0.65 |
|
|
Microsoft Corp. |
4.25 |
30.44 |
27.42 |
28.31 |
0.94 |
|
|
Alphabet Inc. |
3.82 |
47.20 |
20.49 |
20.57 |
0 |
|
|
Meta Platforms, Inc. |
2.46 |
13.14 |
12.72 |
14.50 |
0 |
|
|
Berkshire Hathaway Inc. |
1.9 |
-15.46 |
7.42 |
21.07 |
0 |
|
|
JPMorgan Chase & Co. |
1.88 |
6.96 |
8.36 |
9.85 |
3.55 |
|
|
Procter & Gamble Co. |
1.78 |
5.25 |
25.29 |
24.79 |
2.52 |
|
|
Bank of America Corp. |
1.55 |
50.13 |
8.91 |
9.48 |
2.69 |
|
|
Oracle Corp. |
1.45 |
-47.51 |
29.98 |
13.78 |
1.78 |
|
|
Johnson & Johnson |
1.43 |
31.16 |
23.99 |
17.35 |
2.54 |
Ratios from Portfolio123
Past performance
Since inception in November 2017, DIVB and SPY have similar returns. The annualized difference is only 15 bps. DIVB shows a slightly higher risk in drawdown and standard deviation of monthly returns (volatility).
|
Total Return |
Annual.Return |
Drawdown |
Sharpe Ratio |
Volatility |
|
|
DIVB |
62.53% |
11.04% |
-35.82% |
0.56 |
18.29% |
|
SPY |
61.54% |
10.89% |
-32.05% |
0.58 |
17.25% |
Data calculated with Portfolio123
The next chart plots the equity value of $100 invested in DIVB and SPY since DIVB inception, reinvesting dividends. DIVB was on par with the benchmark until the fourth quarter of 2019, then it lagged in 2020 and 2021, and outperformed in 2022.
DIVB vs. SPY (Chart: author; Data calculated with Portfolio123)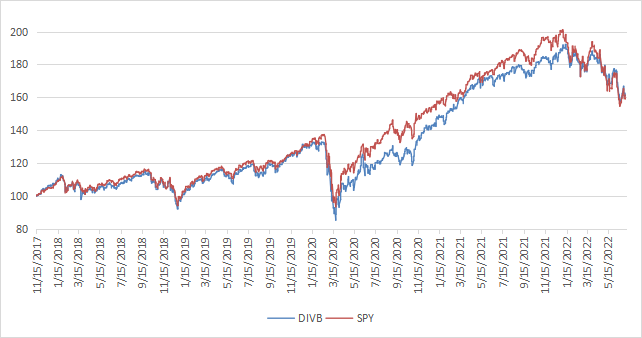
This price history is too short to assess the long-term potential of the strategy. To evaluate the strategy on a longer period, I did a simulation using a similar shareholder payout metric. Stocks in a universe of about 3000 stocks are ranked based on the sum of total dividend payments and equity purchases in the previous 12 months, then classified in 10 subsets of equal size. Subsets are reconstituted every quarter between January 2000 and August 2021. Annualized returns are calculated for every subset. The chart below plots them with increasing shareholder payout from the left to the right. The red bar on the left doesn’t stand for a subset, but for the universe’s annualized return (benchmark).
Shareholder payout backtest (Chart: Portfolio123)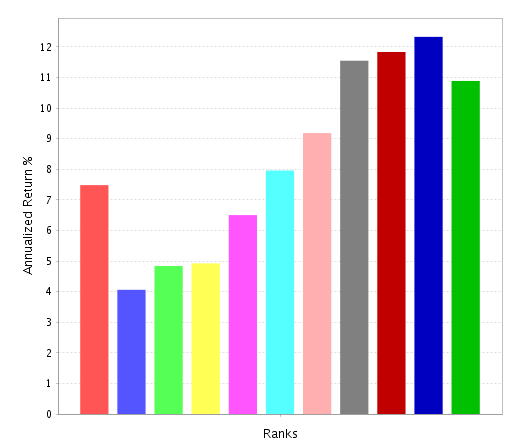
On a 21-year look-back period, higher returns are clearly skewed toward higher shareholder payouts. It is not a guarantee of future return, but it proves that DIVB strategy makes sense based on two decades of data.
In previous articles, I have shown how three factors may help cut the risk in a dividend portfolio: Return on Assets, Piotroski F-score, and Altman Z-score.
The next table compares DIVB with a subset of the S&P 500: stocks with an above-average dividend yield, an above-average ROA, a good Altman Z-score, a good Piotroski F-score and a sustainable payout ratio. The subset is rebalanced annually to make it comparable with a passive index.
|
Total Return |
Annual.Return |
Drawdown |
Sharpe Ratio |
Volatility |
|
|
DIVB |
62.53% |
11.04% |
-35.82% |
0.56 |
18.29% |
|
Dividend & quality subset |
72.18% |
12.43% |
-35.57% |
0.62 |
18.17% |
Past performance is not a guarantee of future returns. Data Source: Portfolio123
DIVB underperforms the dividend quality subset by 1.39 percentage points in annualized return. However, the ETF performance is real, and this subset is hypothetical. My core portfolio holds 14 stocks selected in this subset (more info at the end of this post).
Scanning DIVB with my quality metrics
DIVB is cheaper than SPY regarding the usual valuation ratios (see next table).
|
DIVB |
SPY |
|
|
Price/Earnings TTM |
15.65 |
20.05 |
|
Price/Book |
2.86 |
3.85 |
|
Price/Sales |
2.1 |
2.58 |
|
Price/Cash Flow |
12.34 |
15.55 |
I have scanned holdings with the quality metrics described in the previous paragraph. I consider that risky stocks are companies with at least 2 red flags among: bad Piotroski score, negative ROA, unsustainable payout ratio, bad or dubious Altman Z-score, excluding financials and real estate where these metrics are less relevant. With these assumptions, 33 stocks out of 343 are risky, and they weigh less than 5% of asset value, which is a good point.
Based on my calculation, the aggregate return on assets, Altman Z-score and Piotroski F-score are above the S&P 500’s values. These metrics point to a portfolio quality superior to the benchmark.
|
DON |
SPY |
|
|
Altman Z-score |
3.96 |
3.26 |
|
Piotroski F-score |
6.39 |
6.14 |
|
ROA % TTM |
11.41 |
7.93 |
Conclusion
DIVB has a portfolio of about 340 stocks based on dividends and buybacks. Total return is almost on par with the S&P 500 since inception in 2017. Price history is too short to assess the strategy, but backtesting the ranking factor points to outperformance on the long term. Moreover, the current portfolio is superior to the benchmark regarding valuation and quality metrics. Buybacks are less popular than dividends, but they are a flexible and tax-efficient way to pay shareholders. My only criticism is that I would prefer a methodology giving a better place to smaller companies. For transparency, a dividend-oriented part of my equity investments is split between a passive ETF allocation (DIVB is not part of it) and my actively managed Stability portfolio (14 stocks), disclosed and updated in Quantitative Risk & Value.
Be the first to comment