

SimonSkafar/E+ via Getty Images
Investment Thesis
The cyclical energy sector recorded some of the fastest growth in earnings per share, with dividends increasing by 50% on average since 2018. With newer sanctions being imposed on Russian energy, the world’s largest oil exporter and third-largest producer, oil inventories are expected to be in short supply, despite historic releases from various international reserves, until the crisis has been resolved or feasible long-term alternates are swiftly achieved. However, this will not be achieved quickly or easily, and I expect oil supplies to remain displaced and trade in the $100-$130 during the year, before gradually stabilizing around $90 in 2023.
Diamondback Energy (NASDAQ:FANG) has a disciplined production, healthy balance sheet with excellent margins, and attractive valuation numbers. All these factors, backed by strong oil prices, makes Diamondback Energy an ideal candidate for anyone looking to add quality oil exposure to their portfolio. Diamondback Energy receives a “Buy” recommendation.
Macro Analysis
US Oil E&P Capex
The COVID-19 pandemic and subsequent period of low oil prices forced oil producers to cut back on their drilling and capital expenditures and instead focused on reducing debt and returning value to shareholders. Looking at the cash flow statements of most oil producers for 2020 and 2021 would show periods of low Capex. With demand for oil rising again and wells being quickly drained, some companies are beginning to restart their Capex programs. Furthermore, with the US government calling on US oil producers to ramp up output, an increase in capital expenditures might follow. Inflation being at all-time highs would also show an increase in the dollar amount spent. US Oil & Gas executives were recently called to testify in the US Congress about the surge in energy prices; one notable statement by Pioneer Natural Resources’s (PXD) CEO Scott Sheffield was:
The industry not only needs to spend significant capital to offset existing production declines, but is experiencing (…) labour shortages due to three downturns in twelve years, shortages of drilling rigs, frack fleets and other equipment and materials. Given these constraints, it would take 18-24 months to add any meaningful incremental production.
I believe Sheffield’s statement holds true for all Oil US Exploration & Production “E&P” companies, and that we will not see any immediate increases in production due to these significant operational bottlenecks.
Breaking-Even
Over the past 5 years, US shale oil producers have managed to lower their breakeven price for developing new wells from $65/bbl. to $46/bbl. For existing US wells, that number gets as low as $23-$26/bbl. On the back of the current oil prices, this lower breakeven should help improve margins substantially for US E&P companies.
Oil – Demand & Supply
As most countries have opened up their borders and removed restrictions, businesses are slowly returning to normal. Although oil consumption in Russia and neighboring regions will be heavily dependent on the outcome of the Ukraine crisis, I expect to see an overall 3% increase in oil consumption this year to about 100.58 mb/d.
EIA (historical), Author’s assumptions (forecasts)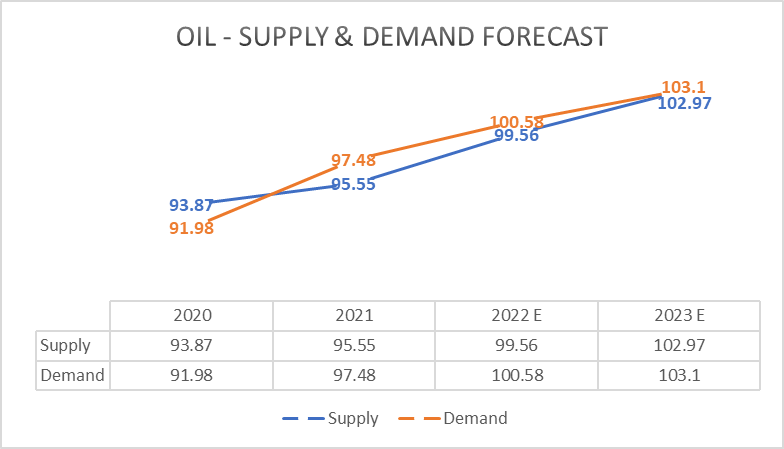
Looking at crude oil product recovery in the graph below, diesel and gasoline consumption has almost reached pre-pandemic levels. However, jet fuel still lags as air travel has not reached pre-pandemic levels yet. With COVID surging across Asia, higher oil prices and the Ukraine war, it could take a while before demand for jet fuel reaches pre-2019 highs.
IEA, World Bank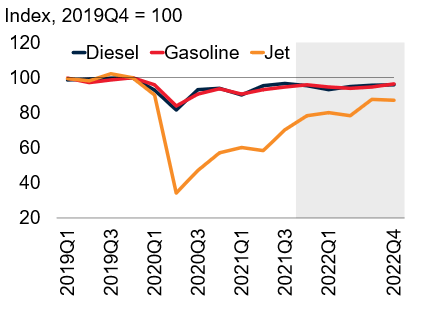
According to EIA, about 13% of electricity produced in the US has the capacity to switch between natural gas and oil. For most of these combined-cycle generators, natural gas is the primary source, with petroleum liquid fuels being secondary. With current gas prices at all-time highs in the US, I believe there is scope to see an increasing use of crude oil to substitute natural gas in electricity generation. This would be an upside risk for crude oil producers.
Referring to another one of my articles on Devon Energy (DVN), I mention how I expect oil prices to trade in the $100-$120 range for FY22, before subsequently stabilizing around $90 in ’23.
Company Performance
Diamondback topped analysts’ estimates during its last earnings report – performed extremely well on top and bottom-line numbers, cut down its debt and surpassed its 50% Free Cash Flow “FCF” payout target.
Diamondback, with its stellar production discipline, has de-emphasized production growth and is focusing on increasing returns and delivering value to shareholders. Despite the 2% lower production in Q4, Diamondback’s FCF increased to $772 from $770 over the quarter. The sale of Diamondback’s Bakken assets will also allow them to focus on the cheaper and more productive Permian Basin and their lower costs of oil production there. This is an excellent move in my opinion, as it I forecast the Permian Basin to be the only US oilfield that can sustain increasing output, while other US basins fight to maintain current production levels.
I expect Diamondback to be an ideal candidate for share repurchases / special dividends, or possibly even both. While Diamondback’s current dividend yield is low at 1.7%, the higher energy prices should give them the potential to possibly announce a special dividend, bringing 2022’s yield to about 4.4%.
Diamondback intends to maintain its Q4 production levels and keep a net oil production of around 220 Mboe/d for FY2022. Their product output mix for 2021 consisted of 60% oil, with natural gas and NGLs being 20% each. The investor presentation also shows that Diamondback has hedged about 47% of the planned 2022 crude oil production; deferred premium puts and costless collars were their preferred derivate tools used in hedging away price risk, with strike prices ranging from $71 to $ 93 across the four quarters of 2022. These derivates will limit some of the realizable upside for Diamondback.
Investor Presentation Q4’21 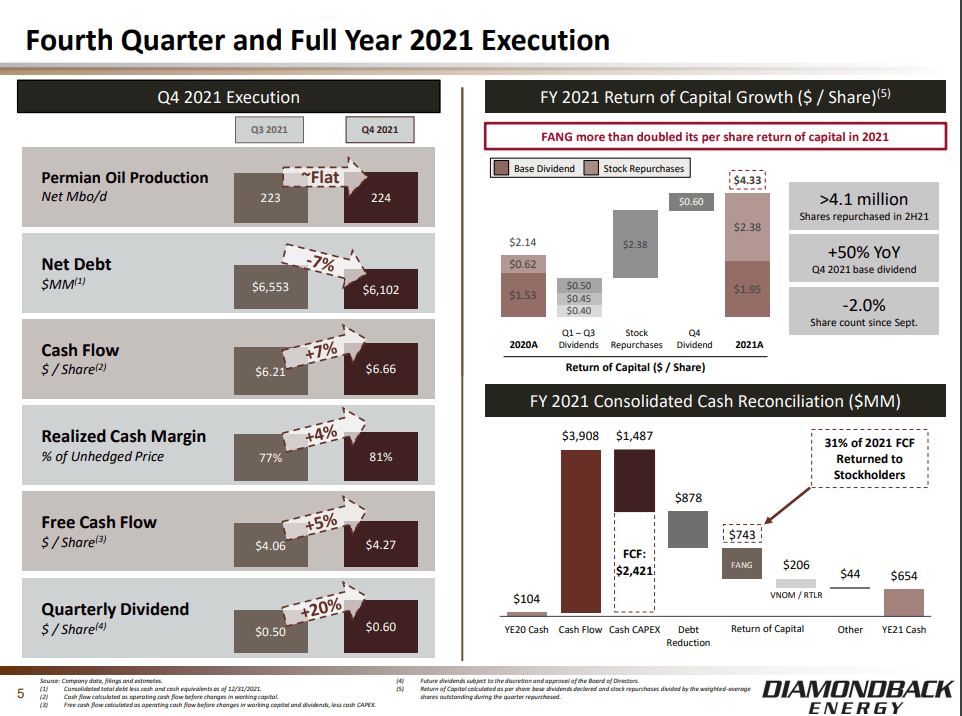
With the current commodity prices and a 95% realization rate, Diamondback can generate substantial FCF and achieve a pre-dividend breakeven price (including dividends) of $30/bbl. of WTI oil. Being able to continue operations and generate income during periods of depressed oil prices is an absolute advantage.
Financial Position
Diamondback has a very healthy balance sheet and is getting more robust. Their latest financials show the company cash increasing by $200m QoQ, after paying off $650m in senior debt. Note that they have no other material debt maturities coming up until Dec ’24. Diamondback also returned 67% of its $772m Q4 FCF through its stock repurchase ($409m) and dividend programs.
I would expect to see FCF increase by $60-80m for every dollar increase in WTI prices, and with a breakeven price of $30, the company can easily meet management’s target of returning at least 50% FCF to shareholders in 2022.
The company’s current Debt/Equity ratio of 0.55, with a current ratio of 1.01 is indicative of a healthy balance sheet that has adequate coverage and is not over-levered. These numbers support my thesis that Diamondback is an energy company with solid fundamentals.
Peer Comps
Taking a look at Diamondback’s peer comps, you can see that the company scores better on P/E multiples and EV/EBITDA (both trailing and forward) against all its peers, with the exception of Marathon Oil (MRO) which is also trading at a discount.
|
Comps |
EV/EBITDA “TTM” |
EV/EBITDA “FWD” |
P/E “FWD” |
|
|
Diamondback Energy, Inc. (FANG) |
7.12x |
5.18x |
6.93x |
|
|
Marathon Oil Corporation (NYSE:MRO) |
5.96x |
4.29x |
9.13x |
|
|
Southwestern Energy Company (NYSE:SWN) |
16.03x |
4.40x |
5.81x |
|
|
Hess Corporation (NYSE:HES) |
10.85x |
7.56x |
14.65x |
|
|
EQT Corporation (NYSE:EQT) |
26.34x |
6.69x |
8.86x |
|
|
Devon Energy Corporation (NYSE:DVN) |
8.39x |
5.56x |
8.83x |
|
|
Antero Resources Corporation (NYSE:AR) |
6.38x |
6.71x |
7.58x |
|
|
Range Resources Corporation (NYSE:RRC) |
10.60x |
7.10x |
8.07x |
|
|
Pioneer Natural Resources Company (NYSE:PXD) |
9.38x |
5.73x |
9.70x |
|
|
Average |
11.74x |
6.16x |
9.68x |
|
|
Median |
9.9x |
6.69x |
8.45x |
|
Let us take a look at Diamondback’s profitability metrics from Seeking Alpha’s Quant section. The company’s Gross Margin of 87% and Net Income Margins of 34% are at the higher end of its peers. Being able to generate more EPS from each dollar revenue is a critical component when analyzing the firm’s financial health.
Seeking Alpha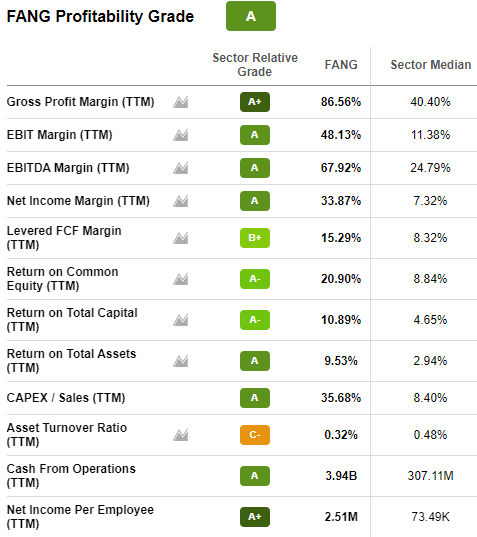
Diamondback also scores better on its other financial metrics like ROE, ROCE, and ROA, highlighting the competitive advantage the firm has over its peers.
Also using the Quant model rating below, you can see how Diamondback is more attractive on most valuation metrics relative to its peers. Less weightage should be given to the EV/Sales multiple as it considers just the top-line revenue numbers and does not take into account Diamondback’s solid operating margins of ~50% as seen above. EV/Sales is usually more relevant for companies that are yet to generate a profit. Based on the other relative valuation metrics (EV/EBITDA, P/E, P/CF), Diamondback is a more attractive investment relative to its peers.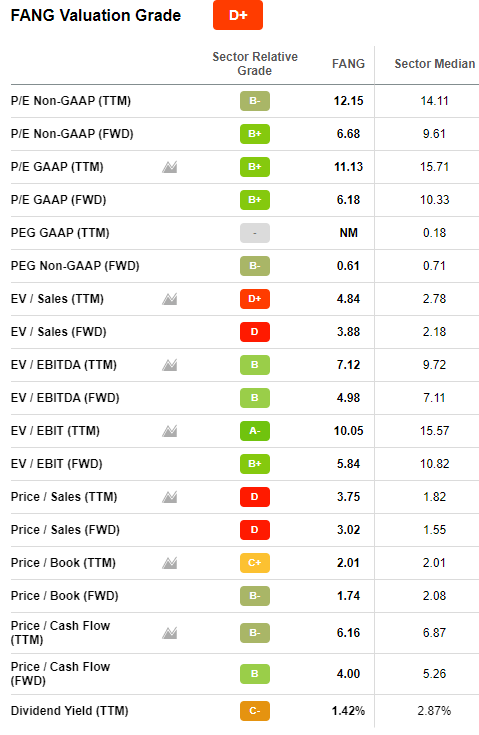
Seeking Alpha
I am going a step further and evaluating Diamondback Energy’s value based on a few oil industry-specific metrics below.
|
Comps |
Proven Oil Reserves “P1” |
EV/P1 |
P1/Production |
|
Diamondback Energy, Inc. (FANG) |
928.3 |
17.4x |
11.4 |
|
Marathon Oil Corporation (NYSE:MRO) |
570.0 |
19.6x |
9.0 |
|
Southwestern Energy Company (NYSE:SWN) |
79.8 |
4.1x |
12.1 |
|
Hess Corporation (NYSE:HES) |
808.0 |
31.8x |
13.5 |
|
EQT Corporation (NYSE:EQT) |
13.8 |
4.9x |
8.5 |
|
Devon Energy Corporation (NYSE:DVN) |
709.36 |
27.5x |
6.7 |
|
Antero Resources Corporation (NYSE:AR) |
36 |
5.5x |
9.0 |
|
Range Resources Corporation (NYSE:RRC) |
52.6 |
3.8x |
7.4 |
|
Pioneer Natural Resources Company (NYSE:PXD) |
967.6 |
28.7x |
7.4 |
|
Average |
399.7 |
14.3 |
9.4 |
|
Median |
324.9 |
11.4 |
9.0 |
Diamondback oil-specific industry multiples are also quite strong compared to its competitors. Proven Reserves, also known as 1P or P90, have a 90% chance of recovery and are one of the most essential components to consider while assessing an E&P company. A company’s EV/1P and 1P/ Oil Production are important gauges to understand how well the company’s reserves will help it to support operations and grow.
Valuation
Let us now explore Diamondback Energy’s valuation through a Discounted Cash Flow Model “DCF”. Most of the assumptions used here are industry standard and self-explanatory.
|
Assumptions |
|
|
Tax Rate (3Y Avg of Effective Tax Rate) |
16.9% |
|
Risk-Free Rate (5Y US Treasury) |
2.76% |
|
Market Risk Premium |
4.2% |
|
5Y Beta (Regression) |
2.1 |
|
Adjusted Market Risk Premium |
8.9% |
|
Cost of Equity |
11.7% |
|
Cost of Debt (Int Exp/BV of Debt) |
4.2% |
|
After-tax Cost of Debt |
3.8% |
|
Debt/Equity |
21% |
|
Weighted Cost of Equity |
9.1% |
|
Weighted Cost of Debt |
0.8% |
|
Weighted Average Cost of Capital “WACC” |
9.9% |
Using the Capital Asset Pricing Model “CAPM”, Diamondback’s Weighted Average Cost of Capital “WACC” is estimated to be 9.88%. A terminal EBITDA multiple of 6.5x was used to derive Diamondback’s equity value. This assumption is in line with the peer EBITDA Exit multiple of 6.7x we saw in the previous section.
The 5Y Regression Beta is derived to be 2.3; this is quite high and indicates that diamondback is extremely volatile compared to the market and much riskier. However, on the upside, it that that much more potential to fly up when the markets are rising.
|
Projected Cash Flows |
2020 |
2021 |
2022E |
2023E |
2024E |
2025E |
2026E |
|
Total Revenue |
2,671.0 |
6,443.0 |
9,786.9 |
8,857.2 |
6,678.3 |
7,219.2 |
7,587.4 |
|
EBITDA |
1,824.0 |
4,376.0 |
7,063.8 |
6,152.3 |
5,008.7 |
5,141.0 |
5,530.6 |
|
EBIT |
513.0 |
3,101.0 |
5,904.7 |
4,802.3 |
3,109.7 |
3,102.4 |
2,867.4 |
|
Net Income |
427.9 |
2,586.4 |
4,924.8 |
4,005.4 |
2,593.7 |
2,587.6 |
2,391.5 |
|
Capital Expenditure |
(2,044.0) |
(2,299.0) |
(1,800.8) |
(1,842.3) |
(2,310.7) |
(2,238.0) |
(2,663.2) |
|
Unlevered Free Cash Flow |
(208.1) |
1,598.4 |
4,209.1 |
3,446.1 |
2,131.5 |
2,333.6 |
2,334.1 |
|
PV of Yearly Cash Flows |
2,833.8 |
2,930.4 |
1,649.6 |
1,643.7 |
1,496.3 |
From my DCF calculations below, we arrive at an intrinsic share price value of $148.75. The closing price was $135.11 on April 12th – this indicates a 10.1% upside potential.
|
PV of 2022 Free Cash Flow Stub |
2,833.83 |
|
|
PV of 2023-2026 Free Cash Flows |
7,719.95 |
|
|
PV of Terminal Value |
23,044.08 |
|
|
Enterprise Value |
33,597.86 |
|
|
Less: |
||
|
Total Debt |
(6,715.00) |
|
|
Minority Interest |
(1,157.00) |
|
|
Plus: |
||
|
Cash and Equivalents |
664.00 |
|
|
Equity Value |
26,389.86 |
|
|
Shares Outstanding |
177.41 |
|
|
Implied Per Share Value |
148.75 |
|
|
Current Price |
135.11 |
|
|
Premium/(Discount) to Current Price |
0.09% |
|
Share Price Performance
Diamondback’s 276% share price increase over the last 10 years has surpassed that of its peers by a landslide, with Pioneer following at 77%. The worst performer in the group has been Southwestern, down over 56% over a 10Y period.
Capital IQ Database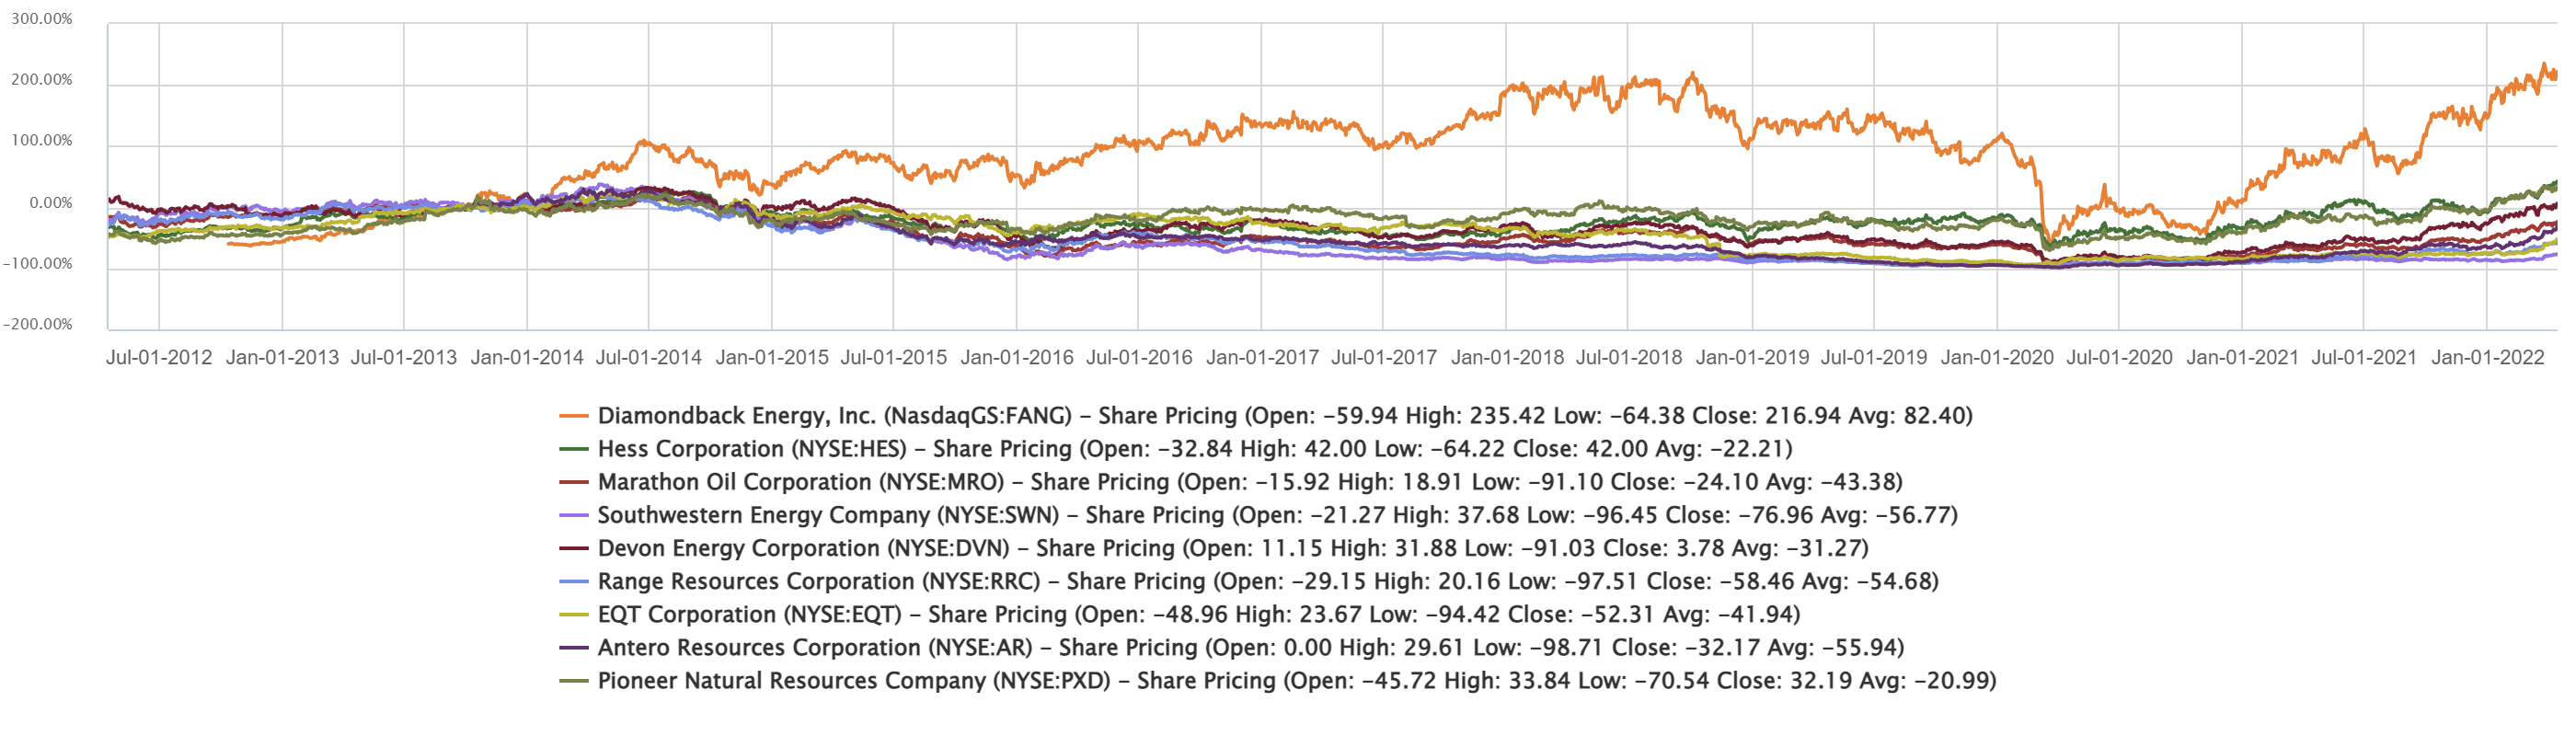
Key Risks
A few key risks that should be taken into consideration however include:
A surge in COVID-19 cases could result in a drastic reduction in oil demand
While COVID cases of the new Omicron subvariants are raging across Asia and Europe once again, the effect on oil demand appears to be more subtle thus far. As you can see in the 1Y Brent price chart below, Brent prices have been steadily climbing up since December and closed at $112 on April 19th. The Bollinger Bands suggest that prices are expected to remain trading between 96.5 and $122.5 in the near term. However, if governments begin to reimpose travel restrictions and lockdowns, such as with China’s lockdown of Shanghai, we should expect reduction in air traffic, uptick in remote working, and an exacerbation of existing supply-chain issues. These could all lead to another period of depressed oil prices and harm Diamondback’s profitability. However, Diamondback’s price-hedging activities should help the company mitigate some of this downside risk.
Business Insider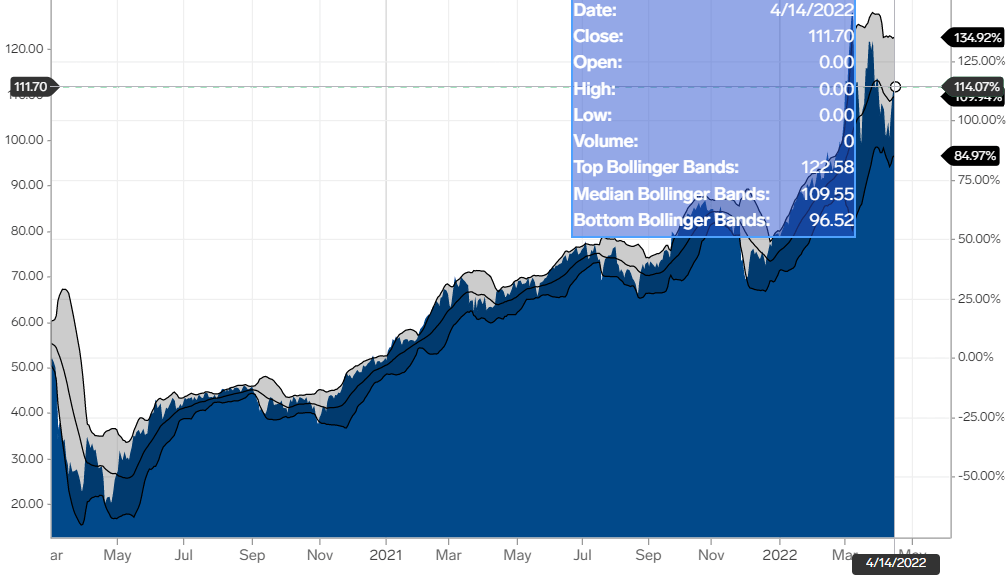
Release from Reserves & Increasing Production
While it looks like other countries may start committing to increase their productions, I still expect to see WTI prices in the $110 range for the rest of the year, staying in the $100-140 range. Many OPEC countries are not able to meet their production targets under the new Agreement and have high compliance rates (Nigeria, Algeria). Several countries have also joined the US in releasing crude from their reserves, amounting to a total of 240 million barrels (9% of the total IEA emergency reserves); however, this news did not move oil prices much and WTI closed by only a percent lower at $98. Investors likely doubted the efficacy of the move in solving the long-term supply constraint issues. More recently, Libya shutdown its largest oilfield production amidst a political crisis in the country. Libya is responsible for producing around 70,000 b/d, and this outage will put additional strain on existing supplies. As I have mentioned in my previous article, I believe oil was already on a trajectory to reach new highs in 2022 due to unprecedented production cuts and historically low levels of inventories. These coordinated releases from emergency reserves will only further decrease the available global oil supply reserves, thereby supporting oil prices at the current levels.
US Energy Policies
The White House announced a new energy policy on March 31st to tackle the rise in energy prices. The Biden administration is looking to address climate change, by decreasing oil consumption nationally and ending oil dependence while increasing investments in renewable energy. President Biden does however recognize the importance of oil in the political economy and his March 31st address called for increasing oil supplies in the short term. As mentioned earlier in the macro analysis section of this report, most US oil companies are not likely to increase supply right now.
The sale of drilling rights on federal land which was stopped in early 2021 under the Biden administration has also resumed now. The new leases will have reduced acreage and see an increase in royalties from 12.5% to 18.75%. However, this new plan does not apply to US coastal regions. I suspect these higher costs would ultimately be borne by consumers at the pump rather than by the company.
President Biden also announced the EPA would lift the restrictions on the E15 blend, consisting of 15% ethanol-85% gasoline, being used during the summer. There is widespread disagreement on the environmental effects of the higher ethanol blends and many environmental are against lifting the regulations, so this is likely to be only a short-term move. And with E15 being only marginally cheaper by 10 cents/gallon, its effectiveness at reducing energy prices is debatable.
Conclusion
The analysis performed shows that there is still a 10% upside potential for Diamondback Energy after the recent surge in share prices. Diamondback was successful last year in mitigating inflationary pressure while also controlling costs. Their strategy this year to focus on shareholder value and operational efficiencies, with limited to no supply increases will be key factors contributing to their continued growth.
I am recommending Diamondback Energy as a buy.
Be the first to comment