Wirestock
By Valuentum Analysts
Deere & Company (NYSE:DE) has made its dividend a greater priority as the company benefits from good times across its business segments thanks to tremendous levels of fundamental pricing expansion. Deere kicked off 2022 with a quarterly dividend payout of $1.05 per share in March, and then raised it to $1.13 per share in May, and then raised it again to $1.20 per share on December 7. On an annualized basis, Deere’s forward estimated dividend yield of ~1.1%, but we think there may be more room for the dividend to be raised, particularly in light of recent trends across Deere’s business. We’ve been very impressed with the company’s dividend trajectory this year.
Deere has raised its dividend a couple times this year. (Image Source: Seeking Alpha)
During the past 10 years, Deere’s stock has been a strong performer, too, almost up five-fold, and while most of the equity markets have languished this year, particularly more speculative technology stocks, Deere’s stock has advanced more than 22% year-to-date at the time of this writing. We attribute the relative strength to the company’s fundamental pricing power on display this year, but also a more conservative investor that has re-allocated away from higher-beta names to more “old economy” equities that may be less exposed to capital outflows, though we do note that Deere’s results are cyclical as the global economy contends with a challenging economic growth environment.
Deere’s Investment Considerations
Investment Considerations (Image Source: Valuentum)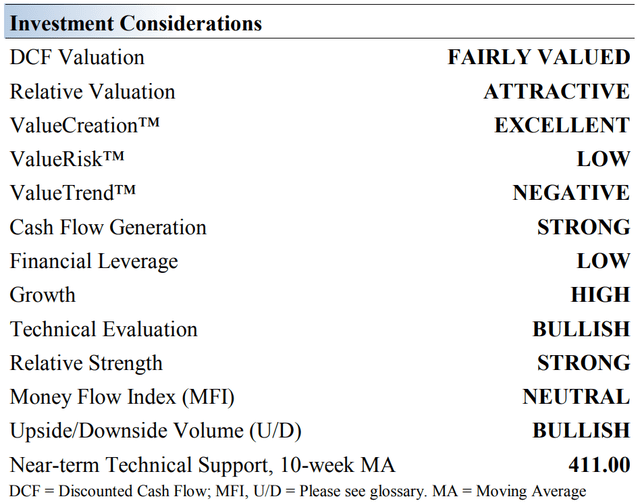
Deere operates in three business segments. Its agricultural/turf segment makes tractors, loaders, combines, and harvesters. Its construction/forestry segment produces earthmoving machines, loaders and excavators, while its financial operation supports its dealer network via wholesale financing. The company was founded in 1837 and is based in Illinois.
Deere’s performance is heavily influenced by the economic cycle and its financial services operation adds credit risks to its business model. We still like Deere’s fundamentals, and its strong brand name and extensive dealer network are key competitive strengths.
Deere is tied to the changing worldwide demand for farm outputs that are required to meet the population’s growing food and bio-energy needs. Fluctuating agricultural commodity prices directly impact sales of Deere’s equipment and are largely responsible for the cyclical tendencies of its operations. Management targets a 25%-35% payout ratio of mid-cycle earnings.
Trade tensions and related tariffs have the potential to impact both demand for Deere’s products and input costs. Deere is utilizing its pricing power and growing scale to offset inflationary pressures and logistical hurdles, to a degree, and demand for its offerings has been quite strong of late.
In the market for agricultural/turf equipment, Deere’s rivals include AGCO (AGCO), CNH Global (CNHI), Kubota, and Toro (TTC). Pivoting to the market for construction/forestry equipment, Deere’s rival include Caterpillar (CAT), Komatsu (OTCPK:KMTUY) (OTCPK:KMTUF), and Volvo. Competition remains fierce, but customers continue to accept price.
Deere’s Economic Profit Analysis
Adjusted ROIC (Image Source: Valuentum)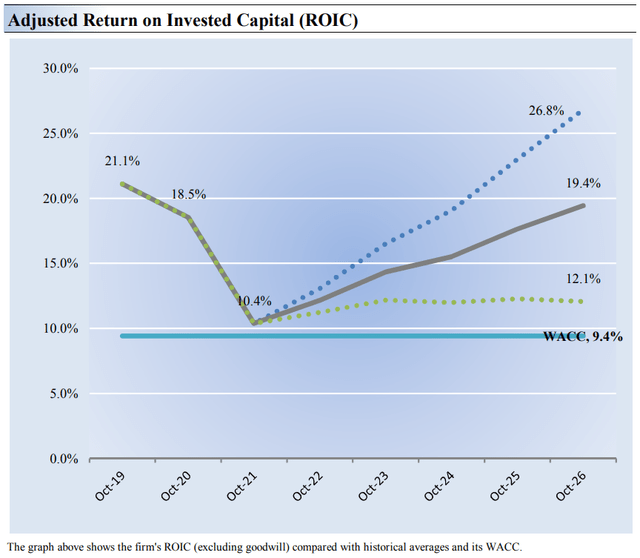
The best measure of a company’s ability to create value for shareholders is expressed by comparing its return on invested capital [ROIC] with its weighted average cost of capital [WACC]. The gap or difference between ROIC and WACC is called the firm’s economic profit spread. Deere’s 3-year historical return on invested capital (without goodwill) is 16.7%, which is above the estimate of its cost of capital of 9.4%.
As such, we assign the firm a ValueCreation™ rating of EXCELLENT. In the chart above, we show the probable path of ROIC in the years ahead based on the estimated volatility of key drivers behind the measure. The solid grey line reflects the most likely outcome, in our opinion, and represents the scenario that results in our fair value estimate. Deere also has an attractive economic castle rating.
Deere’s Latest Quarterly Results and Outlook
Deere put up excellent fiscal fourth-quarter results for the period ending October 30, 2022. The company’s pricing power is phenomenal. (Image Source: Deere)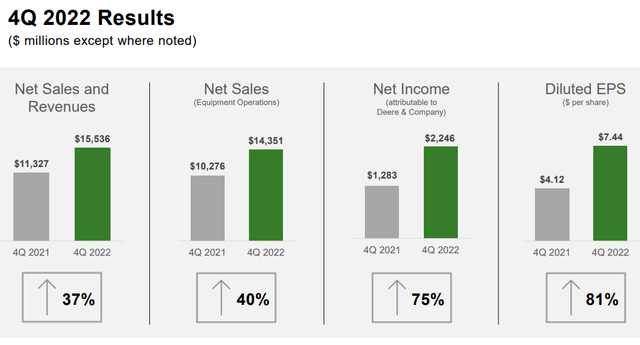
On November 23, Deere reported results for its fourth quarter of fiscal 2022 for the period ending October 30, 2022. We pay close attention to Deere for insights across the industrial equipment and agricultural supply chain, and things are looking resilient, despite evident pressures across the consumer discretionary arena.
The industrial and agricultural equipment markets are highly cyclical, but things remain healthy for the likes of Caterpillar and Deere at the moment. During the latter’s fiscal fourth-quarter report, worldwide revenue advanced an impressive 37% as the firm’s dealer network and higher factory production effectively overcame supply-chain issues that have been plaguing many sectors as a result of an overhang from the COVID-19 lockdowns.
Net income at Deere during the period came in at $7.44, up from $4.12 per share in the same period a year ago thanks to tremendous pricing strength, something management expects will continue into the new fiscal year. Both sales and net income in the quarter topped consensus expectations, and we liked the operating leverage inherent in Deere’s model during good times.
During fiscal 2022 (ends October 30, 2022), Deere reported net income of ~$7.13 billion, and we were pleased to hear that management expects net income to be in the range of $8-$8.5 billion for fiscal 2023. This implies a top-line growth rate of ~15.7% at the midpoint of the range, and given the firm’s operating leverage, we’re expecting a strong showing on the bottom line for fiscal 2023, too, particularly if the company experiences strong pricing strength, as it did during the fiscal fourth quarter (and as outlined in its outlook in the image below). Management’s commentary in the quarterly press release pointed to “positive farm fundamentals and fleet dynamics as well as increased investment in infrastructure” as key reasons to be optimistic in the new fiscal year.
Deere’s outlook for fiscal 2023 is fantastic, revealing more than 15% top-line growth, while better pricing realization could drive tremendous operating earnings expansion in the fiscal year. Agricultural and construction markets remain healthy. (Image Source: Deere)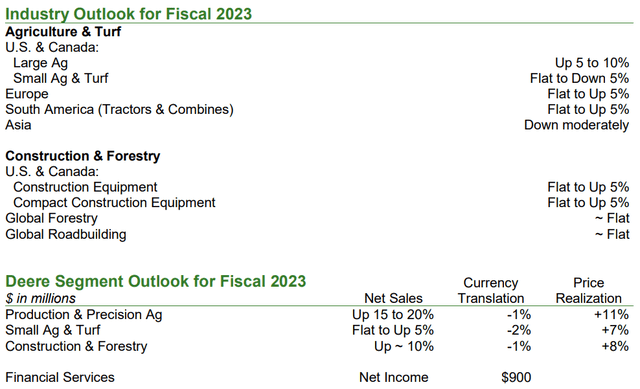
We think Deere’s pricing strength is worth emphasizing. Excluding its captive financial services arm, the company operates three primary segments, “Production & Precision Agriculture,” “Small Agriculture & Turf,” and “Construction and Forestry,” and all three operating divisions revealed the company’s incredible pricing power. In its “Production & Precision Agriculture” division, price accounted for $873 million of the firm’s $1.74 billion quarterly operating profit in that division. In its “Small Agriculture & Turf” segment, price accounted for $350 million of the division’s $506 million in quarterly operating income, while price accounted for nearly all (approximately 86%) of the “Construction & Forestry” division’s operating profit during the fiscal fourth quarter. Deere may be one of the best ways to play an inflationary environment.
Deere’s Cash Flow Valuation Analysis
Valuation Breakdown (Image Source: Valuentum)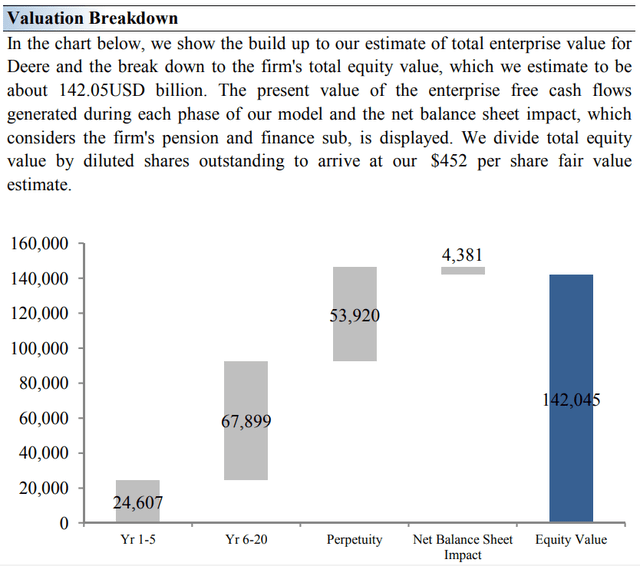
On the basis of our discounted cash flow model, we think Deere is worth $452 per share with a fair value range of $362-$542. Shares are trading at ~$424 per share at the time of this writing. The margin of safety around our fair value estimate is driven by the firm’s LOW ValueRisk™ rating, which is derived from an evaluation of the historical volatility of key valuation drivers and a future assessment of them.
Our near-term operating forecasts, including revenue and earnings, do not differ much from consensus estimates or management guidance. Our model reflects a compound annual revenue growth rate of 10.7% during the next five years, a pace that is higher than the firm’s 3-year historical compound annual growth rate of 5.6%. Much of this strength is driven by expectations for the company’s pricing strength to continue.
Our valuation model reflects a 5-year projected average operating margin of 20.8%, which is above Deere’s trailing 3-year average. Beyond year 5, we assume free cash flow will grow at an annual rate of 5.9% for the next 15 years and 3% in perpetuity. For Deere, we use a 9.4% weighted average cost of capital to discount future free cash flows. Please note we recently raised our fair value estimate from $350 per share due in part to the company’s pricing power.
Range of Potential Outcomes (Image Source: Valuentum)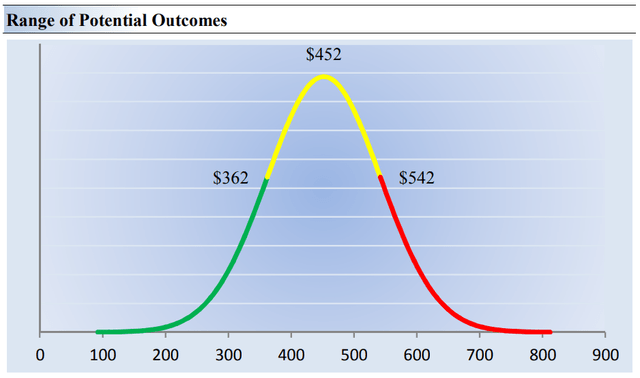
Our discounted cash flow process values each stock on the basis of the present value of all future free cash flows. Although we estimate Deere’s fair value at about $452 per share (note we recently raised it from ~$350 recently), every company has a range of probable fair values that’s created by the uncertainty of key valuation drivers (like future revenue or earnings, for example). After all, if the future were known with certainty, we wouldn’t see much volatility in the markets as stocks would trade precisely at their known fair values.
Our ValueRisk rating sets the margin of safety or the fair value range we assign to each stock. In the graph above, we show this probable range of fair values for Deere. We think the firm is attractive below $362 per share (the green line), but quite expensive above $542 per share (the red line). The prices that fall along the yellow line, which includes our fair value estimate, represent a reasonable valuation for the firm, in our opinion. Deere is trading at the low bound of our fair value estimate range at the time of this writing.
Concluding Thoughts
Deere & Company put up excellent fiscal fourth quarter results November 23, and the highlight of the quarter was the firm’s tremendous pricing power. Its outlook for fiscal 2023 was solid, too, and we expect considerable operating income expansion on the back of strong double-digit top-line growth as supply chain issues fall to the wayside in the coming quarters as economic conditions normalize.
Deere expects operating cash flow to get back on track during fiscal 2023 after a sizable decline in fiscal 2022. (Image Source: Deere)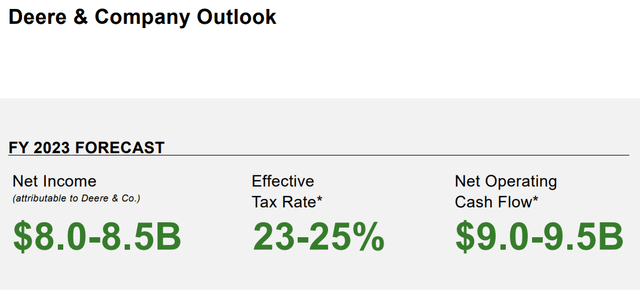
Deere has a sizable net debt position, which weighs on its Dividend Cushion ratio, and traditional free cash flow faced pressure on a year-over-year basis during fiscal 2022, but the company may be one of the best ways to combat inflation through equities. Management also expects operating cash flow to bounce back to the range of $9-$9.5 billion in fiscal 2023 from $4.7 billion in the recently completed fiscal 2022.
All things considered, we like what’s going on at Deere on a fundamental basis, particularly with respect to its fundamental pricing power, and its recent dividend increases have been welcome. We like the stock’s relative share-price strength this year, and our fair value estimate stands north of where shares are trading at the moment. Cyclical operations and a large net debt position are concerns, but Deere has a lot of things going for it at the moment, in our view. Shares yield ~1.1% on a forward estimated basis.
This article or report and any links within are for information purposes only and should not be considered a solicitation to buy or sell any security. Valuentum is not responsible for any errors or omissions or for results obtained from the use of this article and accepts no liability for how readers may choose to utilize the content. Assumptions, opinions, and estimates are based on our judgment as of the date of the article and are subject to change without notice.


Be the first to comment