

KanawatTH
Written by Nick Ackerman, co-produced by Stanford Chemist. This article was originally published to members of the CEF/ETF Income Laboratory on December 5th, 2022.
We last took a look at Doubleline Opportunistic Credit Fund (NYSE:DBL) earlier this year in July. In that piece, we took a look at the trio of funds that Doubleline offers. The fund was trading at a slight discount at that time, but it has since come to a slight premium now.
That premium makes it even less attractive yet compared to its sister funds, since they are at discounts. However, neither of the trio of funds is invested exactly the same. DBL holds a heavier weight towards higher quality holdings. I still suspect a switch could be beneficial.
The Basics
- 1-Year Z-score: 1.29
- Premium: 1.09%
- Distribution Yield: 8.86%
- Expense Ratio: 1.37%
- Leverage: 16.18%
- Managed Assets: $266.881 million
- Structure: Perpetual
DBL’s investment objective is “to seek high total investment return by providing a high level of current income and the potential for capital appreciation.”
To potentially achieve this objective, the fund will invest “in debt securities and income-producing investments of any kind, including, without limitation, residential and commercial mortgage-backed securities, asset-backed securities, U.S. Government securities, corporate debt, international sovereign debt, and short-term investments.”
The fund is leveraged, but only modestly so. That brings its total expense ratio up to 1.72%. Leverage increases risks to the downside as well as provides potential upside. Their debt is based on a floating rate of “daily SOFR plus the Term SOFR adjustment of 0.10% plus the applicable margin of 0.75%.” As interest rates rise, their leverage will cost them more and more. They’ve also reduced leverage from ~$60 million at the fiscal year-end 2021 to $44.169 million reported at the fiscal end of September 30th, 2022.
They aren’t directly hedged against rising interest rate costs either, as they borrow at floating rates. However, their underlying portfolio contains significant exposure to floating-rate debt via CLOs and bank loans. Even some of their non-agency RMBS and non-agency CMBS provide exposure to floating rates. Meaning that as interest rates rise, their income should benefit more and more. However, with the latest report, it looks like that did not play out.
Performance And Why A Switch Could Make Sense
The last article was published publicly on July 5th, 2022. Since that time, DBL has been the worst-performing amongst the Doubleline trio. That includes DoubleLine Yield Opportunities Fund (DLY) and DoubleLine Income Solutions (DSL).
YCharts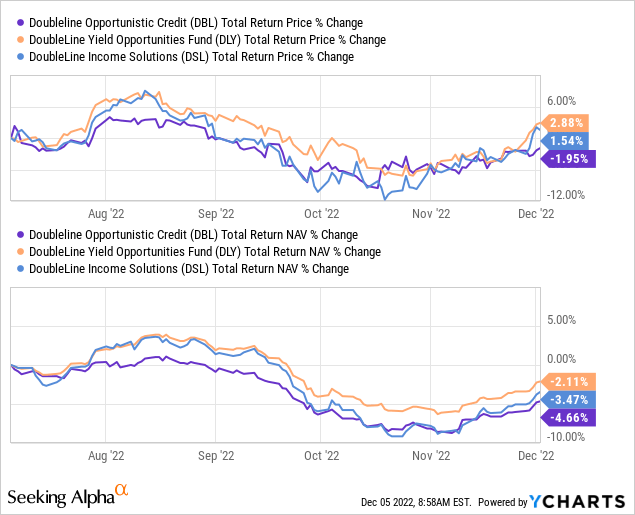
In fact, it has been the weakest performer since that article was published, despite being tilted more towards investment grade. That’s actually what we’ve been experiencing more broadly in the income space, as higher quality, investment-grade holdings, are more sensitive to interest rates. As interest rates rise, they get pushed down further.
DLY is a newer fund, unfortunately, so longer-term historical performance isn’t available. Here is how things have shaken out since DLY hit the market between this trio.
YCharts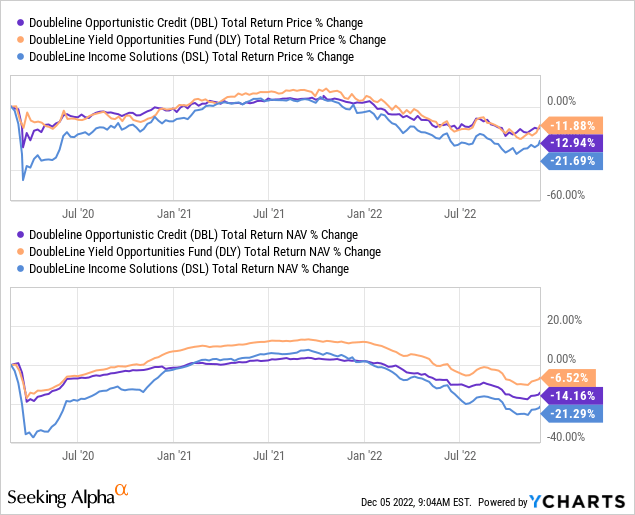
In this case, I want to put a specific emphasis on DLY relative to DBL, not just because it has been the better performer, relatively speaking. However, what is curious here is that both these funds have a somewhat similar duration of their portfolio provided.
DBL has a duration of 2.67 years and an average life of 5.39 years. Also worth noting is the average market price of $90.94 for its underlying portfolio.
DSL has a duration of 4.15 years, an average life of 7.80 years and a truly deeply discounted average market price of $65.12. While tempting for the more aggressive investor with its significant weighting to emerging markets and a truly deep discount, I want to skip past this one and go to DLY.
DLY has a similar duration of 2.46 years and a somewhat similar 6.27-year average life. However, the fund’s average market price comes to $81.21. That’s also more attractive to DBL.
For what it’s worth, in my previous article, the average market price of these funds was $100.19 for DBL, DLY at $91.51, and DSL was $79.18. So clearly, bond prices have continued to come down from earlier this year. Basically, as expected, interest rate increases continued to come through. Not only the fact of increase, but the expectations continue to rise of even higher rates to come. A terminal rate of over 5% is now a possibility.
With all this being said, it isn’t even to mention that DLY presents the most attractive discount of the trio of funds at this time.
YCharts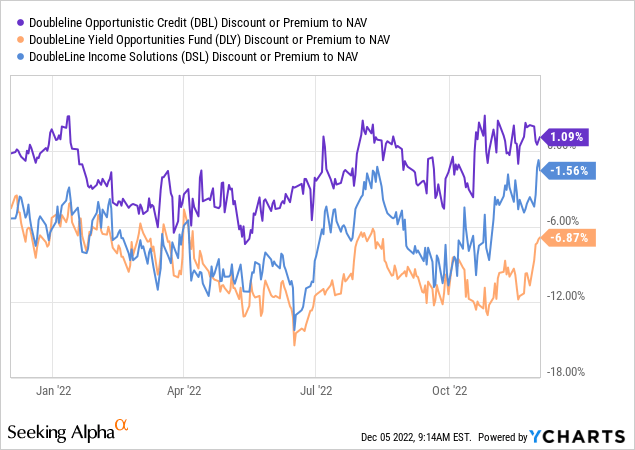
That’s why I believe that if one can take a bit more risk, DLY is worth considering over DBL. Essentially, by investing in DLY, you get a bigger discount, and the underlying holdings are discounted even further to make up for the higher risk.
Although it should be noted that a premium from DBL isn’t all that uncommon. In fact, it had traded at significantly higher premiums before. I don’t want to disregard historical discount/premium ranges, as they tend to prove worthwhile paying attention to. That being said, were 10% premiums really justified? I don’t believe so.
YCharts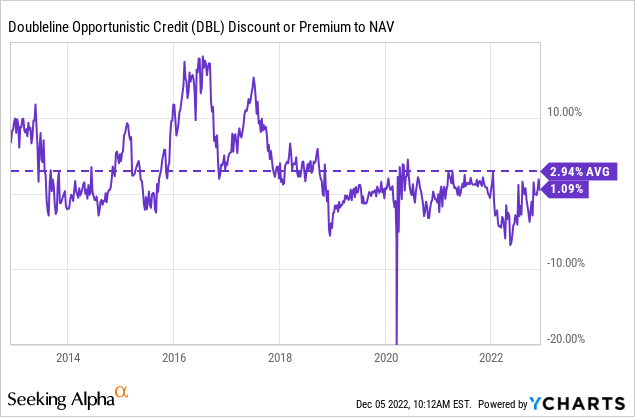
Distribution – Coverage Lacking And NII Declined
The fund has one cut in its history. However, coverage wasn’t looking great with the latest report. Worth noting that the special of $0.387 is missing from the chart below for 2020, which will be important in the next paragraph.
DBL Distribution History (CEFConnect)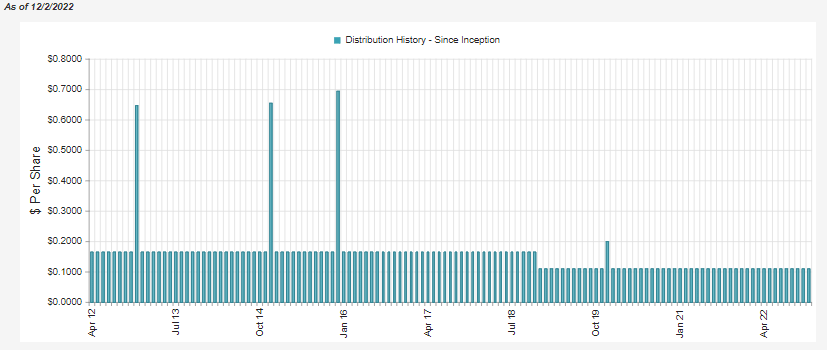
The fund’s total net investment income had dropped year-over-year, bringing down the coverage. In fiscal 2021, the fund paid a special of $0.387 at the end of 2020, which would be reflected in fiscal 2021 due to the September year-end. That’s why we see the distributions to shareholders at a meaningfully larger level than it was this year, despite the same $0.11 regular.
DBL Annual Report (DoubleLine)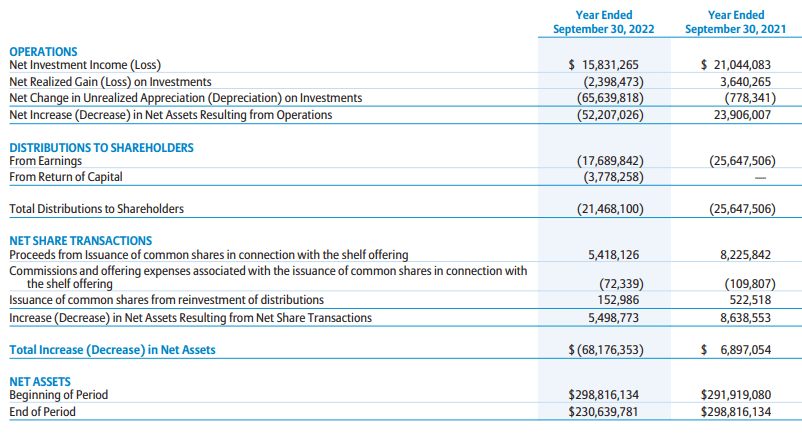
At NII coverage of 73.74%, that isn’t too encouraging. This was reflected in the per share data listed in the financial highlights of the latest report. NII came to $1.01, down from $1.40 and down even further from the $1.60 hit in fiscal 2020. That works out to an NII drop year-over-year of around 25%.
In the prior year, they were able to pull in a higher total investment income of $25.863 million compared to this year’s $20.522 million. Interest expenses ran up from $620.7k to $929.204k. That is expected as their leverage costs rise due to rising rates.
As noted above, their floating rate exposure should have counterbalanced some of this, but that clearly didn’t happen. Part of this is due to deleveraging that they had taken, which limits the leverage costs by borrowing less, but it also means less income-generating capital at work too.
As an actively-managed portfolio, portfolio changes likely contributed to some changes too. Although, at the broader level, the portfolio didn’t change security type breakdowns all that meaningfully.
All this doesn’t bode well with coverage dropping, and a distribution cut could be in the cards. In this category, DLY isn’t a shining star, either. However, NII coverage in their report came to 90.6%. At the same time, their NII dropped only marginally year-over-year by ~$94k or about 0.15%.
DBL’s Portfolio
For the most part, DBL is pretty well diversified amongst various fixed-income assets. The largest exposure is to CLOs at 30.7%; the non-agency CMBS then follows this at 21.1%, agency RMBS at 13.7%, and 12.6% allocated to non-agency RMBS.
There is then another 8.1% in individual bank loans. These will be the senior loan funds that provide floating rate exposure. CLOs are pooled senior loan funds, then the CLO tranches are broken down into individual tranches. This means they will also benefit from providing floating rate exposure during this higher interest rate environment.
DBL Asset Exposure (DoubleLine)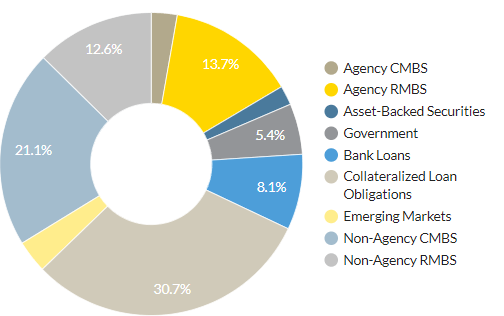
With these sorts of weightings, one carries credit risks with this portfolio. The quality of the portfolio skews to below-investment grade but perhaps not as much as one might originally think.
There is also considerable mortgage-related debt this fund is carrying – mostly of the non-agency type. On the other hand, we have agency exposure via Fannie Mae and Freddie Mac, government-sponsored entities. There is also Ginnie Mae issued mortgages, the government-owned entity. Several of these in their portfolio are subject to a floating rate while being less risky compared to non-agency.
DBL Credit Quality Breakdown (DoubleLine)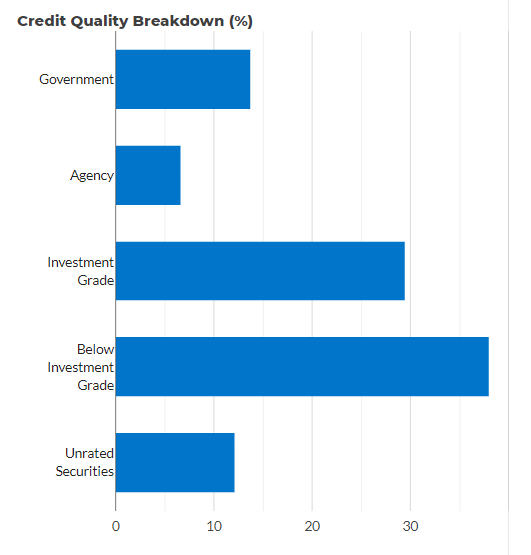
Then there is also U.S. Government exposure the fund is carrying. Some of the exposure there is tied up with U.S. T-Notes, yielding 3.13% as of their latest annual report; it was listed as 6.3%. As interest rates are rising on their leverage expenses, it can be important to watch how much they are holding in cash or cash equivalent holdings.
The portfolio’s turnover was at 25% in the last year, which was close to the usual over the last five years. In 2021, they listed a 46% turnover rate, which was an outlier. For the most part, this means that exposure isn’t changing rapidly for the most part. The portfolio breakdown we see above is fairly consistent with what we saw listed earlier this year.
Conclusion
DBL and most fixed-income funds are having a tough year. That includes most of the equity market having a volatile year too. We tend to see closed-end fund discounts widen in these cases. However, DBL has remained at a premium through this period. That isn’t all that uncommon for this fund over the longer term, but I believe that DLY presents a more compelling case even if it is riskier due to portfolio positioning.
Be the first to comment