Written by Nick Ackerman, co-produced by Stanford Chemist. This article was originally published to members of the CEF/ETF Income Laboratory on November 21st, 2022.
Calamos Strategic Total Return Fund (NASDAQ:CSQ) continues to hold right near parity with its net asset value per share. This is at a time when most of the closed-end fund market has experienced widening discounts. For the most part, CSQ is at the mercy of the broader market. They hold a fairly diverse portfolio of equities, convertibles and high-yield bonds. As such, the fund has experienced some significant losses for the year – along with most everything else.
When we previously touched on the fund, it was at a bit of a discount. While the overall market has been dragged into a bear market through 2022, the premium returning for CSQ makes it something that I wouldn’t consider buying at this time. On the other hand, I don’t plan on selling my position either, so it is still worthwhile to see what changes might have taken place since our last update.
The Basics
1-Year Z-score: 0.99
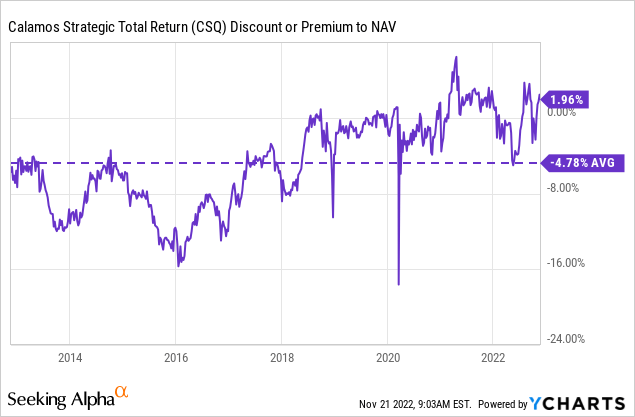
Premium: 1.96%
Distribution Yield: 7.87%
Expense Ratio: 1.48%
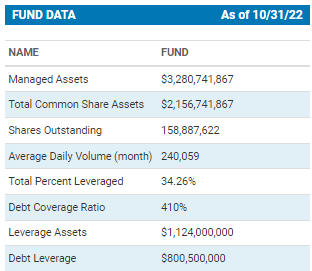
Leverage: 34.26%
Managed Assets: $3.28 billion
Structure: Perpetual
CSQ’s objective is to seek “total return through a combination of capital appreciation and current income.” They attempt to achieve this simply by; “investing in a diversified portfolio of equities, convertible securities and high yield corporate bonds.”
The fund has the ability to invest where they see the best opportunities might be. That is part of the appeal of active management, the flexibility to adapt to different situations. Though it should be noted that the fund will have “at least 50% in equity securities.”
With the fund’s leverage, the expense ratio comes to 2.10%. This is expected to rise since the fund has exposure to variable rate borrowings. In fact, since our last update, the fund has increased its exposure to variable rates.
They had $720 million in borrowings at the end of July 2022 but now list $800.5 million. Worth noting, however, is that it is still down from the $880 million they had in April 2022. They seem to be adjusting leverage here quite significantly from update to update.
CSQ Fund Data (Calamos)
This leaves them with $323.5 million in preferred shares as leverage outside of borrowings. They had announced they were redeeming their Series A Preferred shares, which were mandatory redeemable preferred. We also noted that the Series F launched earlier this year to “pre-offset” this fixed and known redemption date. These remain fixed-rate preferreds, which helps provide stability to leverage costs while interest rates rise rapidly.
Still, just like any leverage, it adds additional volatility and risk to a portfolio. One needs to be comfortable with leverage before considering a leveraged fund.
Performance – At The Mercy Of The Market
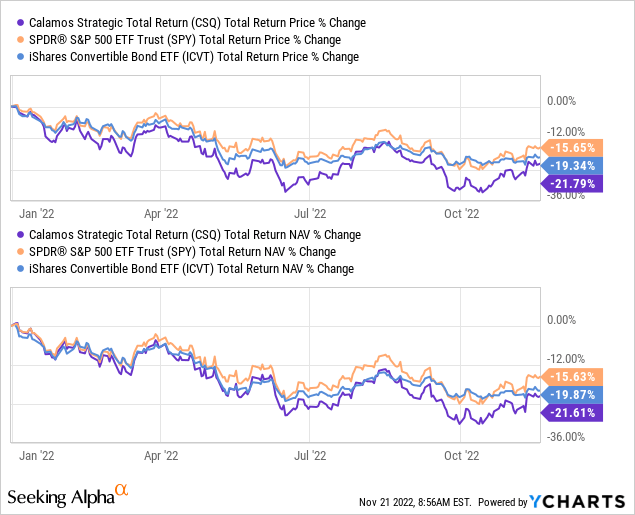
The results for CSQ YTD show us that it is underperforming the broader market and the iShares Convertible Bond ETF (ICVT). CSQ has some meaningful exposure to convertibles, even some material exposure to high-yield bonds. This isn’t that unexpected, given the fund’s utilization of leverage. In fact, I’m surprised that the losses weren’t even a bit steeper, considering the elevated levels of leverage of the fund.
Ycharts
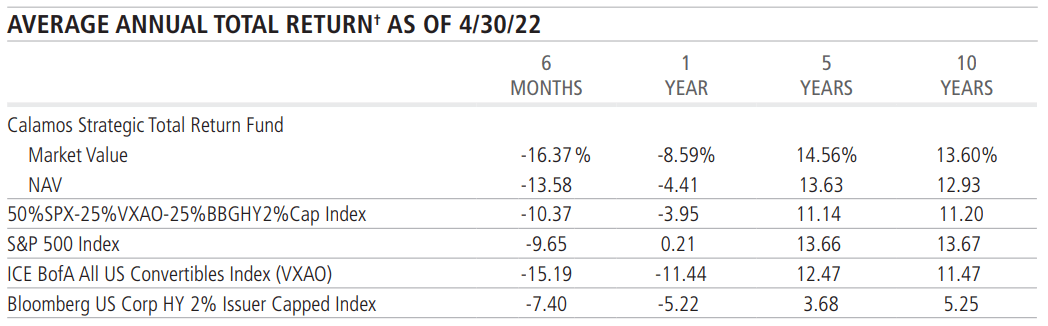
Leverage works both ways, though. Looking at the blended benchmark they provide in their semi and annual reports, we can see that the fund has outperformed over the longer term. It even came in competitively to the same performance as the S&P 500 over the last decade.
Note that these results are from their semi-annual report, which was as of April 30th, 2022. Since then, the fund (and everything else) has experienced further losses. Still, it can provide us with some general context of the fund’s historical performance relative to various benchmarks. We should get a new annual report right at the end of the year if history is any indication.
CSQ Annualized Return Comparison (Calamos)
Despite the volatility and the overall general widening in discounts for CEFs, CSQ has been holding up incredibly well. It has continued to hug right near parity with its NAV. That’s been a common occurrence going back for several years now.
However, it wasn’t always that way. This fund had traded at deep discounts in the past. That is ultimately what makes me the most hesitant to add at this time, despite the actual valuation of the market pulling back across the board.
Ycharts
Distribution – Cautious
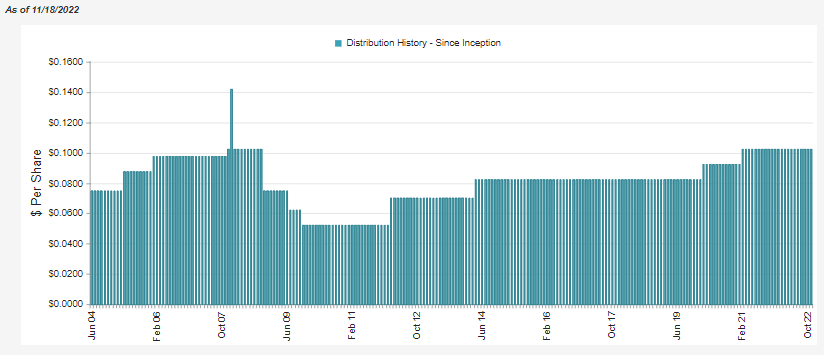
Calamos has shifted around CSQ’s payout on several occasions, depending on the different environments.
CSQ Distribution History (CEFConnect)
They’ve also maintained the distribution for now after cutting a couple of payouts from their global funds. The funds they cut had higher distribution rates, but CSQ’s distribution yield has also been creeping up quite materially. Note that the distribution yield here is only based on the share price. Through 2016 when the fund was trading at a large discount, that artificially propped up the payout to shareholders.
In hindsight, that was an incredible opportunity to pick up shares. On an NAV basis, the yield would have been materially lower. The fund has to earn the NAV distribution yield to continue maintaining the rate to shareholders. The share price distribution yield is just a function of the premium/discount.
Ycharts
All the Calamos funds have one thing in common: they all rely heavily on capital gains. Convertible bond exposure doesn’t pay what it used to in a 0% rate environment for most of the last decade. As rates rise, yields should rise going forward, but it’ll take some time to turnover their portfolio.
As a fund that relies on capital gains quite significantly, that means there is always a risk of a cut during a downturn. The longer the downturn, the higher the risk for a cut.
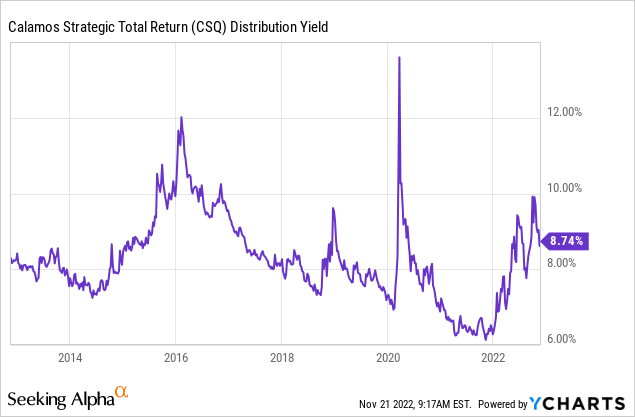
At this time, the fund’s distribution rate comes to an attractive 8.74%. On a NAV basis, due to the premium, the rate comes to 8.91%. With no new report since our last update, we don’t have any updated coverage to look at. This is common; most closed-end funds don’t provide any quarterly financial updates.
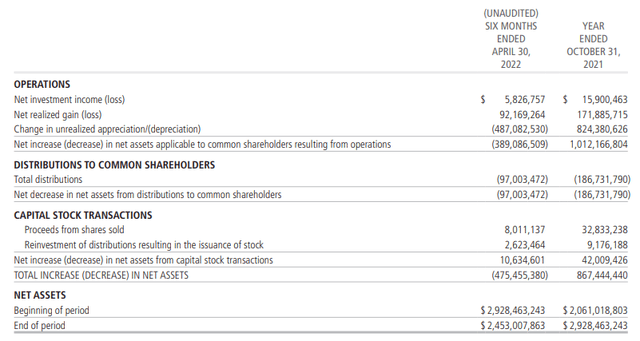
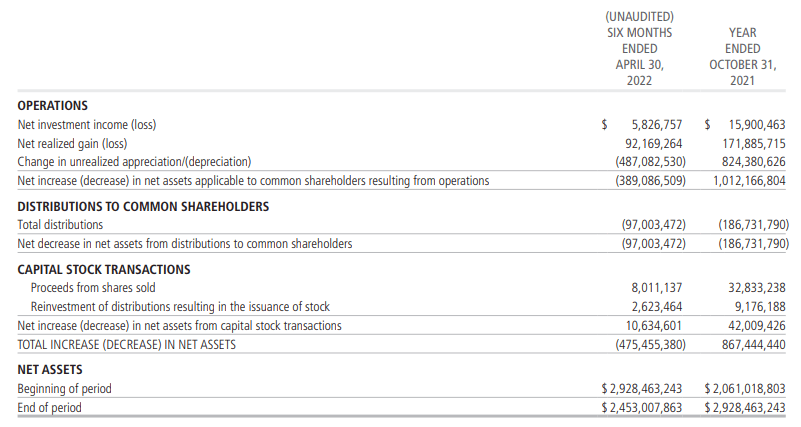
CSQ Semi-Annual Report (Calamos)
What we see above is that for the six months ended April 30th, 2022, the fund received around $5.827 million in net investment income. That figure is the total investment income minus expenses. That’s against the ~$97 million they had paid out to shareholders. That works out to NII coverage of just 6%. The remainder has been covered through realized gains at this point. However, with a weak market, it could become more difficult to find those gains.
For now, at a 7.87% distribution yield and an 8.15% NAV distribution yield, I don’t suspect they will cut. It will be something to continue to watch for, though.
For now, I would remain cautious as the distribution yield ticks higher on the NAV. If we get a recovery through the end of the year, which we’ve been experiencing over the last couple of months now, we have less to worry about.
CSQ’s Portfolio
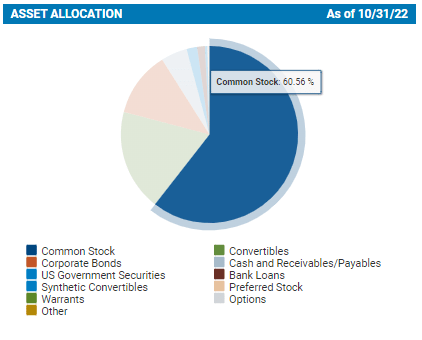
The latest portfolio update, as of the end of October 2022, shows us once again that common stocks are the largest weighting of the fund. Given the minimum 50% exposure investment policy to equities, this also isn’t too surprising. With a turnover rate of 24% last reported, this fund isn’t necessarily the busiest in terms of making changes. However, it also means the managers aren’t sitting around not doing a thing either.
CSQ Asset Allocation (Calamos)
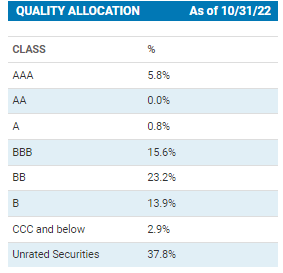
The fund also has 18.55% allocated to convertibles and 11.95% invested in corporate bonds. The large “unrated” exposure in the credit quality would be due to the convertible bond exposure. Convertible bonds are often issued to qualified institutional buyers. In order to get these securities issued faster and cheaper, they forgo the rating process and can sell right to institutions. These institutions would presumably be doing their own due diligence and internal ratings.
However, with FTX recently, perhaps that was an assumption we shouldn’t always make.
CSQ Credit Rating (Calamos)
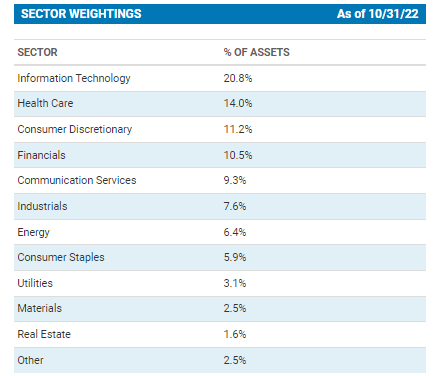
CSQ remains overweight tech, but not overwhelmingly so. In my opinion, reducing exposure to tech and providing a more diversified portfolio can be attractive. The S&P 500 had become significantly overweight to tech. This has begun to reverse some of the deeper losses in tech this year. The SPDR S&P 500 (SPY) now shows a 26.44% allocation to tech, from the 28.40% weighting previously.
CSQ has also been lowering its tech exposure, whether through portfolio changes or the declines in the tech space. Exposure there now slips to below 21% from the 22.2% previously and the 24% weighting before that update.
CSQ Top Sector Allocation (Calamos)
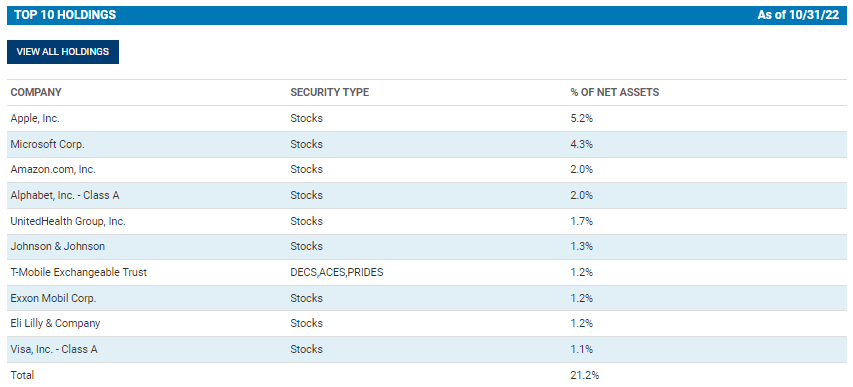
When looking at the top ten exposure, we see the usual suspects of the mega-cap tech names in the top spots. At least in this way, that keeps the fund from underperforming the S&P 500 too significantly. The exposure here is dominated by these mega-cap names with a significant 13.5% weighting. That was a decline from the 15.2% weighting previously.
As a result of that shift, it would appear that the top ten exposure concentration came down from 22.6% to the 21.2% reflected in this latest update. As we get near the bottom of the top ten, the weightings in each name become quite shallow.
According to CEFConnect, they carried 794 holdings at the end of September. Again, this reflects a likelihood of simply moving with the market rather than providing significant outperformance. Where outperformance can come from is the leverage during good times. As long as the good times last long enough, it should do well.
CSQ Top Ten (Calamos)
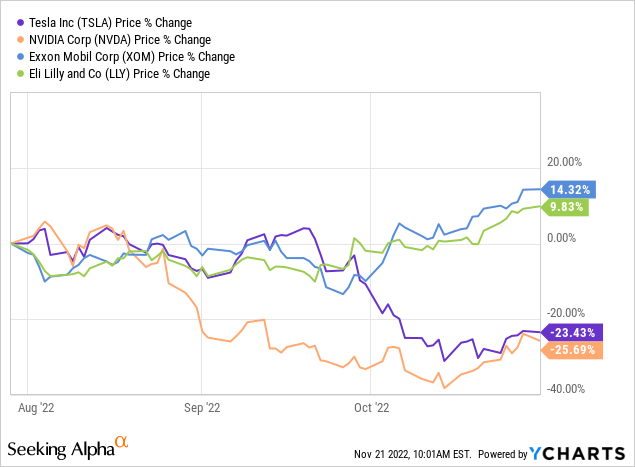
Two names have fallen from the top ten, Tesla (TSLA) and NVIDIA (NVDA). These have been replaced with Exxon Mobil (XOM) and Eli Lilly (LLY). However, these have likely remained as positions but slipped in their weightings.
Here’s a look at the performance of these four positions since the July 31st, 2022, top ten holdings list that reflected TSLA and NVDA as top holdings. For the most part, things were holding steady for these funds, and the significant divergence came in September for NVDA. TSLA joined the relatively larger declines in October. They haven’t been able to grab traction yet, while XOM and LLY have continued higher.
Ycharts
Movements such as this above further reflect why there was a change in the tech weighting of the fund. Of course, reduced positions in the mega-cap tech names also contributed. Apple (AAPL) went from a 5.5% weight to 5.2%, Microsoft (MSFT) went from 4.9% to 4.3%, and Alphabet (GOOG) dropped from 2.3% to 2%. Amazon (AMZN) is labeled as a consumer discretionary position, but they, too, saw their allocation to CSQ dip. AMZN very much acts like a tech stock.
Conclusion
CSQ remains trading right near parity with its NAV. In fact, the fund has climbed to a premium from the shallow discount it had touched previously. The overall market has declined, taking CSQ with it. However, with this higher valuation on the fund, it would appear there are better places to put capital to work. At the same time, I plan to continue to hold my position here as it isn’t grossly overvalued.
Please note that foreign exchange and other leveraged trading involves significant risk of loss. It is not suitable for all investors and you should make sure you understand the risks involved, seeking independent advice if necessary.


Be the first to comment