

onurdongel/E+ via Getty Images
Risk-Off Grips the Crypto Landscape
When it comes to the world of cryptocurrency, the sparseness between risk-on versus risk-off is akin to making a small fortune versus total bankruptcy. It is the former that grabs the attention and lust of retail traders, whilst it is, unfortunately, the latter in which we are experiencing at present. Over the past few days, we have seen approximately 265,770 cryptocurrency traders and investors be fully liquidated, with around $1.26b in capital destroyed. Unfortunately, with a speculative and high-beta asset, these are the ever-present risks that come to the fore during a liquidity and growth cycle downturn.
The current drawdown in Bitcoin (BTC-USD) since its all-time high in November is now circa 70%. Again, this is to be expected of such an asset class, and as we can see below, historically bear markets for BTC have seen prices fall anywhere from 70% to 90%. History would tell us there may be more pain ahead.
Glassnote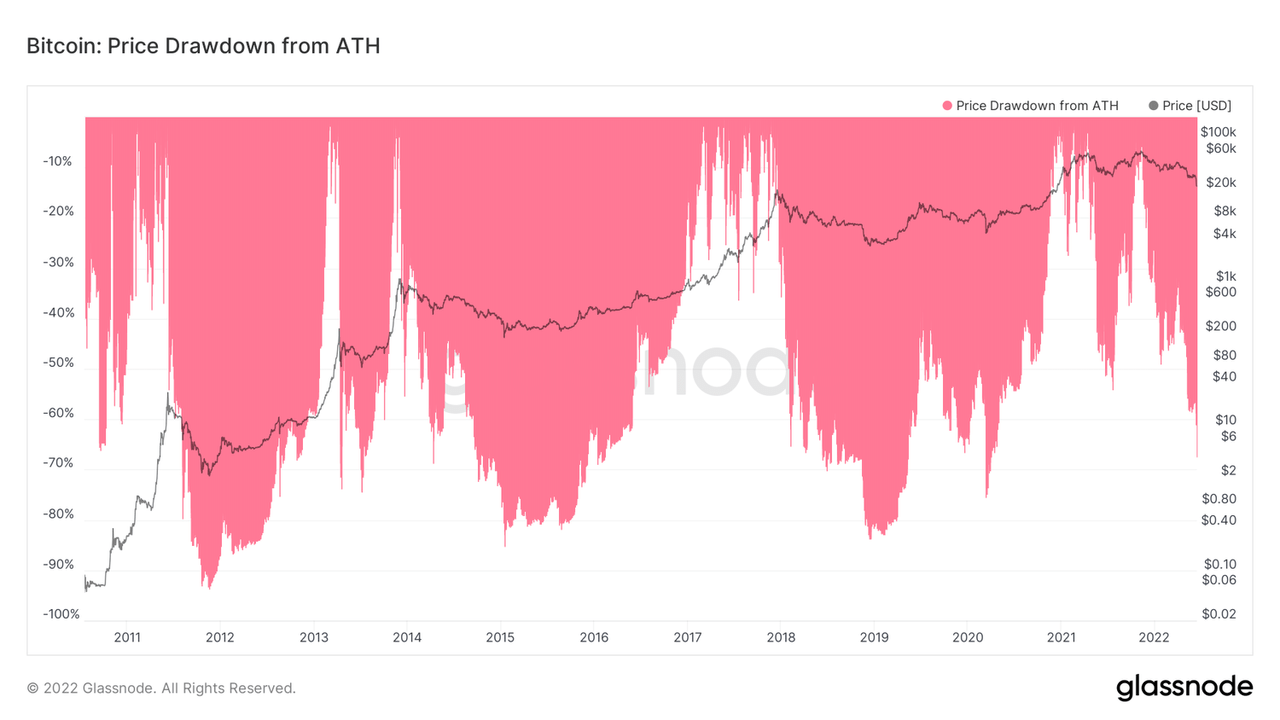
We are witnessing true capitalism at work within the crypto space at present. Layoffs (as seen by BlockFi cutting staff by 20% and Coinbase (COIN) reducing its workforce by 18%, among others), the demise of LUNA, and deteriorating VC investment are some such examples of the pain underway within the market. Though these developments ought to lead to a brighter future, things are likely to get worse before they get better (looking at your MicroStrategy (MSTR)). Creative destruction is perhaps capitalism at its finest.
Looking at the technical picture, we can clearly see a chart that looks like it wants to go lower given the significance of what looks to have been a massive head and shoulders top. Though we will likely find support around the $20k level, an area that coincides with both the previous cycle’s all-time highs back in late 2017 and the 200-week moving average, given the macro backdrop and how previous crypto bear markets have seen drawdowns of far greater significance than present, $10k-$15k looks to be a possibility at some point this year.
StockCharts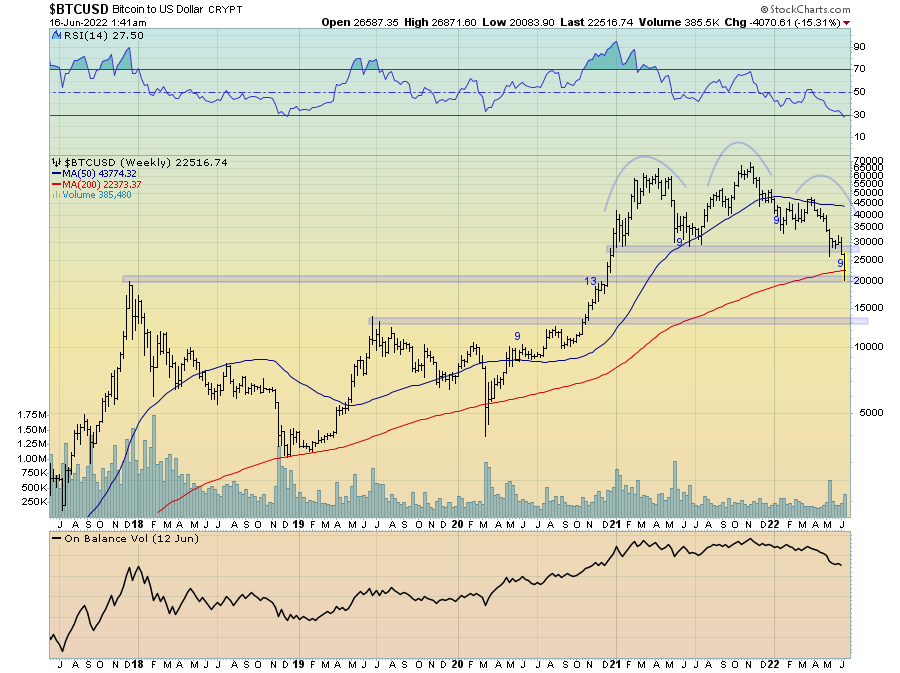
For BTC, the 200-week moving average has been an important area of support in recent years. Indeed, this moving average acted as support for the final lows during the previous bear market in late 2018/early 2019, as well as during the March 2022 crash. I suspect we could bounce hard off this level in the short term, especially when we consider the context of this flush-out occurring in line with a weekly DeMark 9 setup buy signal.
For Ethereum (ETH-USD), the technical picture is much the same. The current price is too flirting with the 200-week moving average around $1,250, a level which also coincides with the previous cycle high in January 2018 and ETH’s own weekly DeMark 9 setup buy signal. As such, I suspect this level will hold for the time being and form the basis of a short-term bounce. Should we break below this level in the coming months, sub-$1,000 ETH is likely with their being very little technical support until around $500-$750. I will note however the 200-week moving average has less historical significance for ETH given its limited lifespan.
StockCharts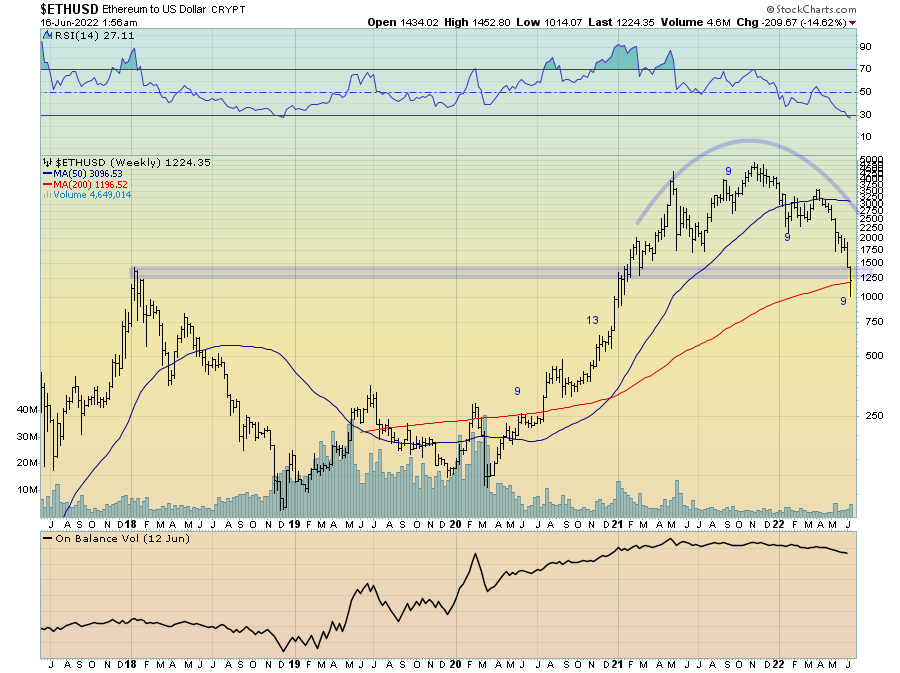
What leads me to believe reaching low-teens BTC and sub-$1,000 ETH during this bear market is a distinct possibility is their historical volume by price. By examining volume at different price levels, helps us gauge where potential support and resistance levels may reside. Given there is comparatively little historical volume between $30k and $15k for BTC, it should not be surprising to see prices move lower over the coming months until it can find support at these lower levels.
StockCharts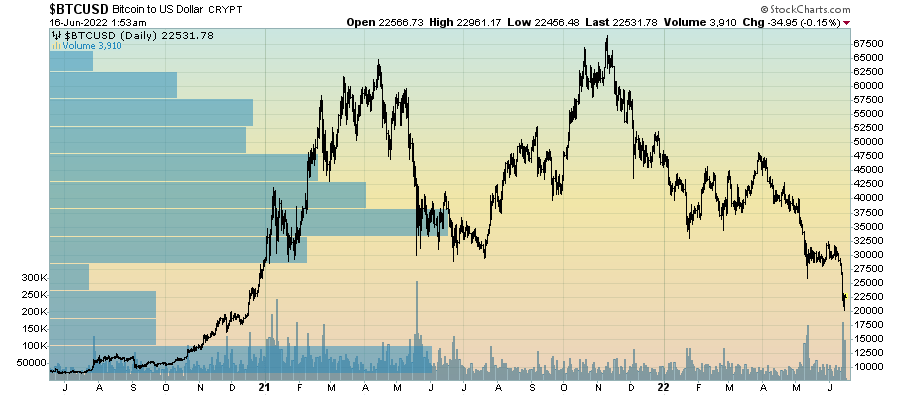
A similar volume analysis on ETH also suggests there may be little support between $1,000 and around $500-$600. Clearly, the $1,000 area looks to be an important level for ETH.
StockCharts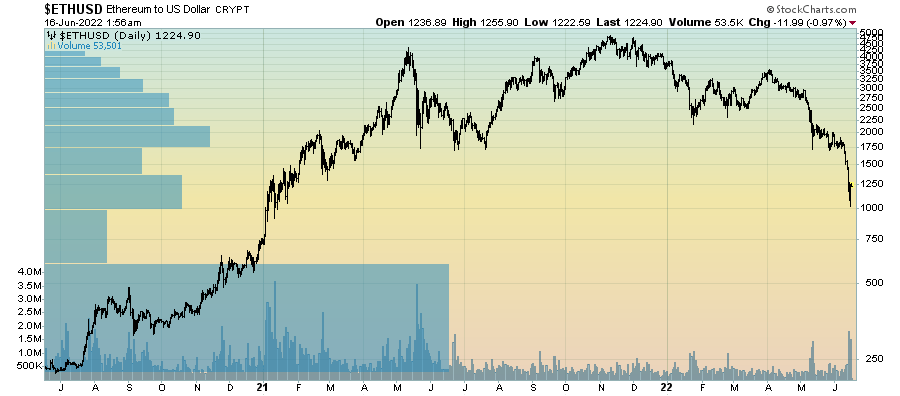
One technical sign I have been looking for to help provide an indication of a bottom (or at least the beginnings of one) is a capitulation-like spike in downside volume. Whilst not a prerequisite for a market bottom, a significant spike in volume helps to provide comfort that selling pressure may be waning. We saw such spikes in BTC during the 2017, 2020, and 2021 lows.
Whilst this is yet to show up on the weekly charts for either BTC or ETH above, the recent move lower has indeed seen a notable pick-up in downside volume on the daily chart.
StockCharts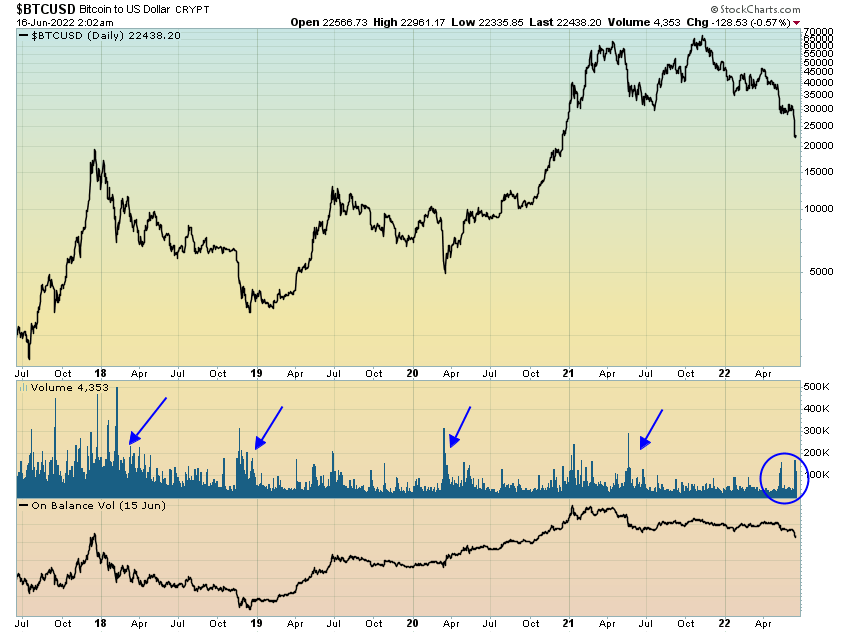
From a macro perspective, crypto markets continue to trade as high-beta risk assets and are doing so step-for-step with the high-beta/low-beta ratio. The latest move lower is largely in-line with what we should expect given the growth cycle and liquidity cycle outlook, one that does not portend favourably for risk assets.
StockCharts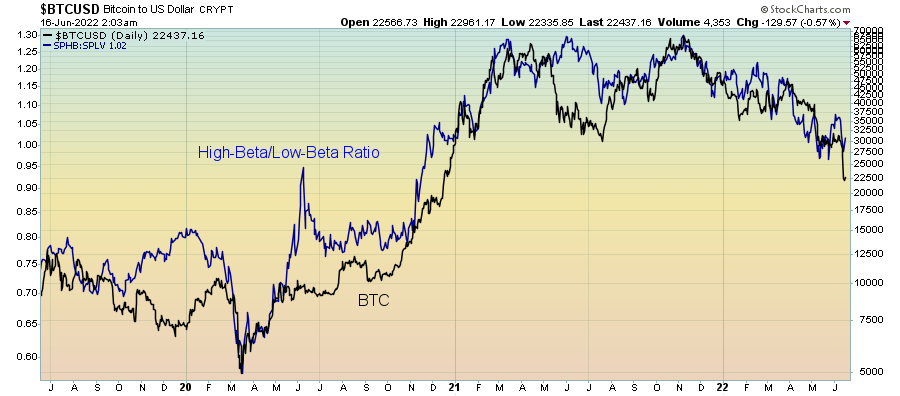
Indeed, with the macro backdrop indicating the high-beta/low-beta ratio continues to roll over in the coming months, crypto is not the place to be allocating significant portions of your capital at present.
Author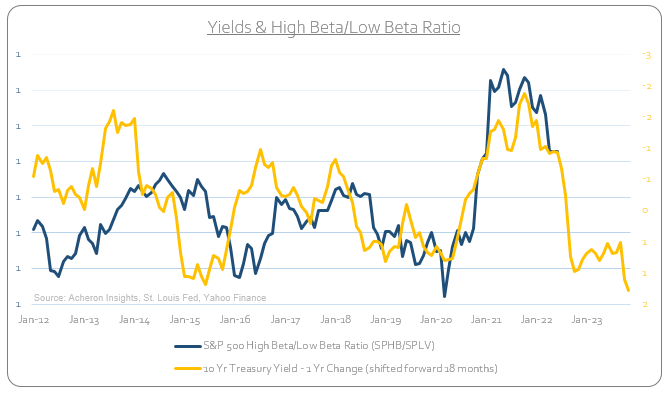
Indeed, on a relative basis, we are seeing BTC itself break down compared to equities.
StockCharts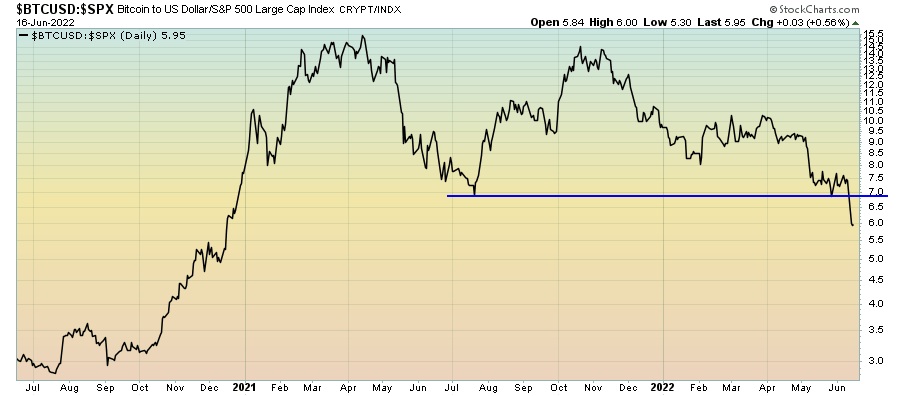
And continue to break down versus commodities.
StockCharts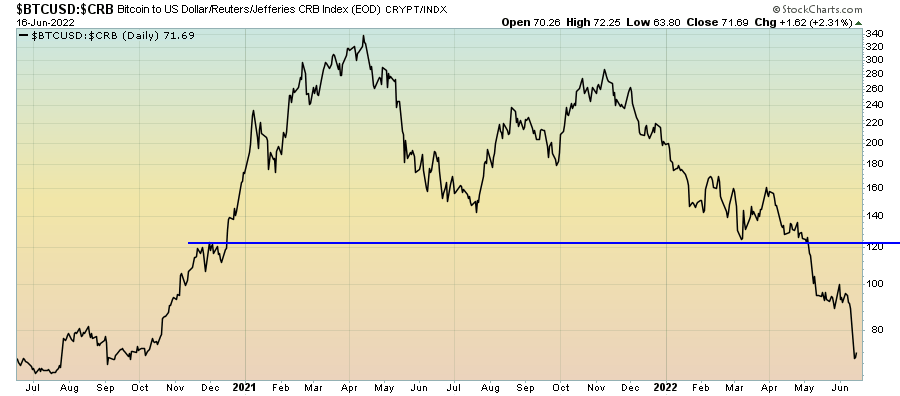
All the while looking like it wants to go lower versus bonds.
StockCharts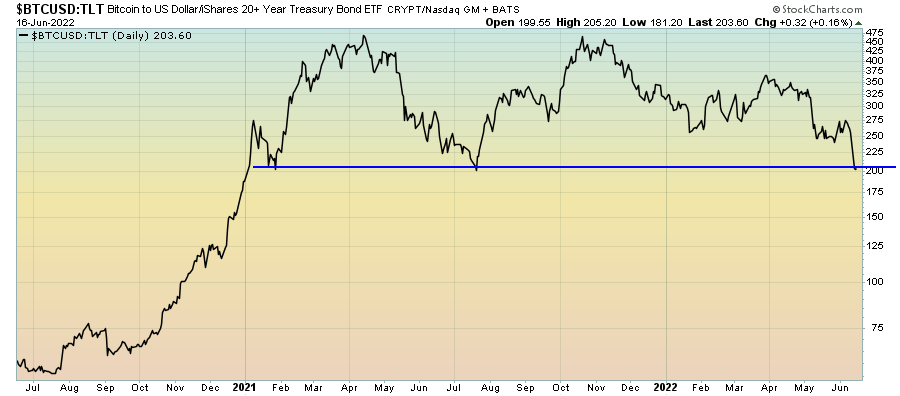
Despite the attractiveness of the future of digital assets as an asset class, it won’t be as a store of value but rather as a high-beta risk asset. As such, investors must adjust their expectations accordingly and understand how such assets behave during growth and liquidity cycle downturns. Again, both are suggesting investors remain underweight such assets for the time being.
Seasonality is also confirming this message, with the June to September period tending to be the least favourable for crypto relative to most other months.
Coindesk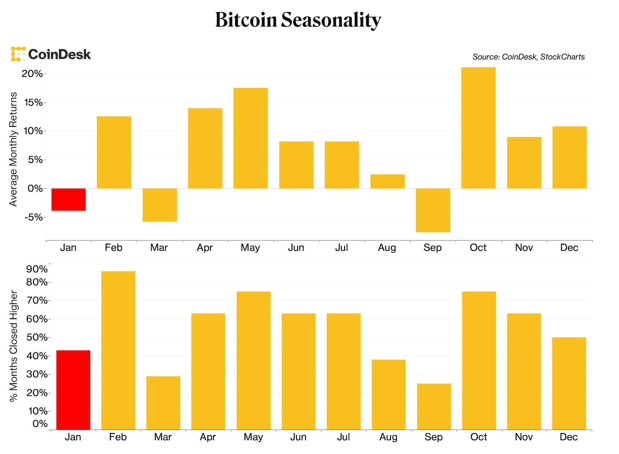
From a sentiment standpoint, crypto is almost as hated as it has ever been. Whilst this can be viewed as a contrarian buy signal, sentiment indicators within the crypto markets tend to display an inherent level of imbedded momentum, in that extreme sentiment readings to the upside tend to remain elevated for long periods and precede higher prices, whilst extreme readings to the downside tend to precede lower prices in the short term.
To me, the current levels in the Crypto Fear & Greed Index are confirming the downtrend rather than providing a contrarian buy signal.
Author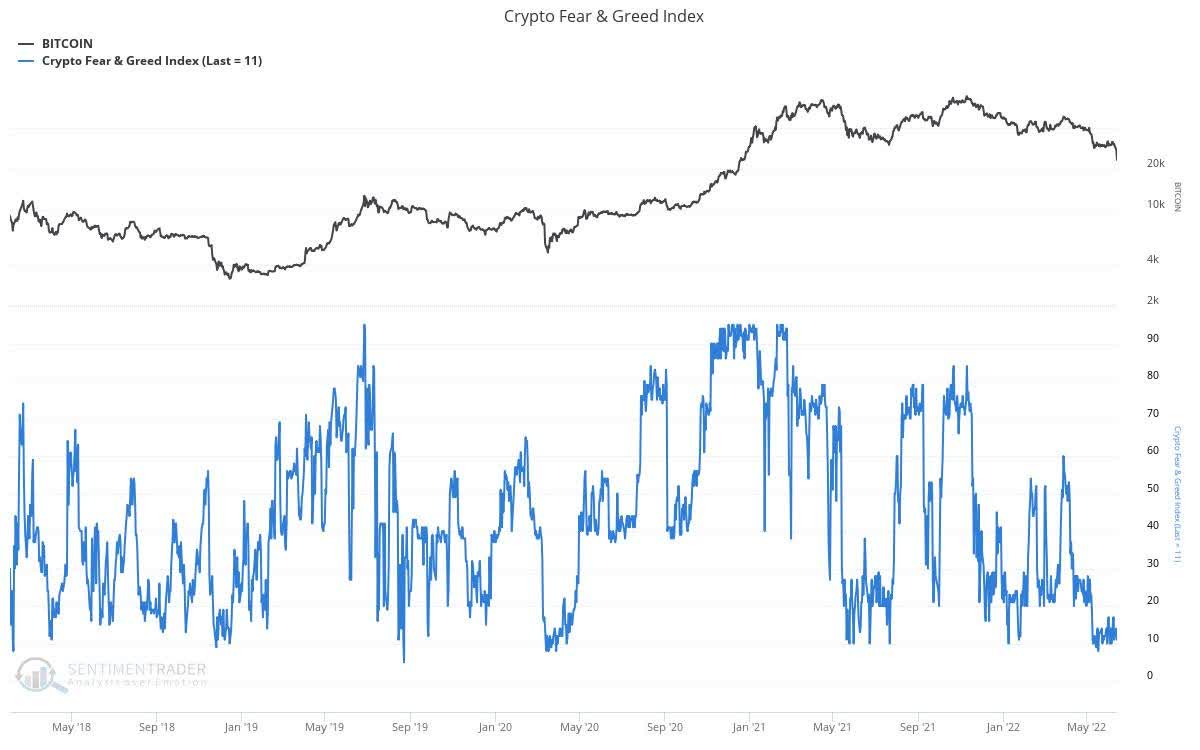
Looking now to the futures and derivatives markets, what is interesting is that whilst the latest flush-out has seen a significant unwind in futures open interest for BTC, open interest continues to lag price and remains somewhat elevated compared to the lows seen during mid-2021. There is still more leverage in the crypto system now compared to the lows of last year. However, as the futures market is generally used for traders of a short-term time frame due to the excessive roll costs associated with holdings futures contracts for long time periods, buyers of the Bitcoin futures ETFs who intend to hold for the long-term would cause the open interest data to be skewed to the upside. As a result, looking at Bitcoin open interest in isolation as means to assess speculative leverage within the system may be misleading.
Author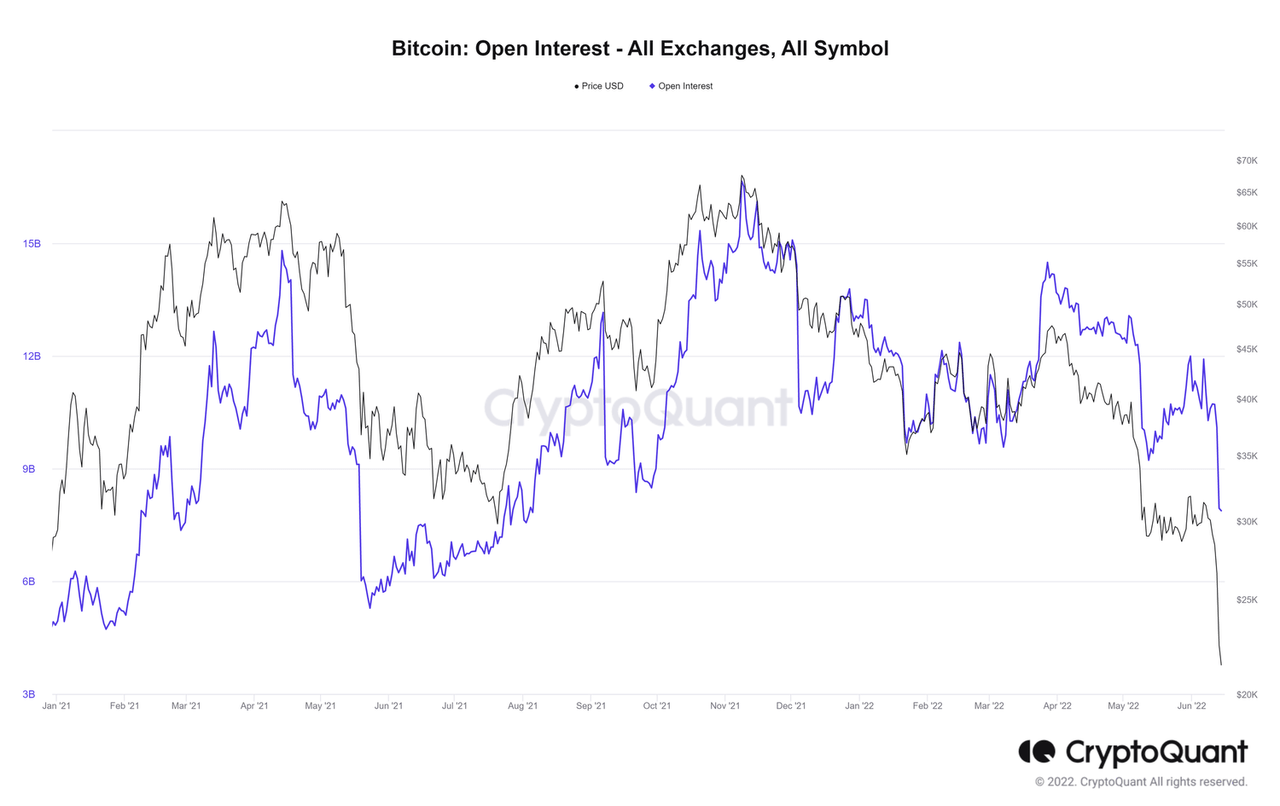
The fact that Ethereum’s open interest is now back down to its mid-2021 lows is somewhat confirmative of the idea that much of the leverage has now been washed out. This significant unwind in leverage within the crypto ecosystem should help to slowly set a floor in price going forward.
Author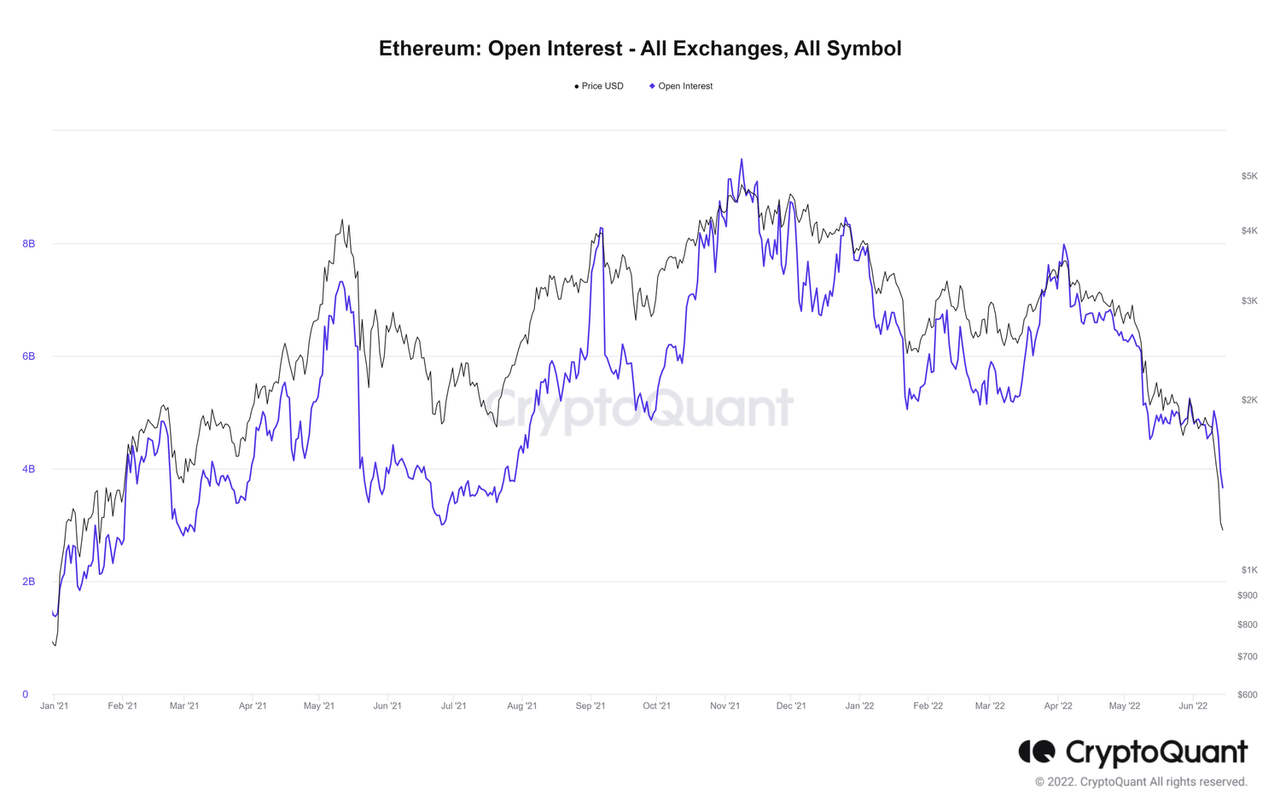
We have also seen the largest level of Long Liquidations (in dollar terms) in BTC derivatives markets since the Q2 2021 sell-off, again confirming this washout of leveraged long positions.
Author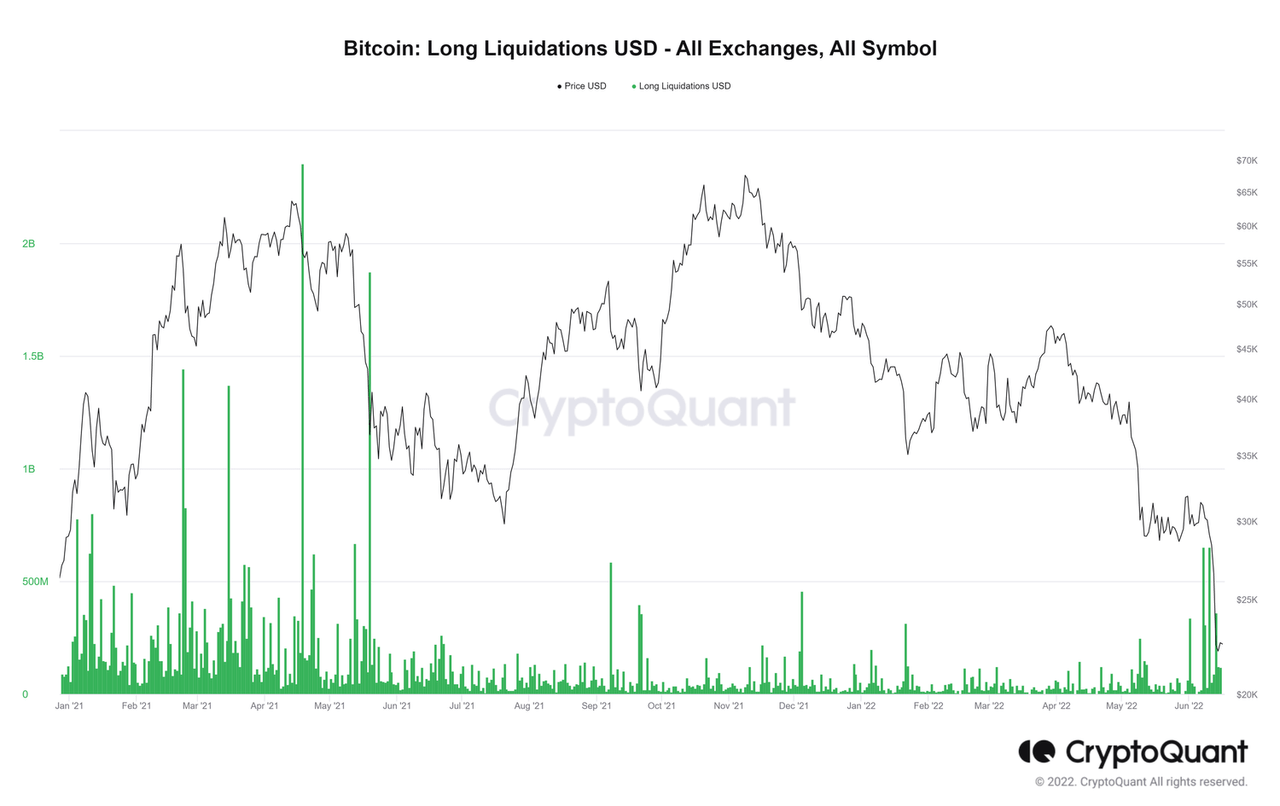
If we turn now to some of the on-chain metrics for Bitcoin and the crypto space, we continue to see many indicators slowly but surely reaching levels indicative of excellent long-term buying opportunities in the past. However, I should preface this section by reminding readers not only can many of these metrics continue to move lower, but they also can remain suppressed for long periods. Thus, investors willing to deploy capital would be best to do so in a conservative manner.
Beginning with several on-chain metrics measuring capitulation and profitability of crypto holders, specifically the Net Unrealised Profit/Loss (NUPL) ratio for BTC, we can see the latest drawdown has pushed this ratio down to its lowest level since March 2020. Readings above zero tend to indicate investors are by and large in profit, with sub-zero readings (where we reside at present) indicative of the opposite. Clearly, many holders are in a world of pain at present as they are realising losses on much of their crypto holdings.
Author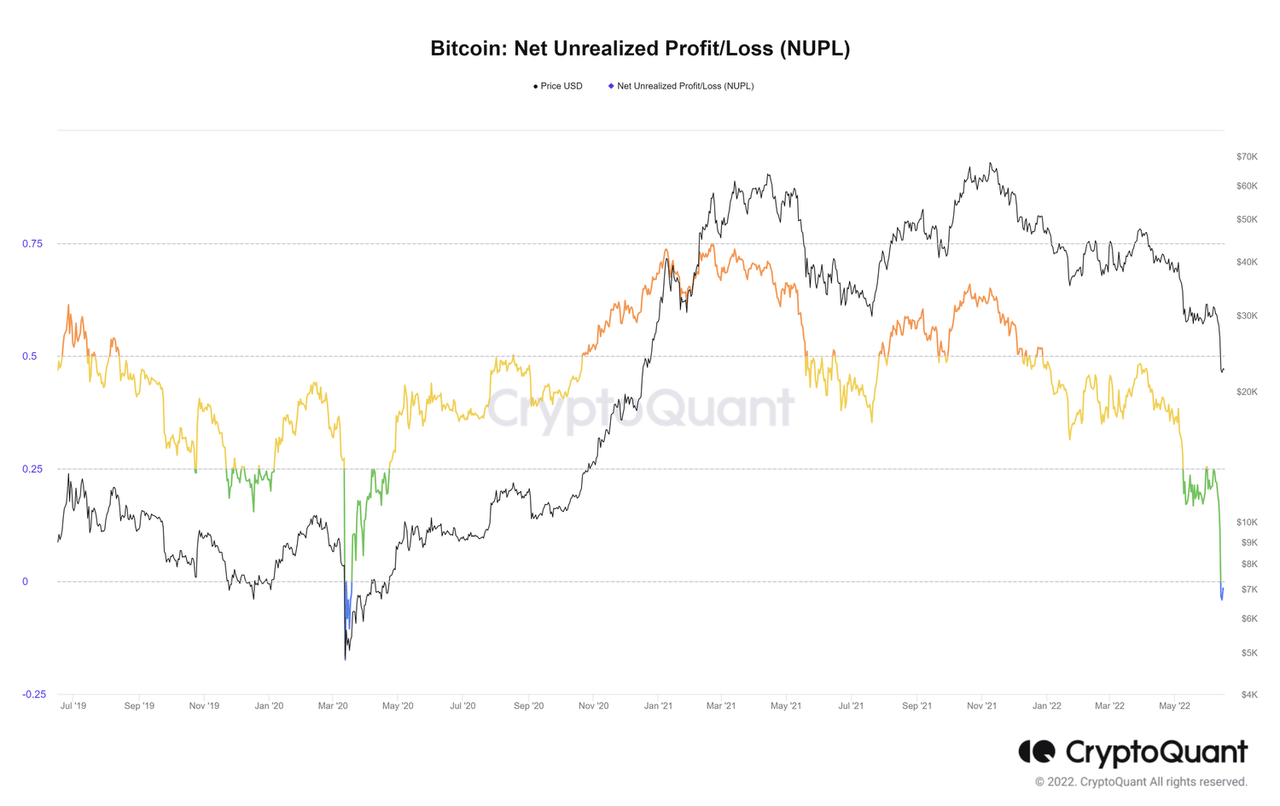
Another popular measure of profitability is the Market Value to Realised Value (MVRV) ratio, which again serves as a proxy for the average profit or loss position of investors. The MVRV ratio is too nearing levels not seen since the March 2020 lows. Again, as noted here by Glassnode, it is important to remember that past cycles have seen such measures remain at “undervalued” levels for many months. Just because such indicators have reached a perceived “undervalued” level does not mean they cannot go lower.
Author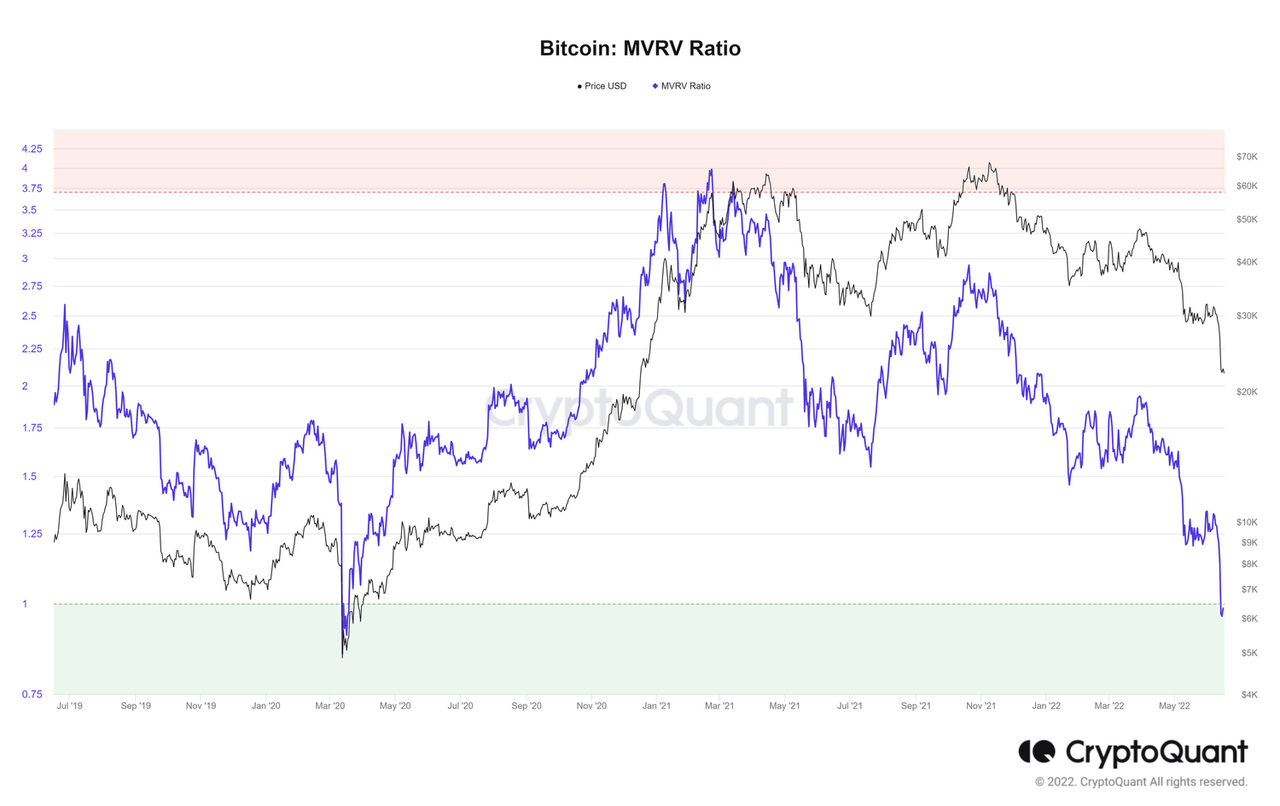
In terms of network activity, what is encouraging for the long-term viability of Bitcoin and crypto as a functional asset class is how we continue to see the number of total network addresses rise even as the price is in freefall. I do view this a favarouable fundamental outcome for the long term.
Author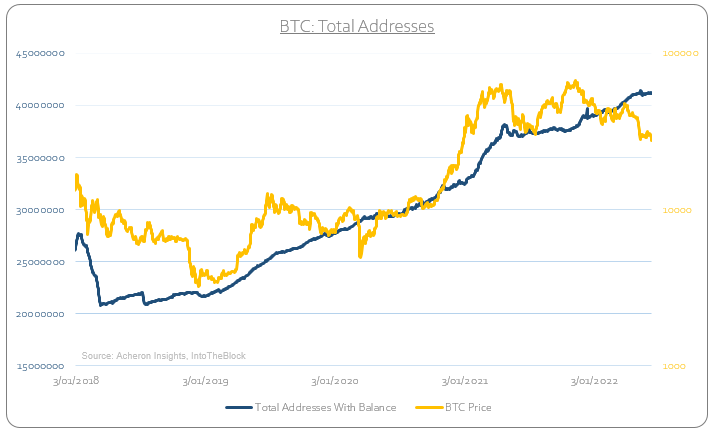
However, one of my favourite indicators I use as a proxy for retail participation within the crypto space in Active Addresses continues to trend sideways. I view this metric as close to an on-chain macro indicator as there is. Whilst Total Addresses provides insight into the overall network adoption, Active Addresses provides insight into retail participation (which is largely a function of the macro environment). I will be looking for Active Address to begin to make higher highs as a confirmation of when the bear market may be nearing an end.
Author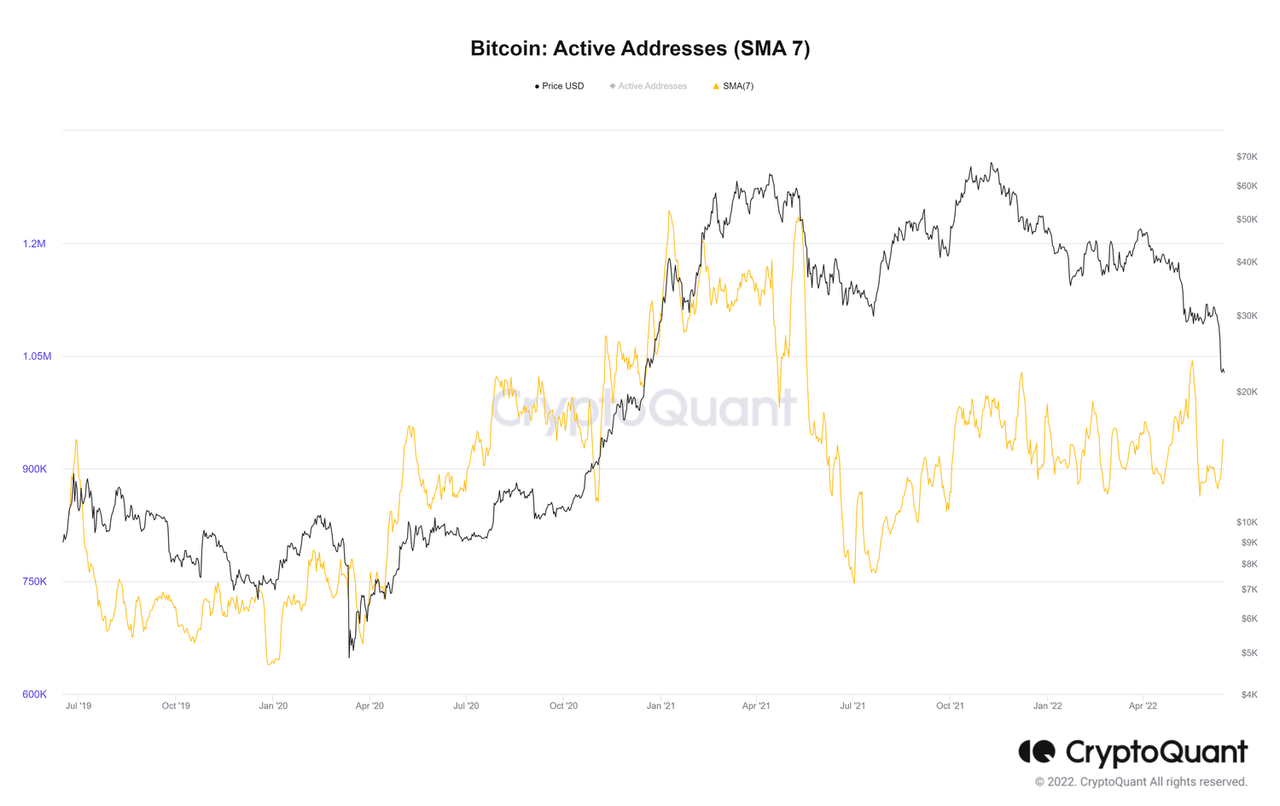
Looking now at the buying and selling activity of long-term holders (those who have historically acted as the smart money within the crypto space, by buying at the lows and selling at the tops), favourable long-term developments continue to play out. Indeed, as we can see below, long-term holders, or hodlers (categorised by those who have held BTC for over a year), continue to accumulate and increase their overall positions as prices fall. This is akin to what we saw during the 2018 and 2019 periods of price depreciation.
Author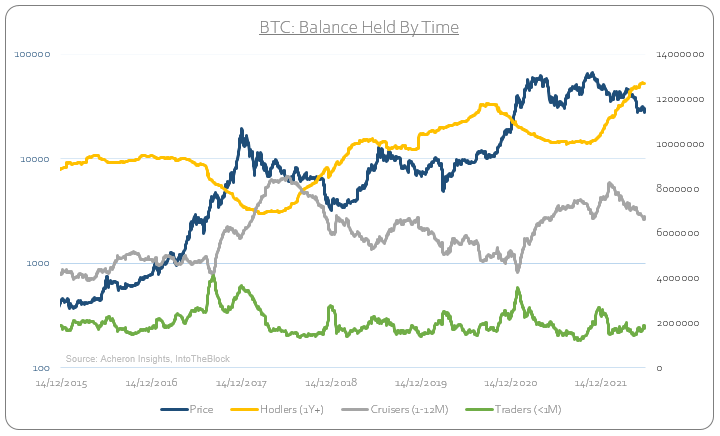
And finally, another healthy measure for the long-term viability of the crypto space is the Bitcoin Hashrate. Despite the ~70% drawdown in Bitcoin over recent months, BTC’s hashrate (which can be considered as a proxy for the security of the Bitcoin network) continues to remain strong despite weakness in price, again confirming the long-term network adoption in a similar manner to Total Addresses.
Author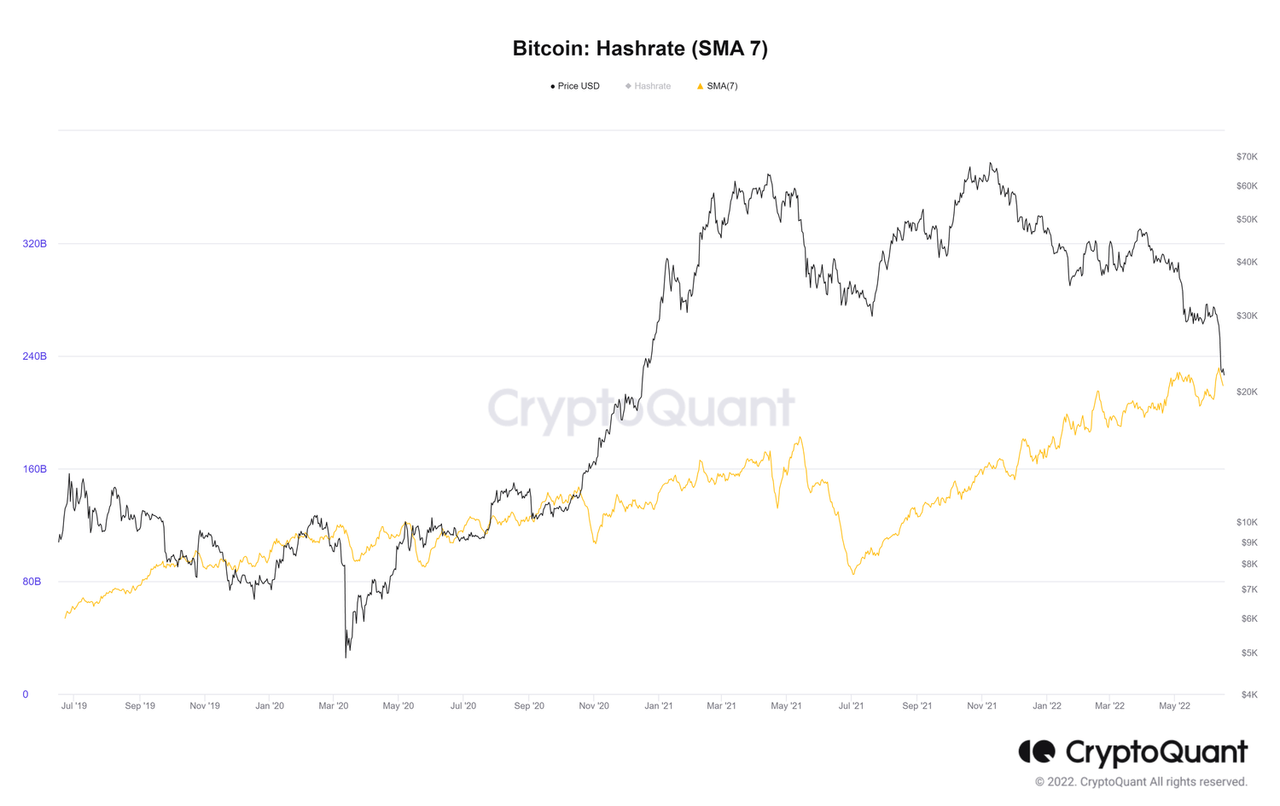
Indeed, though we are seeing the making of some favourable readings in many on-chain, derivatives, technical and sentiment indicators, the macro and liquidity environment moving forward remains a significant headwind for crypto assets. Rather than signaling at the bottom, many of these metrics are perhaps confirming we are indeed in a bear market. As such, investors should act accordingly; deploy capital in a conservative manner within a long-term time frame, and understand that there may be significant downside ahead. Likewise, any rallies from here will likely be sold as they will simply not be supported by the macro environment.
Do not try and time the bottom. The time to be overweight high-beta risk assets will come when the growth and liquidity cycles are a tailwind, not a headwind. Patience is key.
Be the first to comment