


imaginima
The highest Quant rated stock on Seeking Alpha today is Crescent Point Energy (CPG) with a rating of 4.99 out of a possible 5.00. I’m still old enough to remember one of the best pieces of advice from former President Reagan: Trust but Verify. I like to consider all possibilities: Quant, Technical and Fundamental Analysis as each has their pluses and minuses and time frames.
Right now, this stock has a short term Barchart Trend Spotter rating of 8% sell, trending more to the sell side and trading below its 50-day moving average:
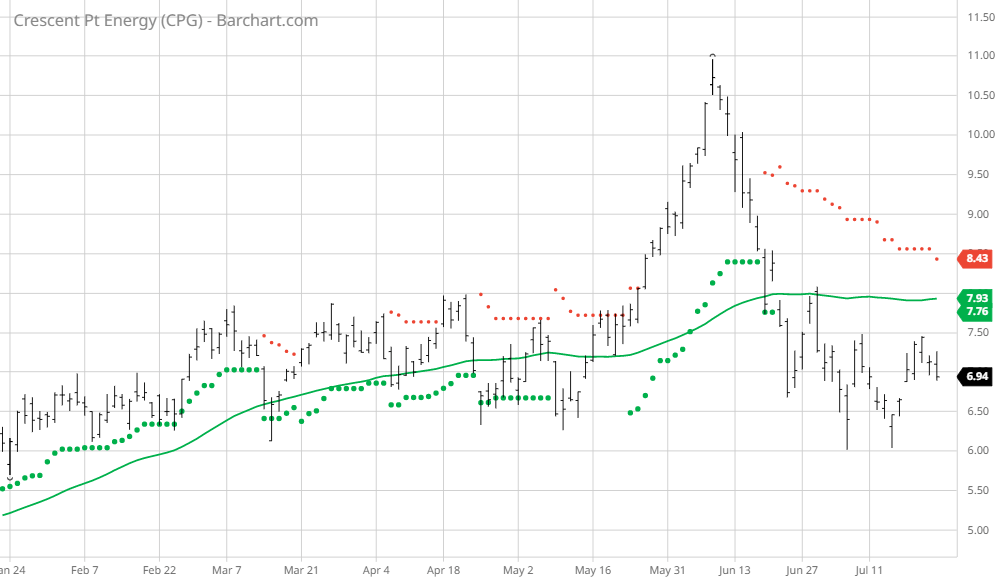
CPG Trend Spotter
You can see that since the Trend Spotter signaled a sell on 6/22 the stock has dropped 8.56%. Another way to look at this price movement is the current compared to its 20, 50-, 100- and 200-day moving averages:
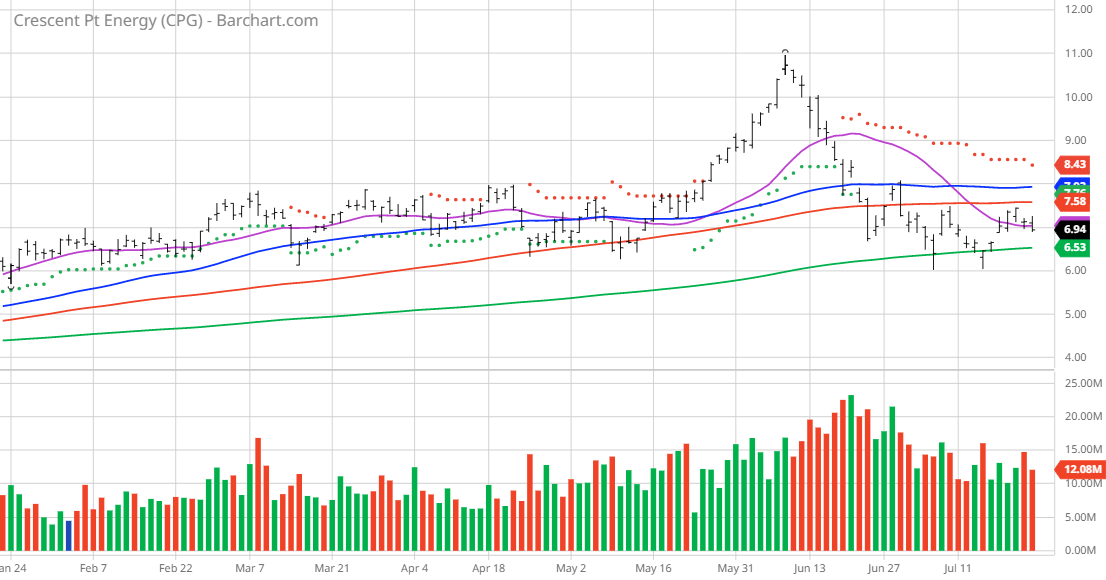
CPG vs Daily Moving Averages
Crescent Point Energy Corp. explores, develops, and produces light and medium crude oil, natural gas liquids, and natural gas reserves in Western Canada and the United States. It’s crude oil and natural gas properties, and related assets are located in the provinces of Saskatchewan, Alberta, British Columbia, and Manitoba; and the states of North Dakota and Montana. The company was incorporated in 1994 and is headquartered in Calgary, Canada. 4
Barchart’s Opinion Trading systems are listed below. Please note that the Barchart Opinion indicators are updated live during the session every 20 minutes and can therefore change during the day as the market fluctuates. The indicator numbers shown below therefore may not match what you see live on the Barchart.com website when you read this report.
Barchart Technical Indicators:
- 8% technical sell signals and increasing
- 90.00+ Weighted Alpha
- 105.33% gain in the last year
- Trend Spotter sell signal
- Above only its 200 day moving average
- 3 new highs and down 8.56% in the last month
- Relative Strength Index 44.82%
- Technical support level at 6.80
- Recently traded at 6.94 with 50 day moving average of 7.93
Fundamental factors:
- Market Cap $3.77 billion
- P/E 7.34
- Dividend yield 2.88%
- Revenue expected to grow 80.40% this year and be down 8.40% next year
- Earnings estimated to decrease 7.80% this year and an additional decrease of 39.00% next year but an overall compounded gain of 117.20% over the next 5 years
Analysts and Investor Sentiment — I don’t buy stocks because everyone else is buying but I do realize that if major firms and investors are dumping a stock it’s hard to make money swimming against the tide:
- Wall Street analysts have 5 strong buy, 6 buy and 2 hold opinions on the stock
- Analysts CFRA’s Market Scope give an average price target over 10.00
- The individual investors following the stock on Motley Fool have voted 73 to 4 that the stock will beat the market with the more experienced investors voting 10 to 1 for the same result
- 21,490 investors are following the stock on Seeking Alpha
Ratings Summary
Factor Grades
Quant Ranking
Sector
Industry
Oil and Gas Exploration and Production
Ranked Overall
Ranked in Sector
Ranked in Industry
Quant ratings beat the market »
Dividend Grades
My Conclusion: This has been a great stock pick in the past but is very highly dependent on the price of oil. Both oil prices and the price of this stock have recently hit a price resistance point at about 7.17. In my opinion both the Quant rating and the Fundamental price target of 10.00 might be a little behind the curve. If you have it hold it but put in a tight stop loss. If you are thinking about buying closely monitor the price vs its 20-day moving average before making a decision. The 20- and 50-day moving averages should guide your decision from here – Trust but Verify!
Be the first to comment