

Oselote
Mining Industry Renaissance
We are at a key inflection point for the precious metals industry today. The overwhelming social pressure to adopt the green revolution, renewable energy technologies, and electrification has forced the gold mining industry to shift its capital and attention to so-called “critical” metals. Consequently, there has been a declining interest from major mining companies in deploying capital to gold-focused projects. Perversely, this repositioning is a major tailwind for a new precious metals bull market.
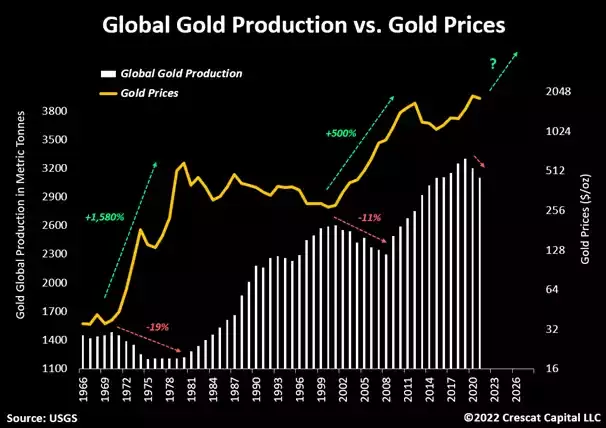
Since the end of the Bretton Woods system in 1971, there have been two major gold bull markets, a raging one in the 1970s and another substantial one in the early 2000s. Among the multiple idiosyncrasies causing the metal price to rise in each of them, one key macro driver precipitated the move higher in both, a multi-year decline in gold production worldwide. These contractions had a significant impact on fueling the strength and length of prior gold cycles. Today, we see the same macro development unfolding.
Global gold production has been falling since 2019 and is likely in the early stages of a new secular downtrend. Meanwhile, a collection of macro indicators continues to build up supporting a rising long-term demand environment for the metal. Given its pristine track record as the most durable monetary asset on the planet, gold is once again proving to be the cure for investors’ overvalued 60/40 stock and bond portfolios which have significant further downside risk under rising long-term structural interest rates and inflation. At the same time, the scarce metal is supplanting US Treasuries as the preferred allocation among global central banks looking to improve the quality of their international reserves.
Endemic Production Decline
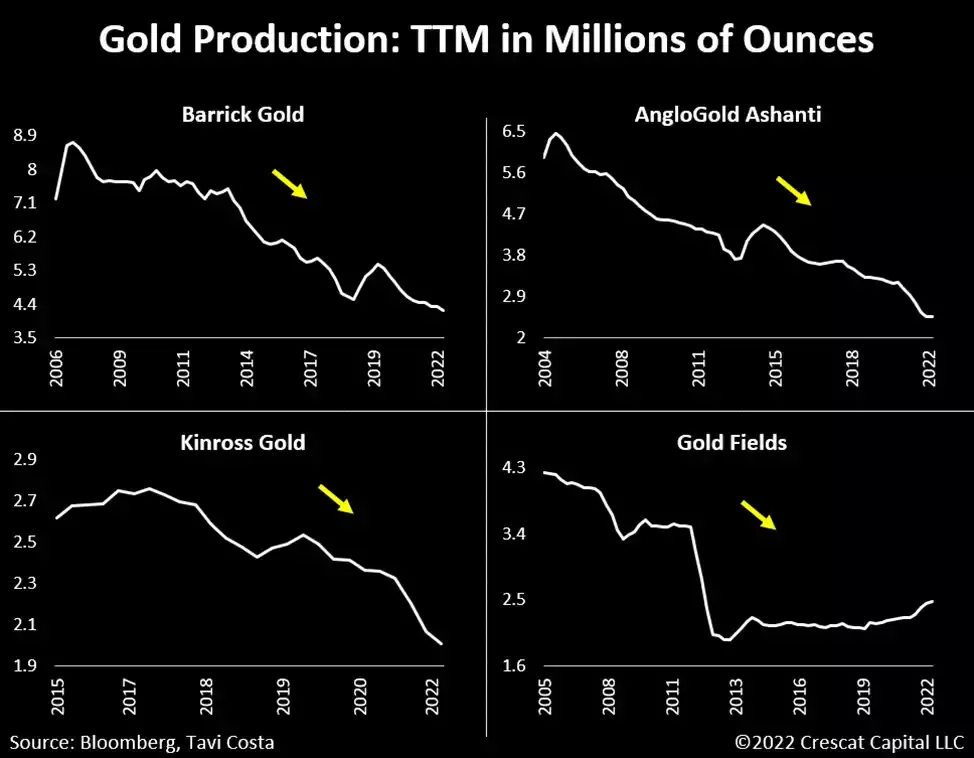
Miners that have traditionally focused on precious metals have been redirecting their capital to battery metals and other mineral resources that comply with the green agenda. As shown in the chart below, many traditionally gold-focused miners have significantly shrunk their production while increasing investment in other metals. But even the majors that remain steadfast in their commitment to gold have not significantly increased output. Newmont (NEM), for example, the largest global gold miner, is merely producing the same amount of gold it did 16 years ago while its reserves are down 24% from their peak in 2011.
These supply constraints magnify the bullish long-term investment case for precious metals. It is important to highlight that during prior periods of similar significant decline in total global production of gold, like that which began in 2020, related mining stocks performed exceptionally well for the next decade.
To use a more current example, we have seen a similar setup in the oil industry start to play out. Oil and gas stocks became “uninvestable” for many institutional investors having to follow certain ESG mandates over the last decade, but after a cathartic purge during the initial Covid crisis, the overall sector has returned back-to-back years of market-leading performance. Ironically, the aggressive push for new wind and solar “renewable” energy production has created a voracious demand for hydrocarbons that have rendered them anything but extinct.
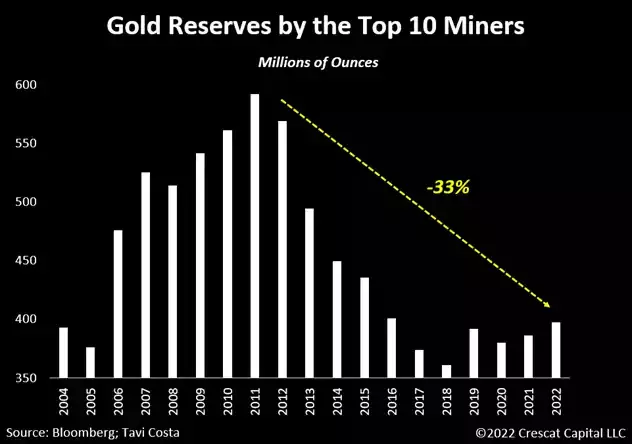
Gold Reserves Being Depleted
Although we have seen some outstanding new gold discoveries in the last 1-2 years, the aggregate number of ounces being added to global reserves has been peripheral compared to prior decades.
It is becoming increasingly challenging to find precious metals. As a result, the reserves of the top 10 mining companies are down 33% over the last 15 years. We have not seen a new precious metals project become a significant producing mine in a very long time.
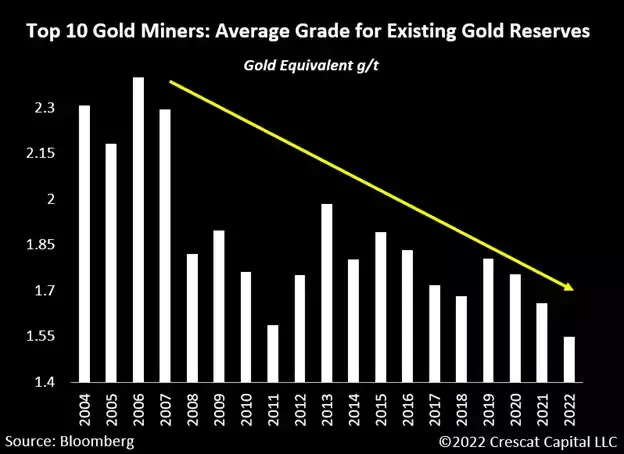
Deteriorating Quality of Assets
The aftermath of the 1970s gold cycle unleashed one of the most significant exploration periods that we have seen in the history of the mining industry. Over half a billion ounces of gold were found from early the 1980s to the late 1990s.
In contrast, today, not only do mining companies continue to deplete their existing reserves, but the quality of their remaining assets is drastically deteriorating. The average grade for gold reserves by the top 10 miners in the world has been in a secular decline.
A Profusion of Macro and Fundamental Drivers
With arguably the most conservative management teams in the history of gold and silver companies, there is no shortage of fundamental and macro reasons to deploy capital in this industry:
- Companies generating near-historic levels of cash flow
- Miners buying back stocks near-record levels at historically cheap valuations
- Highest dividend yields in history
- Major balance sheet improvements after a long deleveraging period
- Highest cash levels in decades
- CAPEX cycle at depressed levels after a long downtrend signaling a market bottom
- An early-stage M&A cycle developing
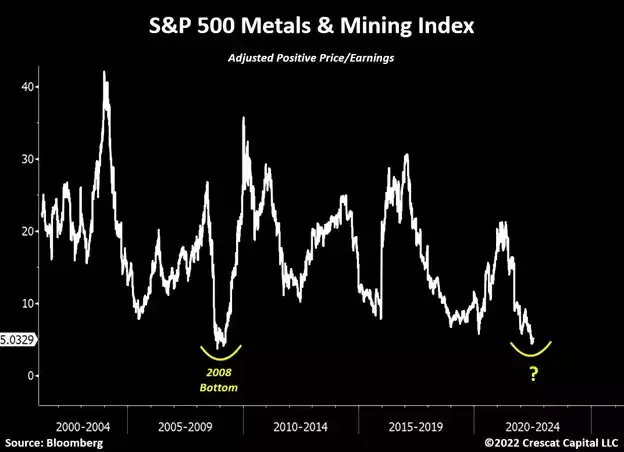
- Lowest P/E ratio for the metals and mining industry since 2008
- Gold supply is likely to remain suppressed as we enter a secular declining trend for production
- Lack of new high-grade precious metals discoveries
- No new gold or silver projects are expected to become large producing assets for years
- The mining industry as a percentage weight in the S&P 500 Index near all-time lows
- Overly bearish sentiment for precious metals while the crypto industry implodes
- Gold-to-silver ratio starting to decline from extreme historic levels
- The growth-to-value transition likely to favor highly profitable, low valuation, and counter-cyclical growth businesses such as gold and silver miners today
- Over 70% of the US Treasury curve inverted, giving a strong signal to buy gold and sell S&P 500 indexing strategies
- Rising labor costs, natural resource shortages, reckless deficit spending, de-globalization, and ultimately further debt monetization will likely fuel an inflationary decade that favors investments in tangible assets
- Investors increasingly considering gold as the quintessential offensive asset to counterbalance their falling traditional 60/40 stock and bond portfolio
- Most portfolios remain severely under allocated toward metals, especially gold
- Central banks being forced to buy gold to improve the quality of their international reserves
- Precious metals’ prices relative to money supply is near all-time lows
The ultimate supporting thesis to invest in the mining industry boils down to what we call the “Trifecta of Macro Imbalances”: excessive debt-to-GDP levels, highly elevated inflation rates, and financial assets at near record valuations. These economic issues necessitate a financially repressed environment where the cost of capital must remain lower than inflation, even in a structurally higher interest rate environment. As a result, in our strong view, all roads eventually lead to gold.
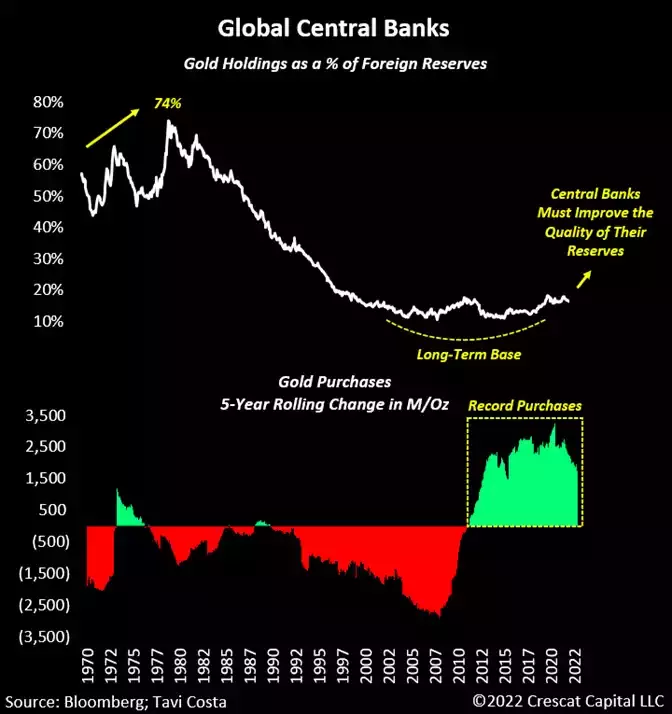
‘Gold is Money, Everything Else is Credit’
The chart below illustrates one of the most important new secular theses in global macro today. Central banks have been anything but shy in accumulating gold recently. After forming a 20-year base, we are seeing the early signs of an upward move in gold holdings as a component of foreign reserves in relation to US Treasuries, German Bunds, UK Gilts, and JGBs.
Unsustainable debt-to-GDP imbalances worldwide, portend ongoing devaluation pressure on fiat currencies. Sovereign debt is becoming less and less attractive while gold’s appeal as a monetary metal is rising. Central banks must consider the composition of their FX reserves in supporting the stability of their respective monetary systems. This is setting the stage for gold to reemerge as a key asset in improving the credibility of central banks’ balance sheets. Rising geopolitical tensions only add to this thesis with gold being the perfect neutral alternative.
A Comprehensive Analysis of the Precious Metals Industry
Tracking the fundamental changes in the mining industry is one of the most reliable ways to identify what stage of the gold cycle we are in. Measuring the level of activity of M&A transactions is one example.
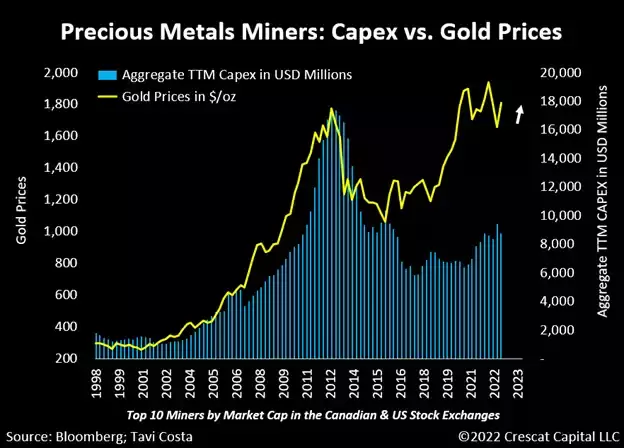
Companies normally go on a buying spree at the peak of the gold market and, conversely, they tend to do the complete opposite near market bottoms. While we have seen the start of some transactions recently, the aggregate value is nowhere close to what we saw at the late stages of the prior cycle. Nonetheless, it is important to note how miners continue to generate near-record levels of cash flows today.
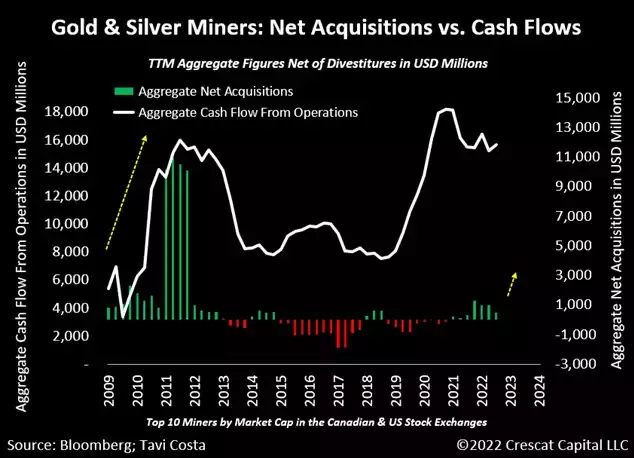
Highest Cash Levels in History
The strength of the balance sheets of mining companies is an important factor that tends to precede healthy M&A cycles. As shown in the chart below, the largest gold and silver companies have the highest cash levels that we have seen in decades.

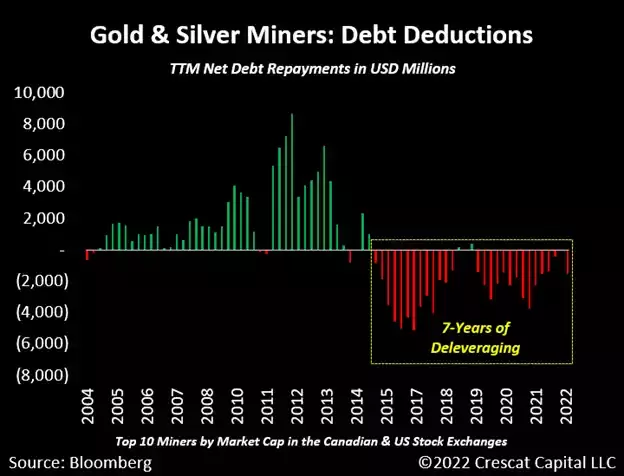
A 7-Year Deleveraging Process
Additionally, precious metals mining companies just went through a long deleveraging process. In other words, the industry had seven years of continuous debt repayment, net of new issuances. This is a very healthy development for miners overall.
Secular Decline in Capex as a Percentage of Cash Flows
In such a capital-intensive industry where resource projects can take decades to be developed, the capex cycle of these businesses can be critical in understanding the long-term supply and demand dynamics of metals. Among the top-ten gold and silver miners, the aggregate capex as a percentage of cash flows has been in a secular declining trend since the Global Financial Crisis. Even though mining companies have become more profitable over the years, they have been gradually decreasing the amount of capital that they re-invest in their businesses.
Furthermore, exploration budgets continue to be slashed as large mining companies have severely underinvested in greenfield projects. Management teams have been focused on tapping existing reserves to generate cash flow to run their businesses rather than future growth. This scenario has set the stage for a supply cliff among the majors. They have left themselves with no other choice but to acquire deposits from outside to replenish their mineral resources. Therefore, when the metals’ markets firm, the majors and mid-tiers will be tripping over each other in the M&A markets to acquire the limited new large, high-grade deposits. There aren’t that many qualified ones out there, but indeed there are at least a few dozen of them in the hands of forward-thinking small-cap exploration focused companies. These stocks can still be acquired in the market today for cheap ahead of a new gold bull market.
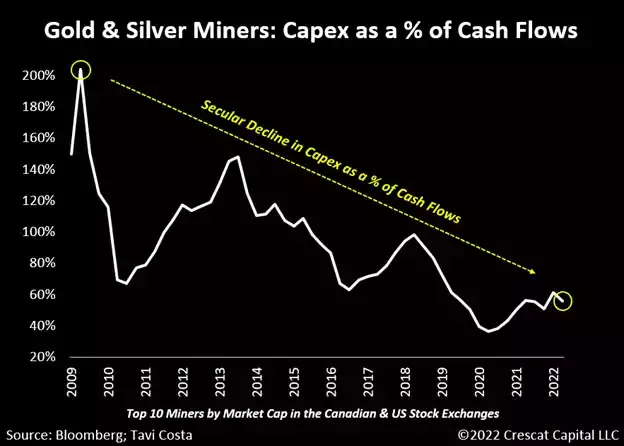
The capex cycle often follows the gold prices with a lag. Today, however, while gold is currently near its 2011 highs, aggregate capital spending for the miners remains at historically depressed levels. This goes to show again how management teams are excessively conservative despite a firming gold market.
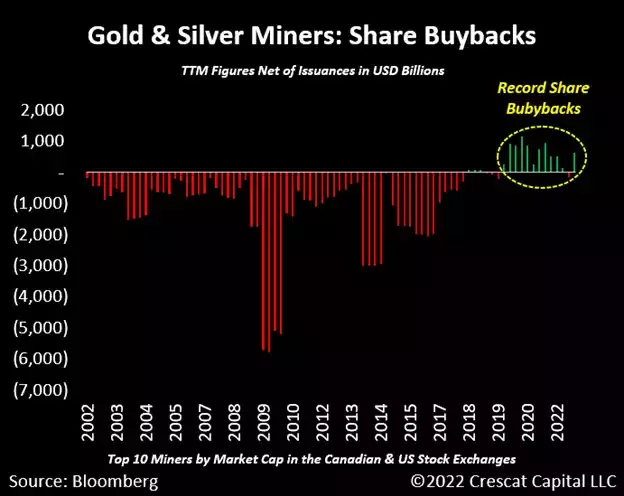
Record Share Buybacks
After two decades of continuous equity dilution, the top ten gold and silver miners have had three years of record share buybacks. These companies are going above and beyond to attract investors with accounting conservatism rather than investing for growth.
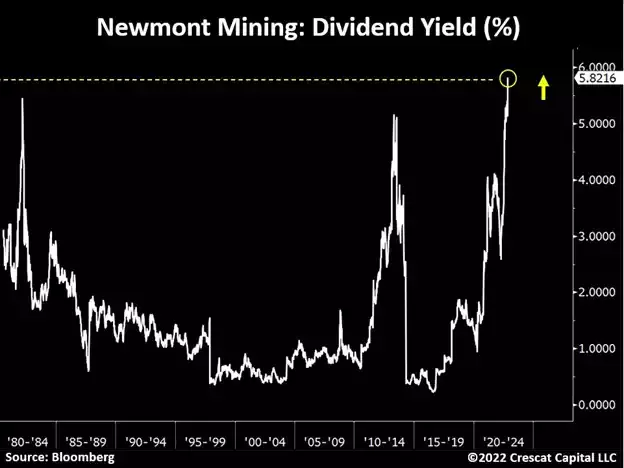
We are also seeing mining companies paying very excessive dividends recently. With a long history of data, Newmont is a great example. The company has increased its dividend in six of the last nine quarters and the stock now has the highest yield in 40 years.
Lowest P/E Ratio Since 2008
Looking at traditional fundamental metrics, major mining companies are currently at one of the most undervalued levels in history. The aggregate P/E ratio for the precious and base metals’ miners in the S&P 500 Metals Mining Index is at its lowest level since the Global Financial Crisis.
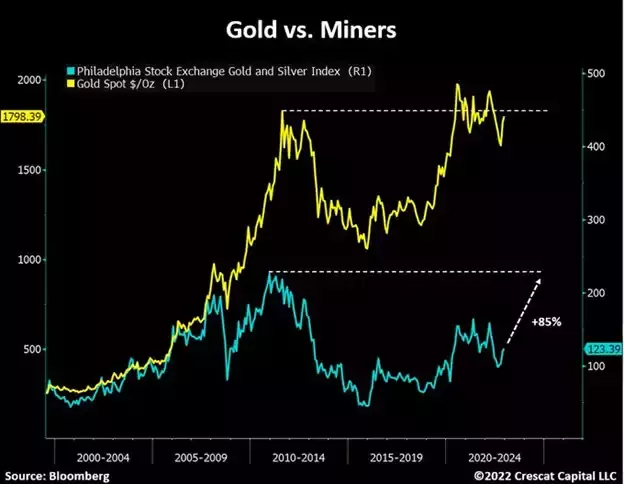
Gold at 2011 Highs, Miners Likely Next
Precious metals mining is one of the most fundamentally attractive industry groups in the market today. Interestingly, the gold price is almost back to its 2011 monthly highs. If that is the playbook for the miners, there is 85% upside from here. Let us not forget that knowing how bull markets for this industry tend to unfold, smaller companies with strong value propositions are likely to become multi-baggers in this cycle.
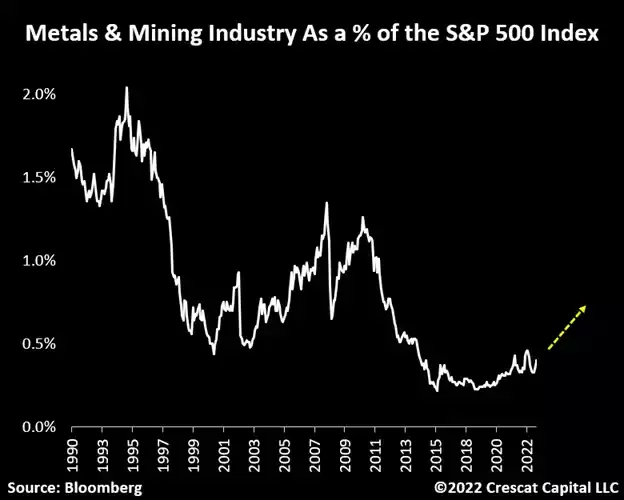
A Rounding Error
The metals and mining industry as part of the overall stock market is almost a rounding error. We believe this chart will look completely different by the end of this decade. As part of the growth-to-value transition, and as investors begin to make larger allocations toward tangible assets, the mining industry is likely to gain significant traction over the next several years.
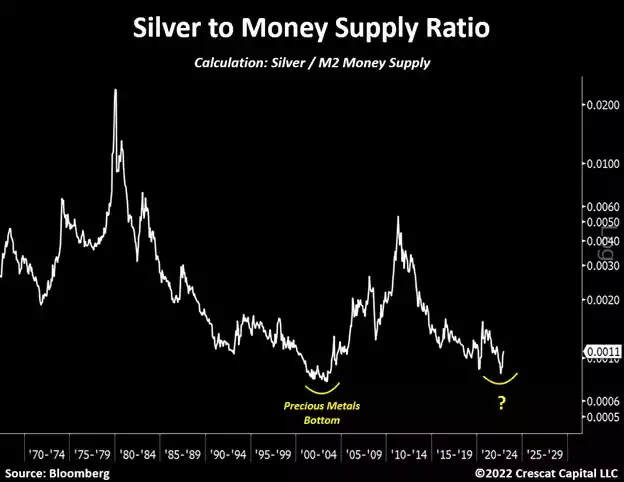
Silver: The Cheapest Metal on Earth
If we are indeed on the cusp of another long-term precious metals cycle, silver at its current price is perhaps the cheapest resource on earth. When looking at the metal relative to M2 money supply, it may have recently just reached a historic double-bottom after re-testing the early 2000s levels, which preceded a major upward move in silver prices.
Explosive Daily Moves Are Often Early Market Signals
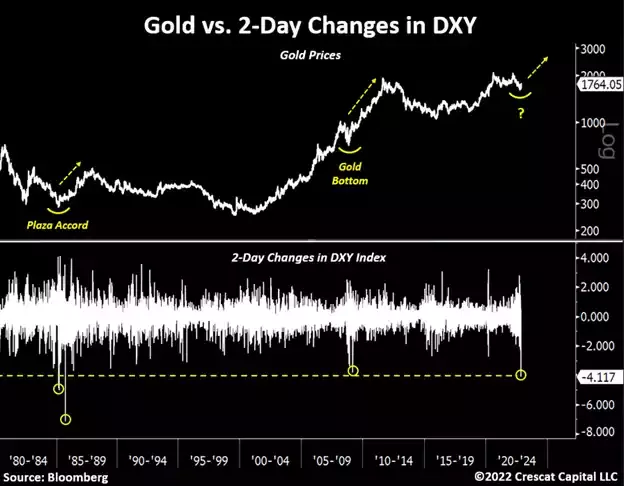
Extreme daily moves in the dollar index should also be noted as part of the bullish thesis for precious metals. We recently saw the largest 2-day drop in the DXY index since the Plaza Accord in 1985 when major central banks coordinated to depreciate the US dollar relative to other fiat currencies. After that agreement and the initial downward jolt in the dollar, gold prices nearly doubled in two years.
There was another significant decline in the DXY that occurred right at the depth of the Global Financial Crisis in 2008 which marked the bottom for precious metals. Price changes of such magnitude have coincided with major bottoms for gold. We believe that will be the case again today.
The Worst Is Probably Behind Us
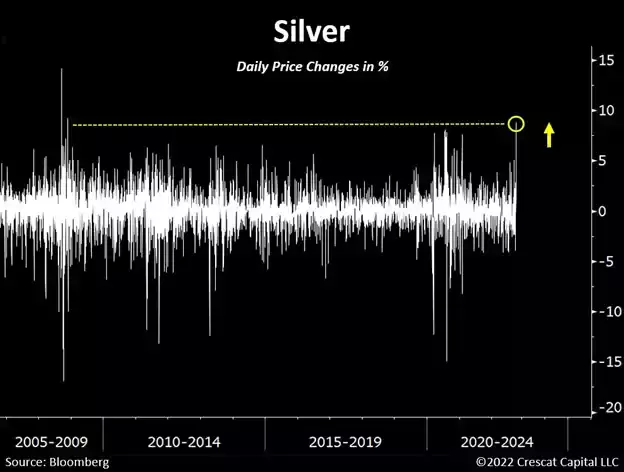
Silver is showing similar signs. In October, the metal had an explosive daily move. The last time it did that was in November 2008, which marked the end of a major correction in precious metals. Silver then proceeded to charge up 400% in just two-and-a-half years. Also, it’s important to remember that just three months ago silver was having its worst year-to-date performance in 30 years. The worst is likely behind us. We believe it is time to aggressively be long precious metals. Lastly, if we look at monthly returns, silver just had its strongest November performance in 52 years.
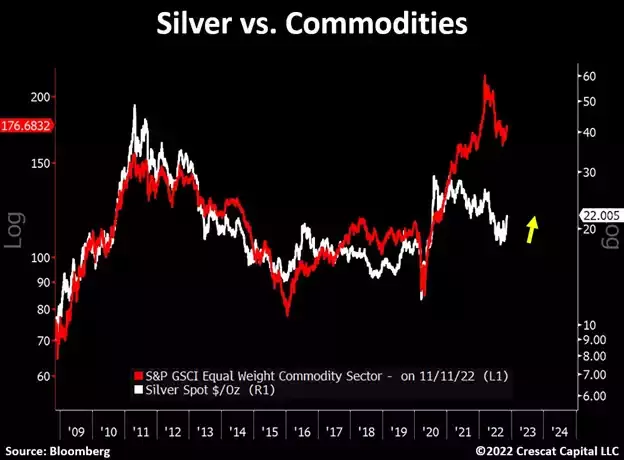
It Is Time
Silver has significantly lagged behind other commodities since 2020. We believe the metal is poised for a major catch-up. After two years of frustrating investors, silver looks ripe for an explosive and sustainable move to the upside.
Extreme Bearish Sentiment
Without calling out any names, market sentiment has been so negative toward gold that even experts in our industry are losing faith in the metal. In a recent dinner with several geologists, one of them asked:
What is the moral reason for mining gold if it is not used to function the global economy? Well, that is inaccurate to begin with.
With highly conductive properties and unmatched malleability, ductility, durability, approximately 10% of gold’s demand comes from technology, including electronics, which establishes a strong floor for its intrinsic value. The metal’s broad range of uses and incredible level of natural scarcity is the reason it is one of the most desirable resources on earth. As a result, it has been a universal monetary asset for millennia.
To be fair, today’s skepticism toward gold, particularly by younger generations, is completely logical. The last 30 years were graced with a prosperous period of cheap labor, abundant natural resources, and an exceptionally globalized macro environment. All these factors have been severely reversed today.
Decades of cheap money allowed countries to accumulate debt while generating gradually less units of economic growth. Such a lack of monetary discipline is unsustainable. We are now in the early stages of seeing the consequences of these macro imbalances: rising inequality, political polarization, geopolitical conflict, rising cost of living, shortages of natural resources, etc. Skeptics are likely to soon learn a valuable lesson as to why gold is such a critical part of the world’s monetary system.
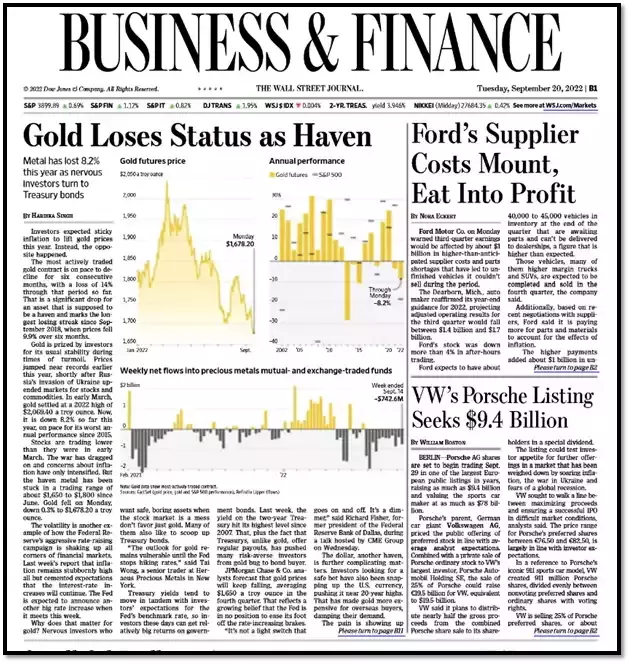
Major positive inflection points start from ultra-depressed sentiment. On that note, two months ago, the Wall Street Journal published the following print on the front page of its business section stating: “Gold Loses Status as Haven”. This article helped to spur what appears to us to have been a major cyclical capitulation bottom for gold just four days later.
Yield Curve Inversions
There is a profusion of macro indicators supporting our precious metals thesis today. However, the one measurement every investor should pay close attention to today, is the percentage of inversions in the US Treasury curve. We created this indicator in 2018 after noticing how independent yield spreads often provided very premature signals about the risk of a recession. Therefore, we built a much more comprehensive indicator that calculates the percentage of inversions across all possible yield spreads in the Treasury curve.
What we found is that every time this indicator went above the 70% handle, it coincided with a steep recession since 1970. More importantly, for portfolio positioning purposes, this indicator gives our strongest macro signal to buy gold and sell stocks.
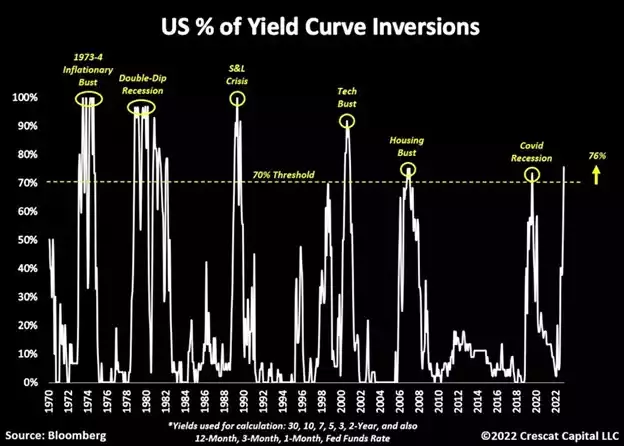
Buy Gold and Sell Stocks
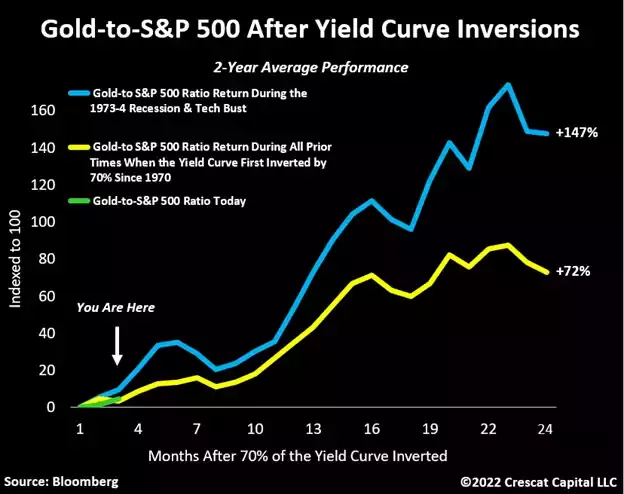
Empirically, when the percentage of yield curve inversions goes above the 70% handle, it is time to be long gold and short the S&P 500. In the 24 months after all seven prior instances of the signal, equal dollars invested on each side of this trade returned an average of 72% before dividends.
What is even more interesting is to look at how it performed in the two economic environments that are most comparable to the one we observe today. As we have discussed in prior letters, Crescat believes that the current macro climate most closely resembles the ones that preceded both the 1973-74 stagflationary recession and the early 2000s tech bust. Using these two periods as analogs, buying the traditional central bank reserve metal and selling short the most popular US equity benchmark averaged an even more impressive 147% over the next two years excluding dividends.
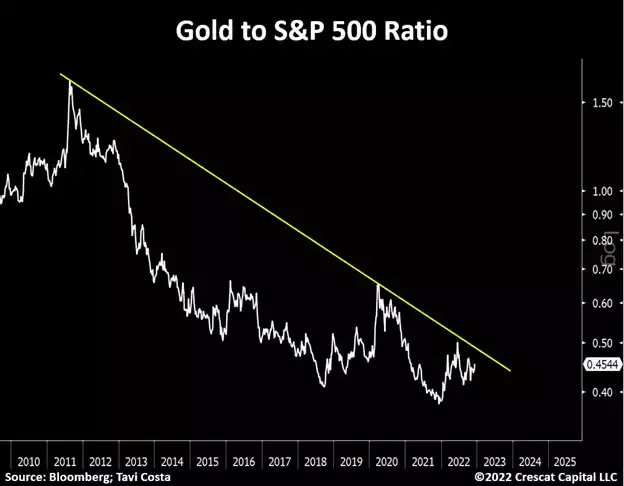
Potential Breakout
Interestingly, the recent chart of the gold-to-S&P 500 ratio looks incredibly compelling. With such a strong macro tailwind, the ratio appears ripe for a major breakout from its multi-year resistance.
Further Downside Risk for Overall Stocks
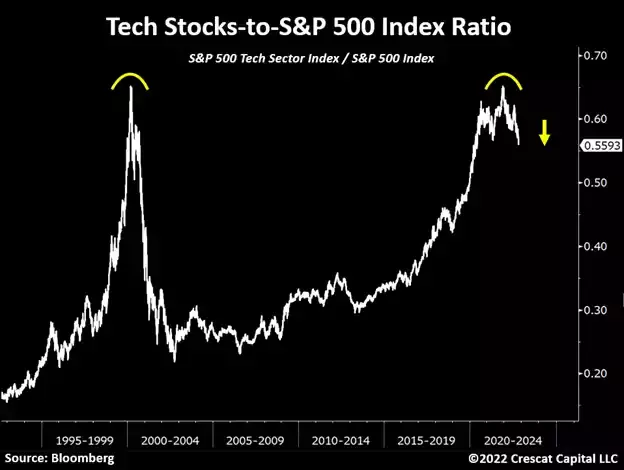
Outside of resource industries, where we are extraordinarily bullish, we continue to be bears on the broad US equity market. If the recent rally in stocks signals the bottom, it would be the most expensive bear market bottom in history. With a market cap-to-GDP ratio of 1.4, the Wilshire 5000 total US market index is still valued at the same level as the PEAK of the dotcom bubble. We believe there is significant downside risk ahead, especially for popular megacap tech stocks. While the top-ten of these by market cap collectively already crested at the beginning of this year, they are still valued at higher aggregate EV-to-GDP multiples than the comparable basket at the tech bubble top, 33x today versus 30x in March 2000. In the tech bust, the comps plunged to just 6x by October 2002. The Fed has been aggressively tightening monetary conditions to create what is likely only the early stages of an economic contraction. That poses severe further downside risk for overvalued financial assets.
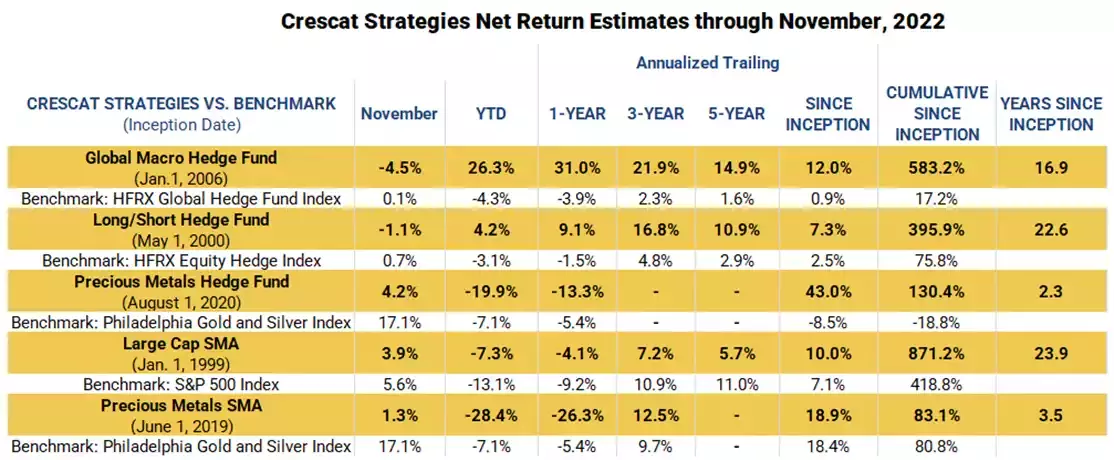
Estimated Performance through November
|
Important Disclosures Performance data represents past performance, and past performance does not guarantee future results. An individual investor’s results may vary due to the timing of capital transactions. Performance for all strategies is expressed in U.S. dollars. Cash returns are included in the total account and are not detailed separately. Investment results shown are for taxable and tax-exempt clients and include the reinvestment of dividends, interest, capital gains, and other earnings. Any possible tax liabilities incurred by the taxable accounts have not been reflected in the net performance. Performance is compared to an index, however, the volatility of an index varies greatly and investments cannot be made directly in an index. Market conditions vary from year to year and can result in a decline in market value due to material market or economic conditions. There should be no expectation that any strategy will be profitable or provide a specified return. Case studies are included for informational purposes only and are provided as a general overview of our general investment process, and not as indicative of any investment experience. There is no guarantee that the case studies discussed here are completely representative of our strategies or of the entirety of our investments, and we reserve the right to use or modify some or all of the methodologies mentioned herein. Separately Managed Account (SMA) disclosures: The Crescat Large Cap Composite and Crescat Precious Metals Composite include all accounts that are managed according to those respective strategies over which the manager has full discretion. SMA composite performance results are time-weighted net of all investment management fees and trading costs including commissions and non-recoverable withholding taxes. Investment management fees are described in Crescat’s Form ADV 2A. The manager for the Crescat Large Cap strategy invests predominantly in equities of the top 1,000 U.S. listed stocks weighted by market capitalization. The manager for the Crescat Precious Metals strategy invests predominantly in a global all-cap universe of precious metals mining stocks. Hedge Fund disclosures: Only accredited investors and qualified clients will be admitted as limited partners to a Crescat hedge fund. For natural persons, investors must meet SEC requirements including minimum annual income or net worth thresholds. Crescat’s hedge funds are being offered in reliance on an exemption from the registration requirements of the Securities Act of 1933 and are not required to comply with specific disclosure requirements that apply to registration under the Securities Act. The SEC has not passed upon the merits of or given its approval to Crescat’s hedge funds, the terms of the offering, or the accuracy or completeness of any offering materials. A registration statement has not been filed for any Crescat hedge fund with the SEC. Limited partner interests in the Crescat hedge funds are subject to legal restrictions on transfer and resale. Investors should not assume they will be able to resell their securities. Investing in securities involves risk. Investors should be able to bear the loss of their investment. Investments in Crescat’s hedge funds are not subject to the protections of the Investment Company Act of 1940. Performance data is subject to revision following each monthly reconciliation and annual audit. Current performance may be lower or higher than the performance data presented. The performance of Crescat’s hedge funds may not be directly comparable to the performance of other private or registered funds. Hedge funds may involve complex tax strategies and there may be delays in distribution tax information to investors. Investors may obtain the most current performance data, private offering memoranda for Crescat’s hedge funds, and information on Crescat’s SMA strategies, including Form ADV Part II, by contacting Linda Smith at (303) 271-9997 or by sending a request via email to lsmith@crescat.net. See the private offering memorandum for each Crescat hedge fund for complete information and risk factors. |
Editor’s Note: The summary bullets for this article were chosen by Seeking Alpha editors.
Be the first to comment