

FreezeFrames/iStock via Getty Images
Introduction
Houston-based Coterra Energy (NYSE:CTRA) released its second-quarter 2022 results on August 2, 2022.
Note: I have followed CTRA quarterly since October 2017 (Cabot oil). This new article is a quarterly update of my article published on December 28, 2021.
1 – Presentation
Cabot Oil & Gas and Cimarex Energy Co. completed the merger on October 1, 2021. it was a merger valued at $17 billion.
Coterra Energy’s Chief Executive is Thomas Jorden, formerly the CEO of Cimarex, and Scott Schroeder, previously Cabot’s chief financial officer, took the role at Coterra Energy.
Cabot is a Marcellus Shale gas operator in Appalachia, while Cimarex is a West Texas oil producer with assets in the Permian and Anadarko basins. The company produces a majority of Natural gas, representing 74% for natural gas and 12% of Natural gas liquid, leaving only a tiny part for oil.
The combination of the two companies and the more recent interest in Natural Gas has created a new power company with increasing dividends reaching a total quarterly dividend of $0.65 per share or a yield of 9.2%.
CTRA Map presentation 2Q22 (Coterra Energy)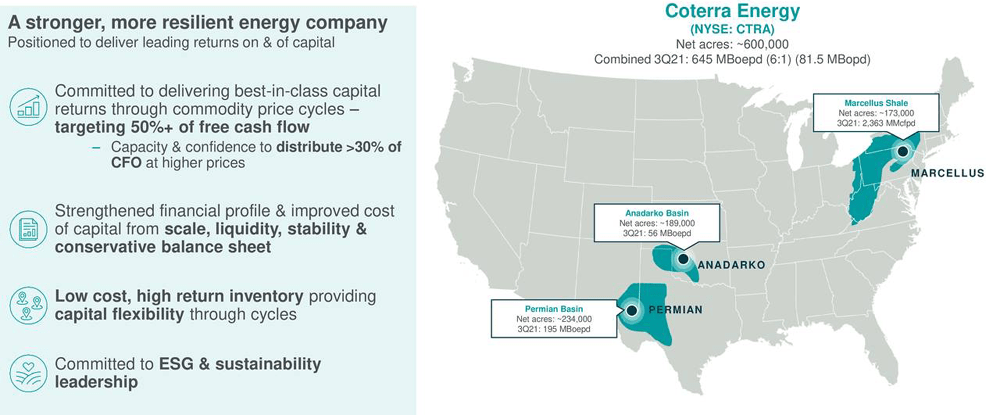
2 – Stock performance
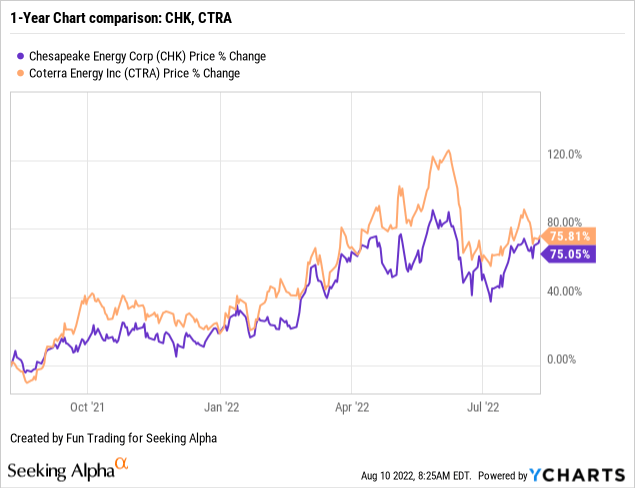
I cover Coterra Energy and Chesapeake Energy (CHK) in this segment. Both companies did exceptionally well on a one-year basis and are up 75%.
Note: I recommend reading my article on Chesapeake Energy by clicking here.
3 – Investment Thesis
The investment thesis has changed with the renewed interest in Natural Gas and the supply chain disruption triggered by the war in Ukraine. I recommend CTRA as a long-term investment due to its natural gas exposure in the USA and its generous dividend policy tight to the free cash flow.
EIA expects the natural gas and NGL prices to remain high through 2022. However, the EIA is not bullish for 2023.
We forecast that natural gas prices will fall in early 2023 because of more domestic natural gas production, less LNG export and domestic natural gas demand growth, and more natural gas placed in storage.
Thus, I recommend a long-term CTRA position combined with active short-term trading (40%) to take advantage of the sector’s volatility and slightly reduce overall risks.
Coterra Energy CEO Tom Jorden said in the conference call:
As you read from our earnings release, we had an excellent second quarter. If I were asked to write the news headline describing our release, it would be Coterra Hits Its Stride. With these quarterly results, which are our third since forming Coterra, we have affirmed our commitment to capital discipline, prudent capital allocation and returning free cash to our owners.
Coterra Energy – Balance Sheet 2Q ’22: The Raw Numbers
| COG | 2Q21 | 3Q21 | 4Q21 | 1Q22 | 2Q22 |
| Total Revenues in $ Million | 325 | 440 | 2,224 | 1,679 | 2,572 |
| Net Income in $ Million | 30 | 63 | 938 | 608 | 1,229 |
| EBITDA $ Million | 145 | 193 | 1,649 | 1,159 | 2,023 |
| EPS diluted in $/share | 0.08 | 0.16 | 1.16 | 0.74 | 1.52 |
| Cash from operations in $ Million | 179 | 245 | 952 | 1,322 | 879 |
| Capital Expenditure in $ Million | 151 | 185 | 269 | 271 | 474 |
| Free Cash Flow in $ Million | 28 | 61 | 683 | 1,051 | 405 |
| Cash and cash equivalent $ Million | 158 | 76 | 1,036 | 1,447 | 1,059 |
| Total Debt (incl. current) In $ Million | 1,046 | 947 | 3,125 | 3,115 | 3,105 |
| Dividend per share in $ per share | 0.11 | 0.30 | 0.56 | 0.60 | 0.65 ($0.15 + $0.50) |
| Share outstanding diluted in Million | 402 | 403 | 814 | 814 | 808 |
| Gas Production | 2Q21 | 3Q21 | 4Q21 | 1Q22 | 2Q22 |
| Gas Equivalent Production in K Boep/d | 367.5 | 393.8 | 686.2 | 629.9 | 631.7 |
| NG price per Mcf | 2.51 | 2.95 | 4.43 | 4.17 | 5.15 |
Source: Company filings.
Trends, Charts, and Commentary: Revenues, Free Cash Flow, and Gas Production
1 – Total Revenues were $2,572 million in 2Q ’22
CTRA Quarterly Revenues history (Fun Trading)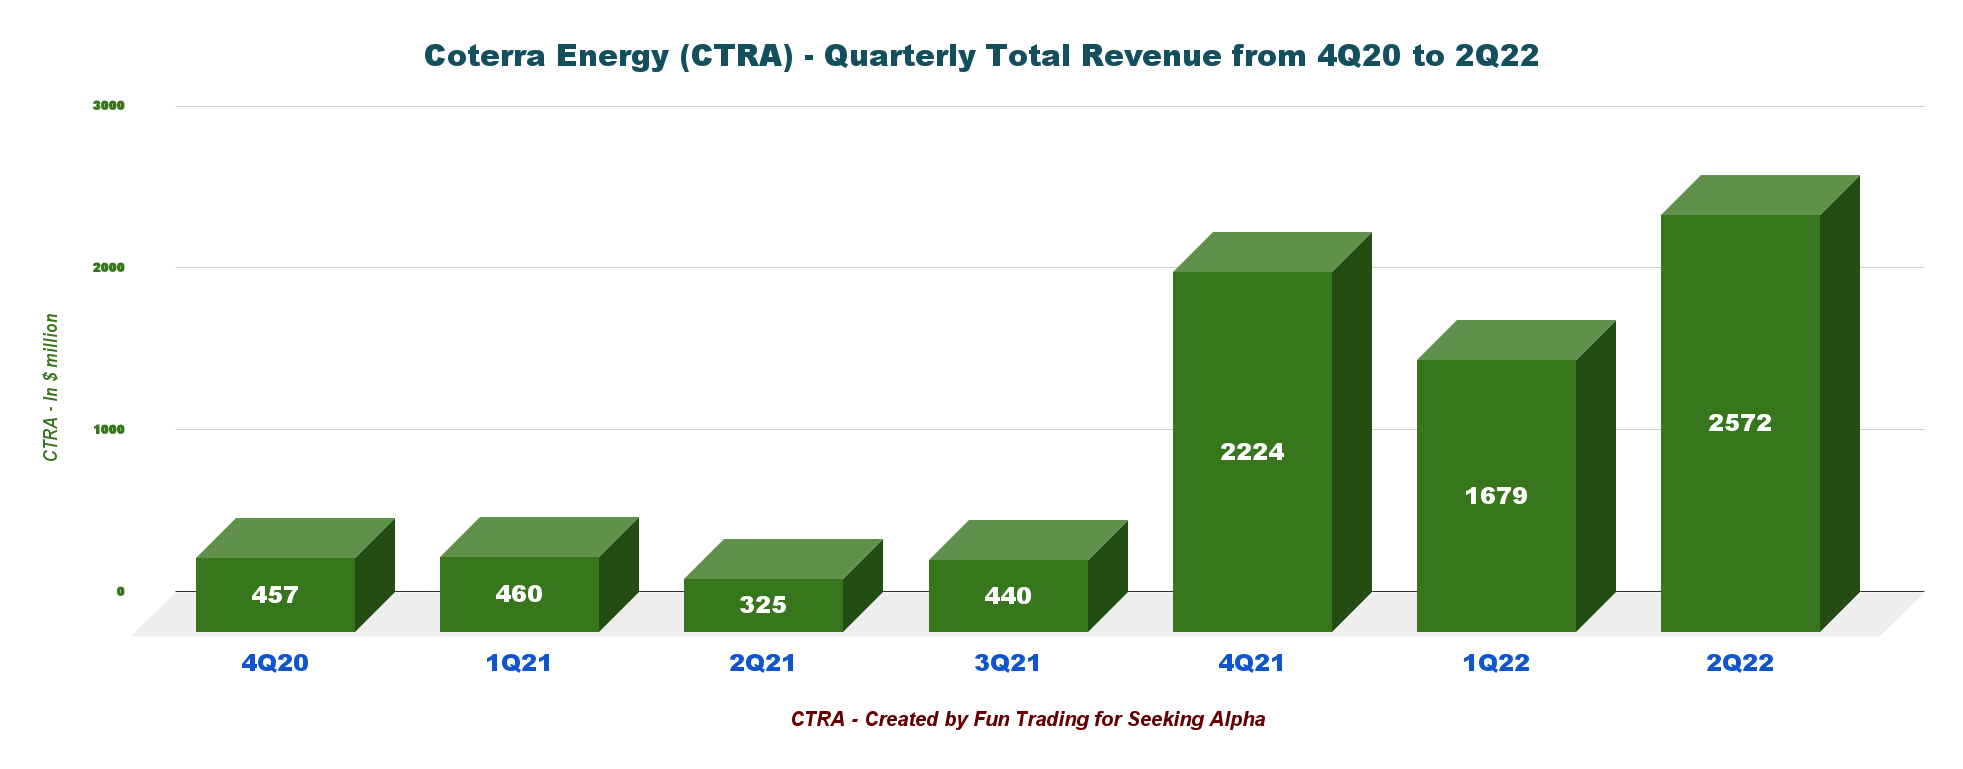
Coterra Energy recorded quarterly revenues of $2,572 million for the second quarter of 2022, up 34.7% sequentially. The comparison with the 2Q21 is not valid due to the merger.
The adjusted net income was $1,083 million in 2Q22, or $1.35 per share.
2 – Free cash flow jumped to $405 million in 2Q22
CTRA Quarterly Free cash flow history (Fun Trading)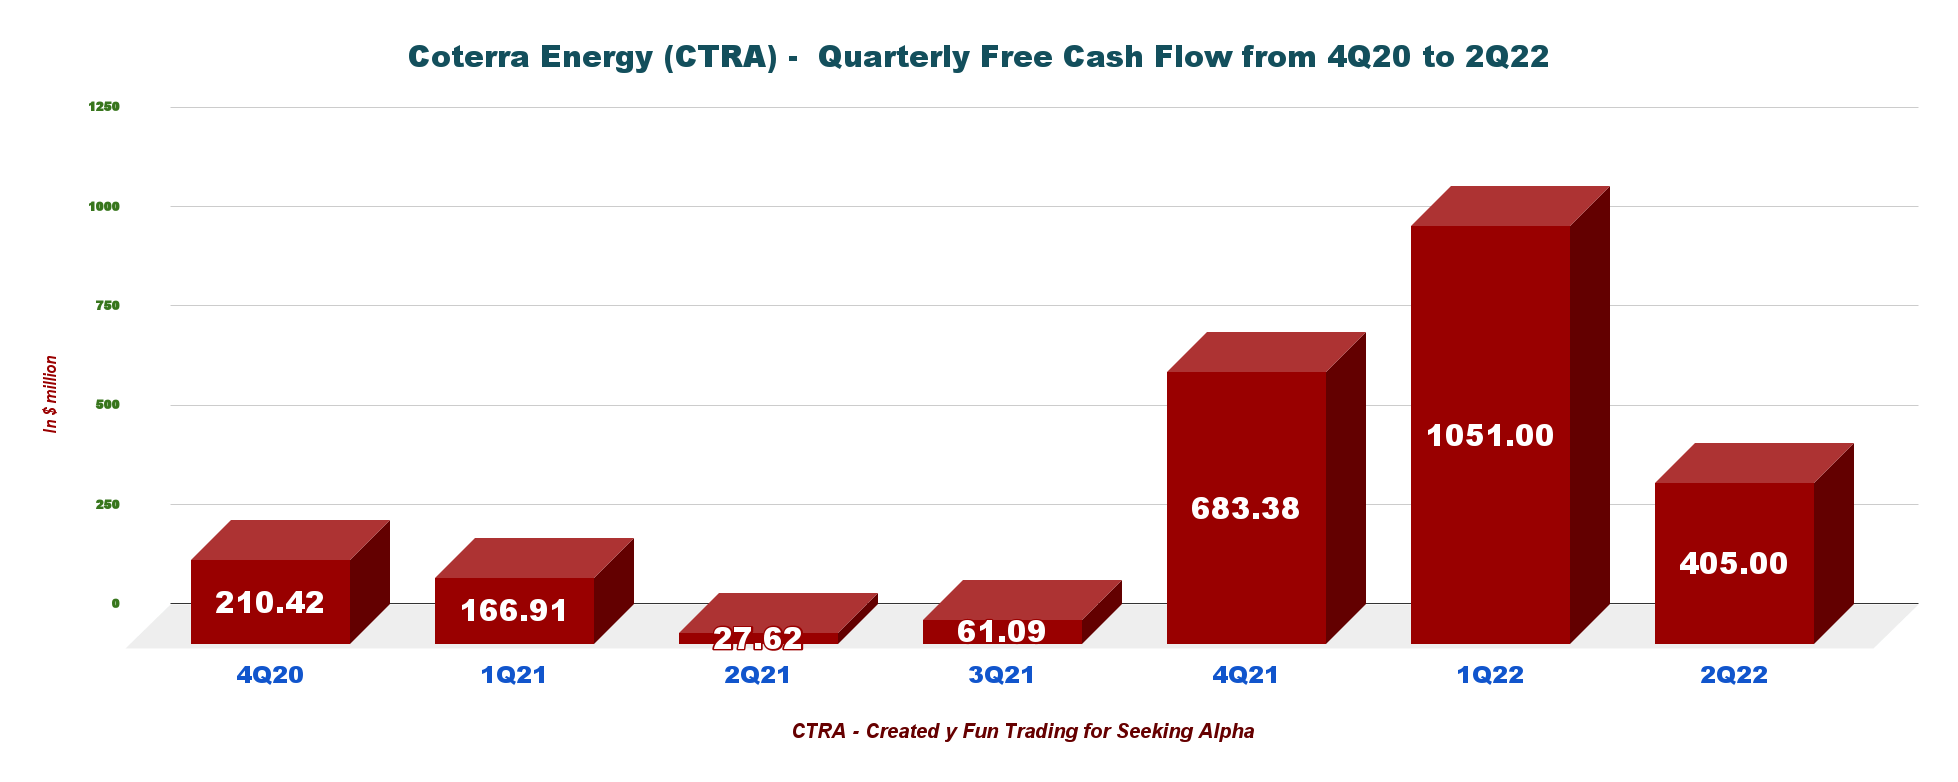
Note: The generic free cash flow is the cash from operations minus CapEx. The company has a different way of calculating the Free cash flow and indicated $1,019 million.
CTRA’s free cash flow was $405 million in 2Q22. The trailing 12-month of free cash flow TTM was $2,200 million.
On August 2, 2022, Coterra’s Board of Directors approved a total quarterly dividend equal to $0.65 per share ($0.15 base, $0.50 variable), which will be paid on August 25 2022, to holders of record on August 15, 2022.
3 – Quarterly Oil Equivalent production
Coterra Energy operates in three different basins in the USA.
CTRA Oil equivalent production per Basin 4Q21 to 2Q22 (Fun Trading)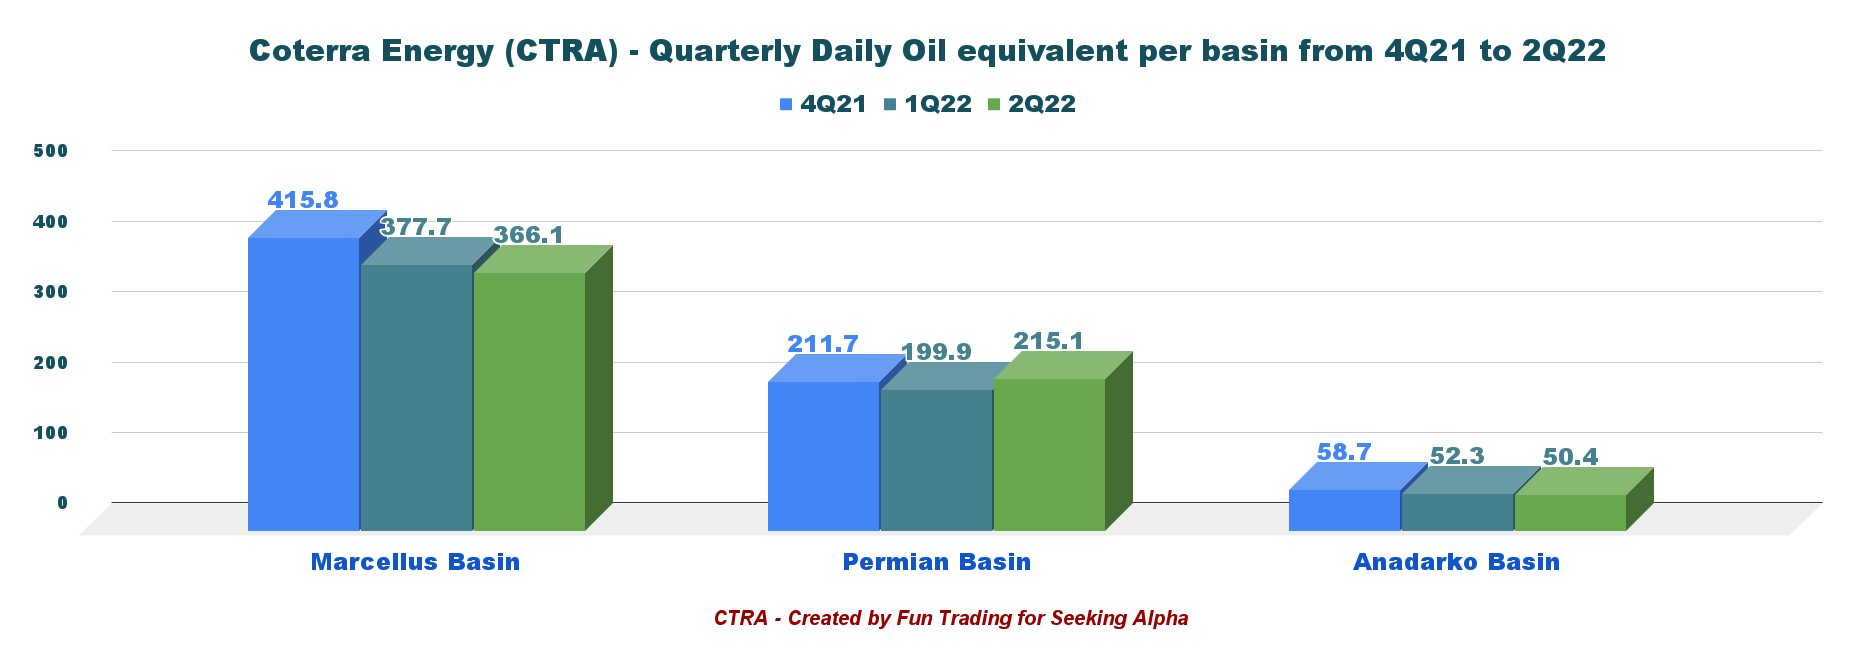
Coterra Energy produced 631.7K Boep/d in 2Q22, up from 629.9K Boep/d in 1Q22.
CTRA Quarterly Production oil equivalent history (Fun Trading)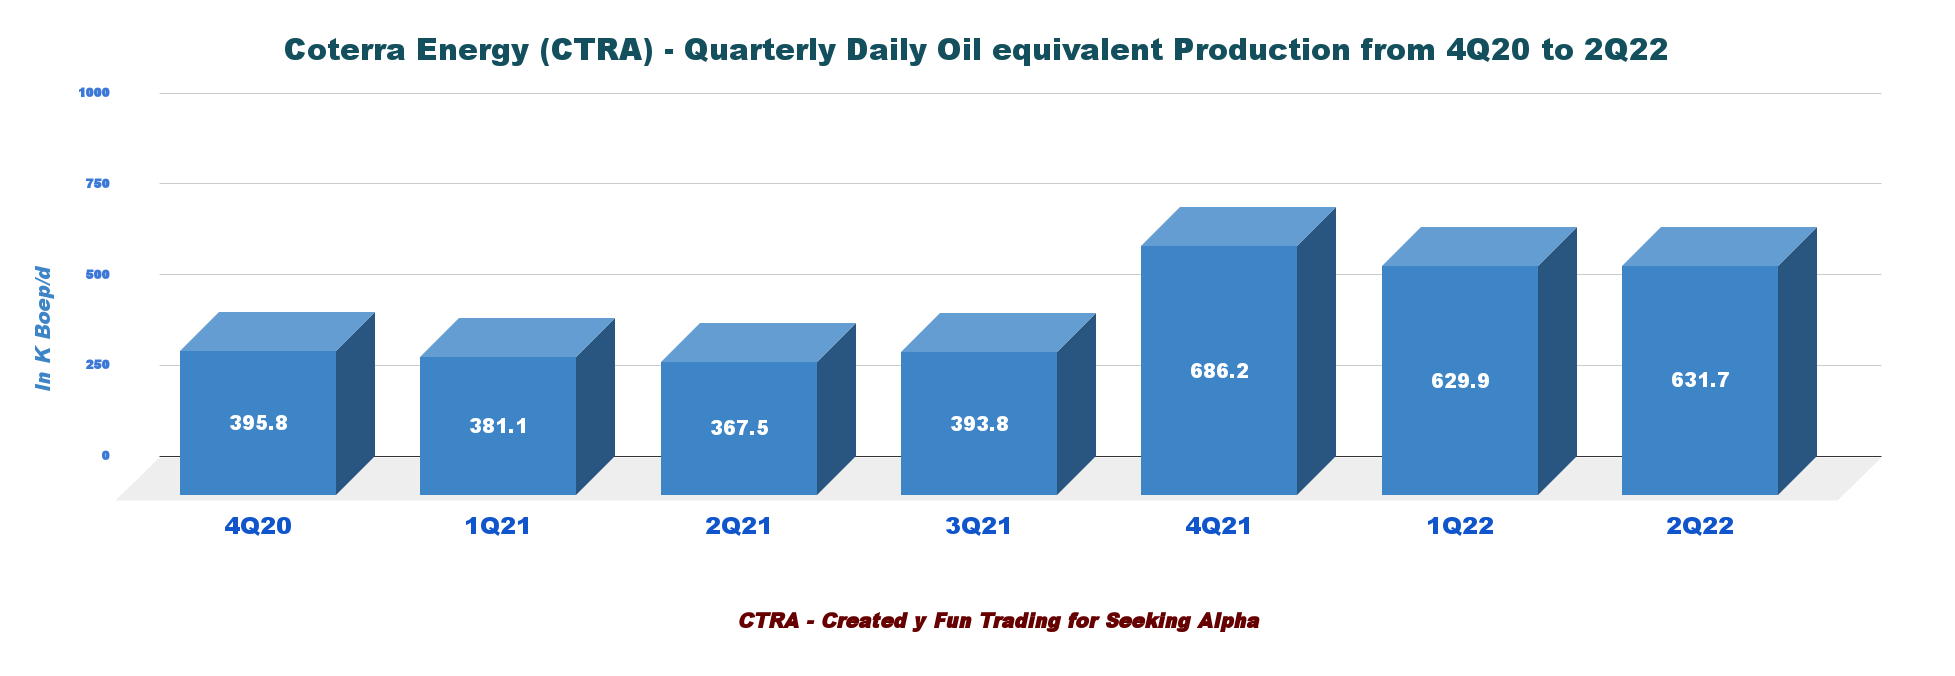
The average realized natural gas price increased to $5.78/Mcf from the year-ago quarter’s $2.95. Oil price was $109.23 per barrel, and NGL was $39.17. Massive price appreciation on all fronts.
CTRA Quarterly oil, NGL, and gas price history (Fun Trading)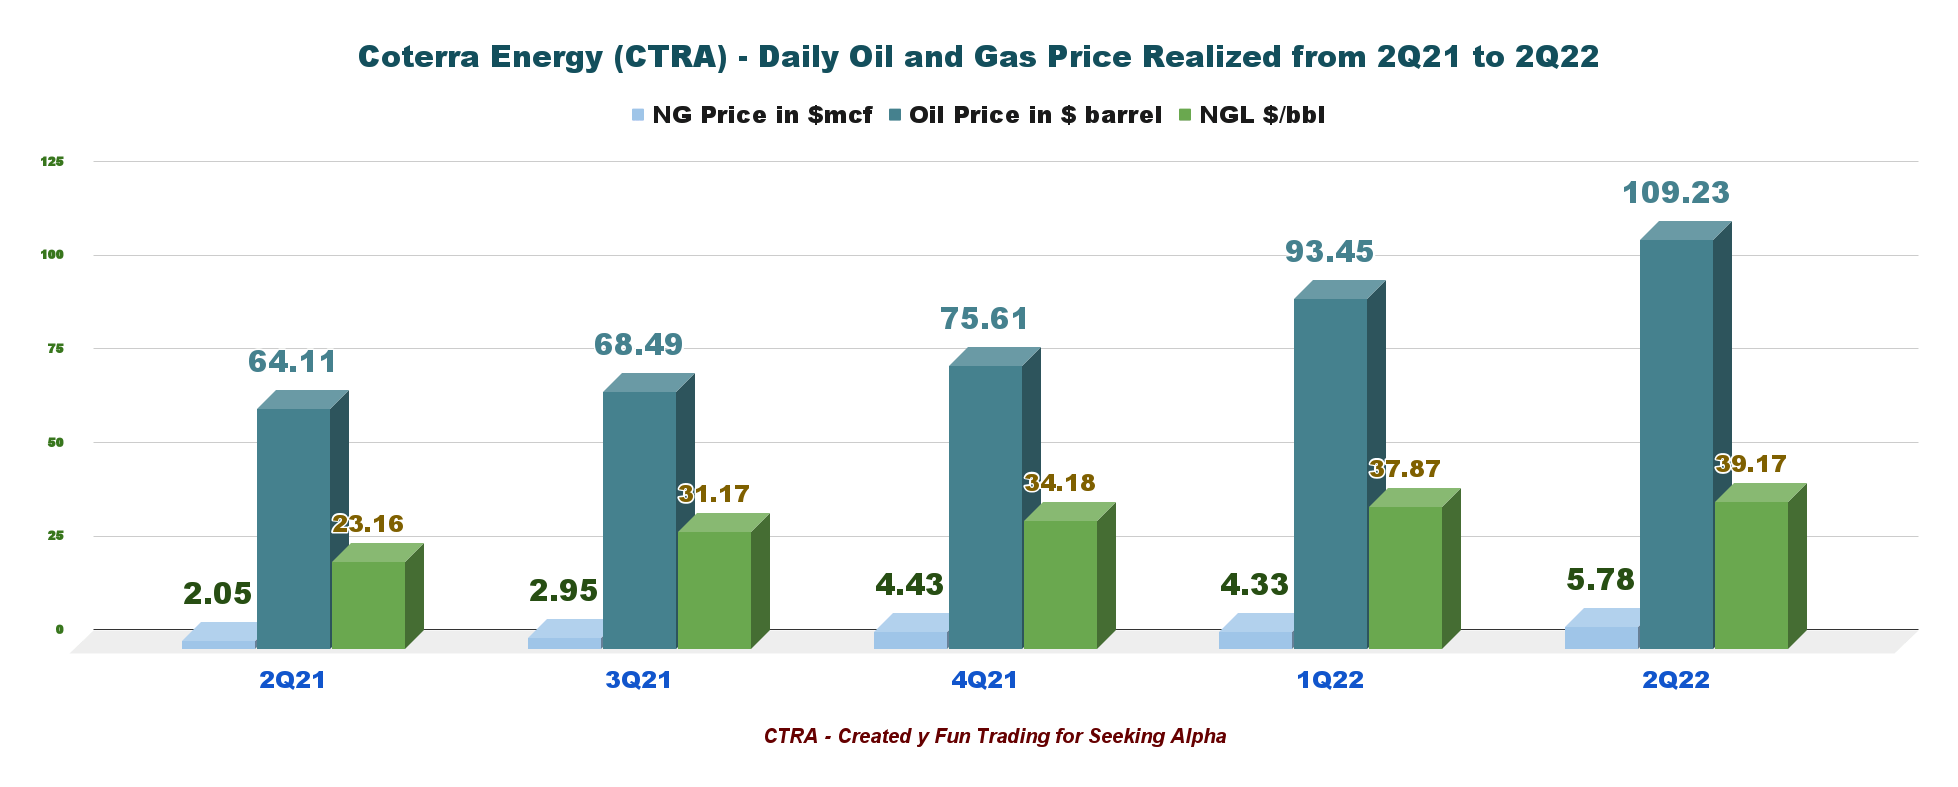
4 – Net Debt is $2.05 billion as of 2Q22
CTRA Quarterly Cash versus Debt history (Fun Trading)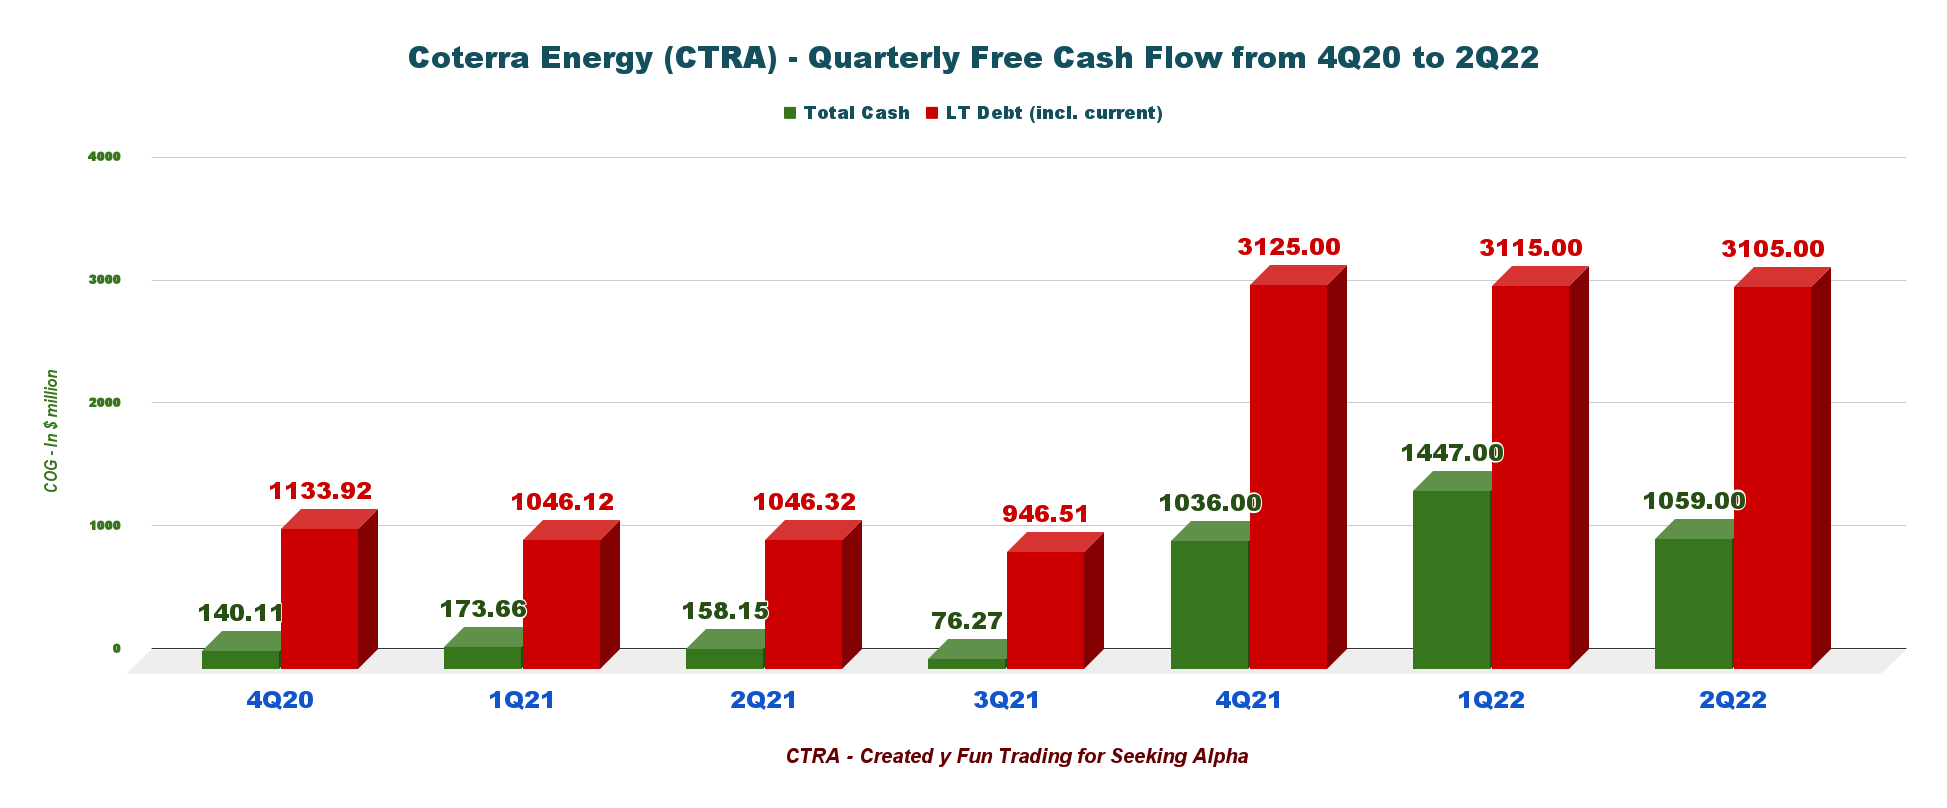
On June 30, 2022, Coterra Energy indicated a total debt of $3,105 million (including current) and cash on hand of $1,059 million.
Liquidity is $2.559 billion. The company is also indicating its 2022 Hedge summary below:
CTRA Balance sheet (Coterra Energy Presentation)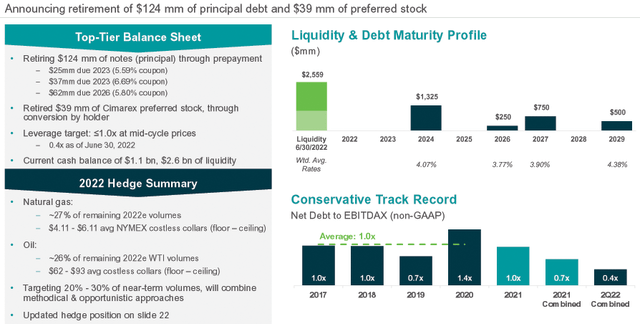
5 – 2022 Outlook
For 2021, Coterra Energy is forecasting initial production guidance of 615-635K Boep/d, which is a bit down (using mid-point) from 2020 (634K Boep/d). Total CapEx has been increased to $1.6-$1.7 billion (up from the February guidance of $1.45 billion) due to inflationary pressure.
CTRA 2022 Guidance Presentation (Coterra Energy)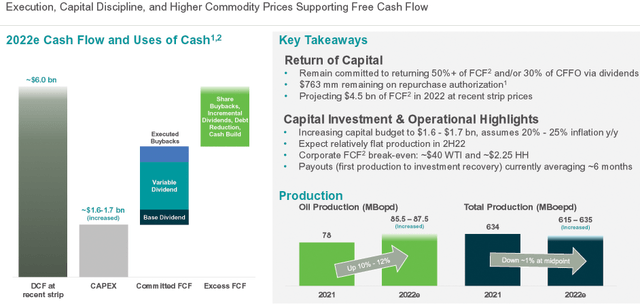
Technical Analysis Short Term and Commentary
CTRA TA Chart short-term (Fun Trading StockCharts)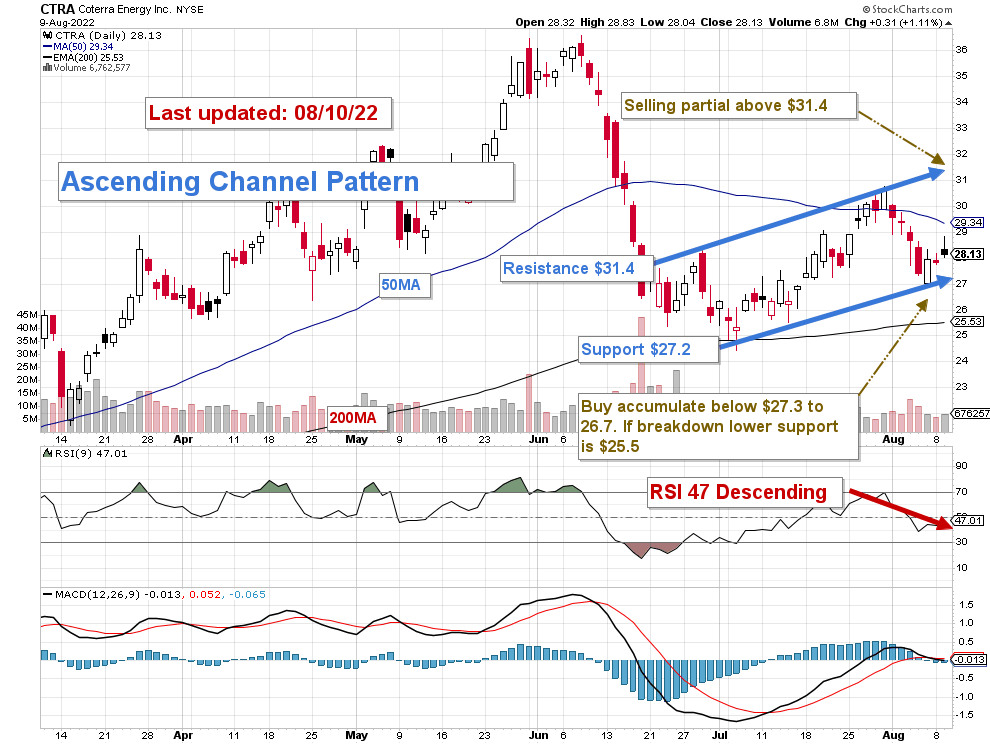
Note: The chart is adjusted for the dividend.
CTRA forms an ascending channel pattern with resistance at $31.4 and support at $27.2. The trading strategy is to sell about 30% to 40% of your position above $31.4.
However, I suggest selling about 10%-15% at the 50MA at $29.4, which is a possible intermediate resistance.
Conversely, I recommend buying and accumulating CTRA below $27.3 with potential lower support at around $25.5.
Note: The LIFO method is prohibited under International Financial Reporting Standards (IFRS), though it is permitted in the United States by Generally Accepted Accounting Principles (GAAP). Therefore, only US traders can apply this method. Those who cannot trade LIFO can use an alternative by setting two different accounts for the same stock, one for the long-term and one for short-term trading.
Warning: The TA chart must be updated frequently to be relevant. It is what I am doing in my stock tracker. The chart above has a possible validity of about a week. Remember, the TA chart is a tool only to help you adopt the right strategy. It is not a way to foresee the future. No one and nothing can.
Author’s note: If you find value in this article and would like to encourage such continued efforts, please click the “Like” button below to vote for support. Thanks.
Be the first to comment