

That’s YOUR savings eroding away with CRF’s NAV. Don’t be fooled into paying management to pay you your own money back. Alex Potemkin/iStock via Getty Images
Cornerstone Total Return Fund (NYSE:CRF) is one of a pair of closed-end funds which Cornerstone manages. The other is Cornerstone Strategic Value Fund (CLM) which I wrote about last week in an article entitled “Cornerstone Strategic Value Fund: Expect A 2023 Distribution Cut.” Both funds operate so similarly that the announcement regarding 2023 distributions for each fund came through the same press release.
In this press release Cornerstone announces monthly distribution amounts through the end of the year. And they announce that 2023 distributions for both funds will be set based on the end of October NAV. This is a recurring strategy of the fund and happens annually so there is nothing specifically notable about this.
My article regarding CLM argued that given most recent NAV data that a distribution cut was highly likely.
With CRF operating essentially the same way this article details the same likelihood of a 2023 distribution cut. After reviewing the fund’s portfolio and history I’ll highlight three mean reversion data points which similarly suggest a stock price decline in the near term.
Ultimately, I’d simply advise investors to look elsewhere for returns.
A Closer Look at Cornerstone Total Return Fund
CRF is a closed end fund with a stated objective of “capital appreciation with current income as a secondary objective.” Its benchmark is the S&P 500. As of 9/30/2022 net asset value per share was $6.42 with 99.563m shares outstanding.
CRF Website: NAV as 9/30/22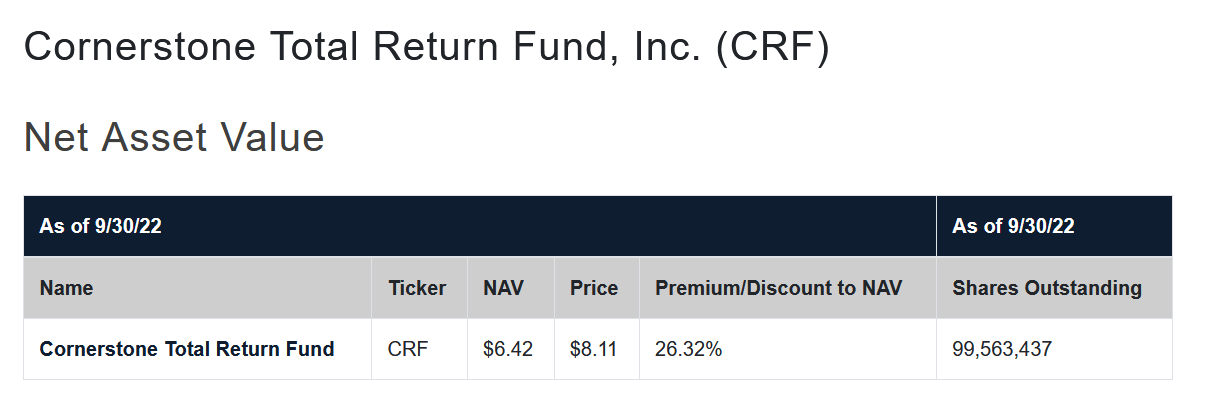
The price as of writing is $8.41, meaning CRF stock trades at a 31% premium to NAV. We’ll come back to that premium later.
At the end of August 2022 the company published their Certified Shareholder Report which outlines portfolio details as of 6/30/2022. Looking through this helps to give a picture of how the fund is allocated. From this we can see that their top ten holdings are large cap names.
CRF Filing: List of top ten holdings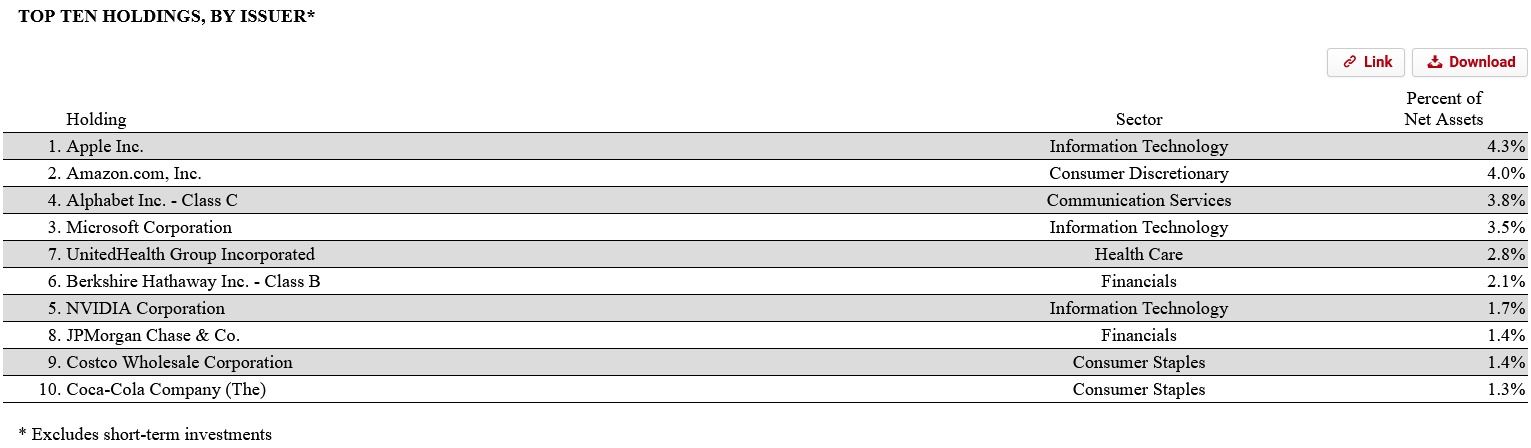
Over the last five years the average annual turnover rate for the portfolio is 71% so this is an actively managed fund. Halfway through FY22 turnover rate has been just 19%. Just something to keep in mind when considering the fund’s holdings.
Here’s a look at their top ten holdings last year which shows pretty similar names.
CRF Filing: List of top ten holdings in 2021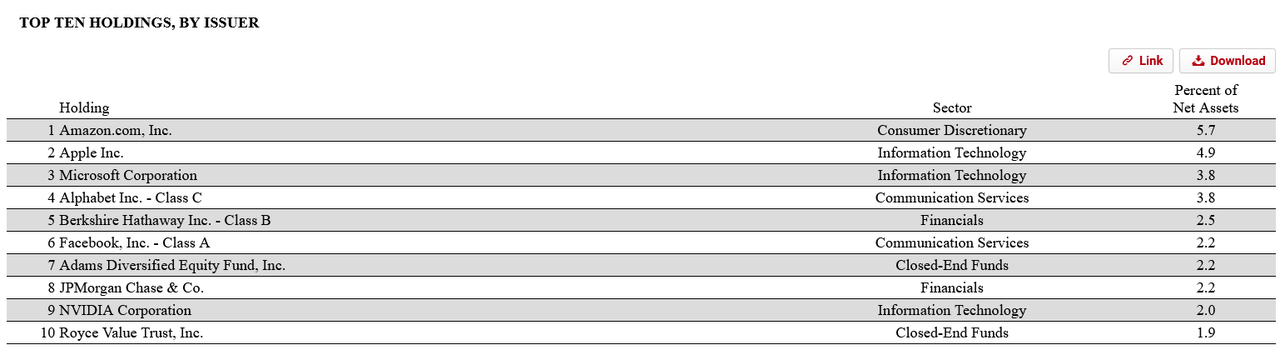
The only major difference I note between the two is the asterisk note this year regarding short-term investments. A closer look at the portfolio will show that this is because their largest position was 12.81% of the portfolio in Fidelity Institutional Money Market Government Portfolio (FIGXX). It’s essentially a cash position which the fund can use to pay out their dividend or deploy into securities. This position is worth $90.402m.
In total the fund managed 185 positions with sector allocations predominantly in information technology (18.3%) and health care (13.9%). Both of these sectors have seen YTD declines of -36.32% and -29.87%, respectively.
CRF Filing: Sector allocation %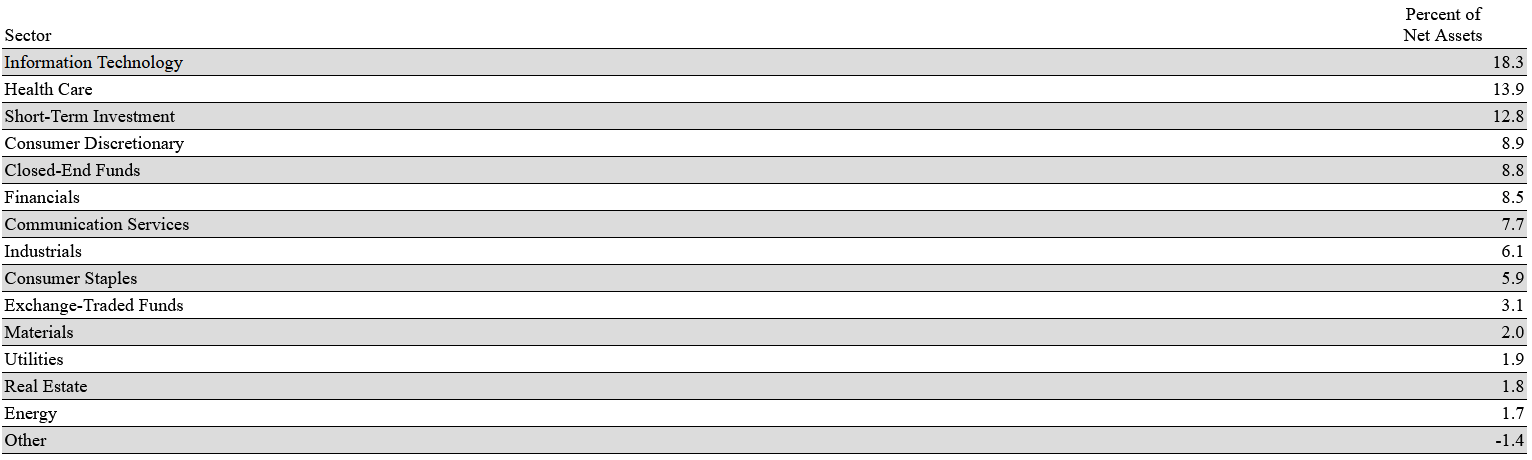
From my review of the portfolio it seems to be a basket of equities which should largely track the S&P 500. Management uses some active tactics which we can’t really see the specifics of but we can gauge their performance based on their total investment return data. Here’s a picture of that table.
CRF Filing: Total investment return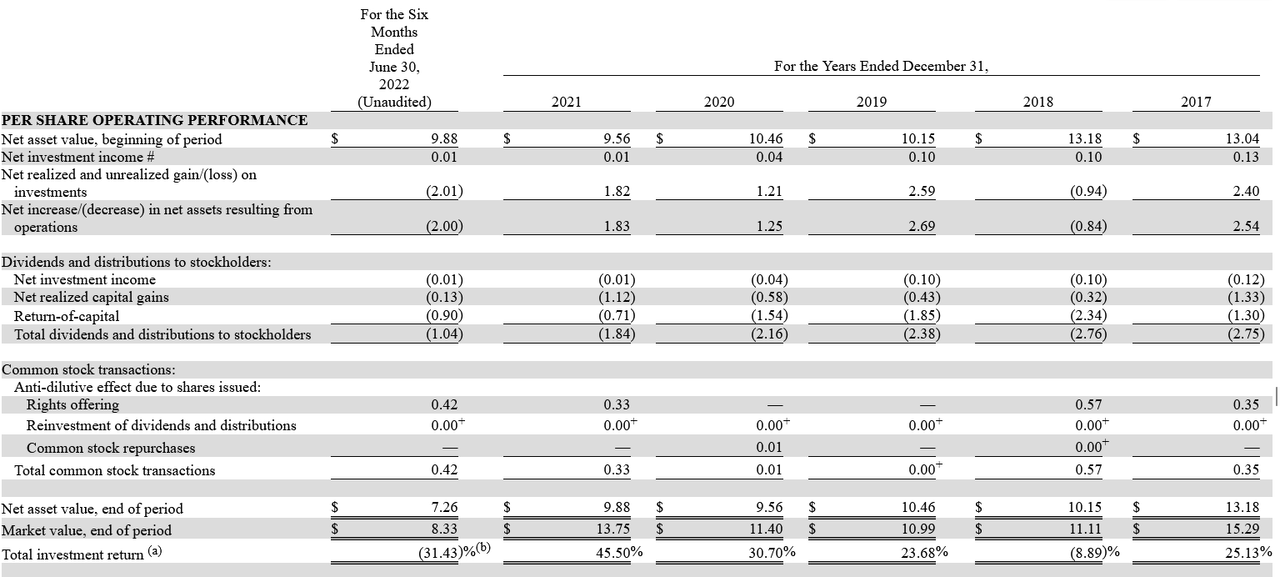
First let’s clarify how “total investment return” is defined. Here is the relevant detail from the filing:
Total investment return at market value is based on the changes in market price of a share during the period and assumes reinvestment of dividends and distributions, if any, at actual prices pursuant to the Fund’s dividend reinvestment plan. Total investment return does not reflect brokerage commissions.“
A unique feature of both Cornerstone funds is their dividend reinvestment plan (DRIP), which allows owners to reinvest their distributions to purchase shares at NAV rather than market prices. Both Cornerstone funds often trade at a significant premium to NAV with CRF currently trading at 26.32% premium. And this is typical.
What the fund clarifies is that the total investment return metric assumes reinvesting according to this policy and capturing the NAV-to-premium DRIP benefit.
Based on that we can see that if one buys-and-holds CRF while reinvesting distributions through the fund’s advantaged policy that five year annual average returns are 23.224%. This compares favorably to their benchmark’s five-year annual average return of 19.21%.
|
Year |
S&P 500 % Return |
CRF % Return |
|
2021 |
28.71 |
45.5 |
|
2020 |
18.4 |
30.7 |
|
2019 |
31.49 |
23.68 |
|
2018 |
-4.38 |
-8.89 |
|
2017 |
21.83 |
25.13 |
|
Average |
19.21 |
23.224 |
Yet something that is notable underneath the return data is the NAV erosion. From the data above we can see that NAV was $13.04 at the beginning of 2017 compared to the 9/30/22 NAV of $6.45. This represents a -50.54% decline in NAV over this time period. Or annual destruction of -10.11%.
This isn’t a short term feature. It’s a 20-year downward trend in line with when the company started their monthly distribution policy in January 2002.
Morningstar: CRF All-time chart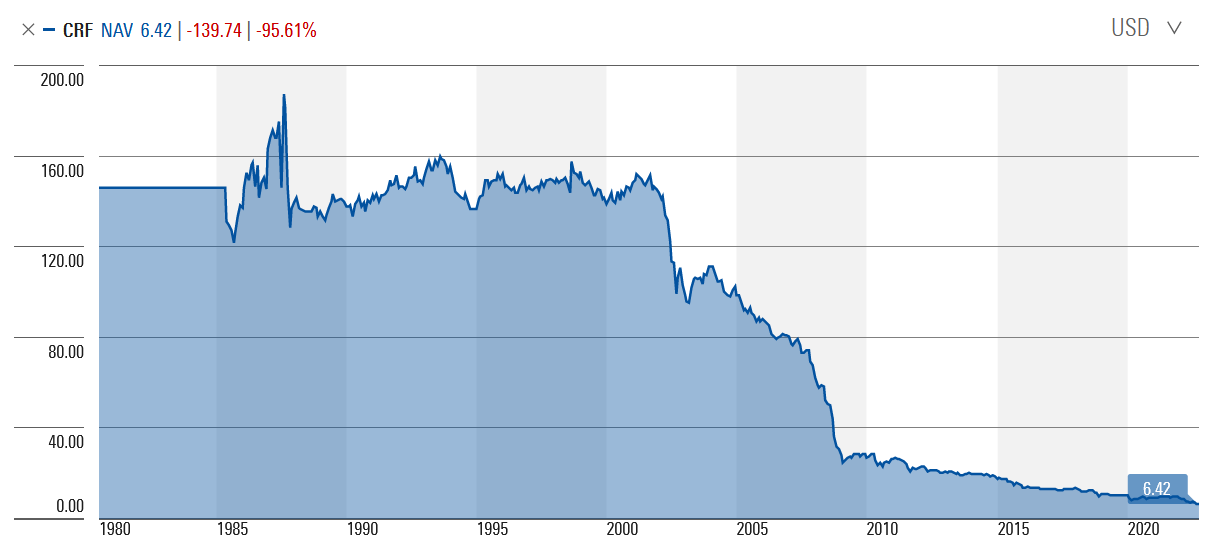
So what this represents to me is that while there may be ways to generate returns with CRF owners can be assured that the strategy employed is destroying NAV. It’s no secret that the distribution is not covered by the portfolio. In CRF’s managed distribution policy they explain this in the second paragraph: “During recent years, the Fund’s investments made in accordance with its objective have failed to provide adequate income to meet the requirements of the managed distribution policy.“
The result has been that over the last five years distributions have been mostly through a return of capital. To be precise, $7.74 per share has been paid out as a return of capital (ROC) in the last five years. What does this mean exactly though?
An article from Nuveen entitled “Understanding return of capital in closed-end funds” has some information regarding this key detail. But really it all comes down to this:
If the RoC amount exceeds the fund’s unrealized appreciation, some or all of the RoC will represent part of the shareholders’ initial investment capital. If a fund continues to pay out part of this initial capital, its assets – and earning power – will diminish over time.“
For someone who bought in 2017 when NAV was $13.04 they would have seen 59% of their money come back to them in the form of distributions. With a 20-year trend established of NAV destruction it seems likely that this will continue. And if we are headed for any kind of extended bear market then the prospects for CRF look even worse.
Expect a 2023 Distribution Cut
CRF trades with an apparent 25% dividend yield. Though this is not the reality. Distributions have been announced for this month through the end of the year at $0.1734 a month.
When January rolls around the distribution will be set for the 2023 calendar year at 21% of whatever NAV is at the end of this month. Here’s a table with a range of possible NAV outcomes and what that might represent in terms of distribution and dividend yield.
|
NAV |
Monthly distribution |
Implied Dividend Yield on $8.41 Market Price |
Implied NAV Change |
|
$5.50 |
$0.0963 |
13.73% |
-14.33% |
|
$6.00 |
$0.1050 |
14.98% |
-6.54% |
|
$6.42 |
$0.1124 |
16.03% |
0.00% |
|
$6.50 |
$0.1138 |
16.23% |
1.25% |
|
$7.00 |
$0.1225 |
17.48% |
9.03% |
|
$7.50 |
$0.1313 |
18.73% |
16.82% |
|
$8.00 |
$0.1400 |
19.98% |
24.61% |
|
$8.50 |
$0.1488 |
21.22% |
32.40% |
|
$9.00 |
$0.1575 |
22.47% |
40.19% |
|
$9.50 |
$0.1663 |
23.72% |
47.98% |
|
$10.00 |
$0.1750 |
24.97% |
55.76% |
The bolded $6.42 row represents where NAV is currently. Assuming no particular directionality on NAV in the next month, monthly distributions for next year would be $0.1124 per share. That’s a 16.03% dividend yield based on current market prices of CRF and represents a 36% decrease over the previous annual yield.
If one believes that there will be some recovery in NAV over the next month then you can pick your place in the chart to gauge where the distributions might end up. For what it’s worth, I think it’s unlikely that NAV recovers beyond the $7.00 mark in the near term.
And in all cases in that table the dividend yield number will go down. So unless one believes that NAV appreciates above 55% in the coming month then the monthly distribution is going to be cut.
Mean Reversion
A headline of “Cornerstone cuts monthly distribution by ~30%” likely is not going to drive the stock higher. If we look at 52-week average data as well it looks like mean reversion may be in store as well. Here’s a table of data from CEF Connect pulled on 10/3/2022.
| SharePrice | NAV | Premium/Discount | |
| Current | $8.41 | $6.42 | 31.00% |
| 52 Wk Avg | $11.67 | $8.50 | 37.29% |
| 52 Wk High | $14.20 | $10.12 | 40.32% |
| 52 Wk Low | $7.41 | $6.42 | 15.42% |
If we consider the 52-week average share price of $11.67 we can estimate that the 52-week average distribution yield to be 17.83%. What this means is that based on CRF’s trading history a ~16% dividend yield would be low. To drive that closer to the average the stock price would need to go down.
On the other hand if one considers the premium/discount 52-week average compared to current it might suggest that the stock has room to move to the upside. This premium in part exists due to the benefit one receives from the fund’s DRIP policy which is structural, implying a long-term benefit. What’s of note though is that the five-year average premium is 18.24%. In this case the stock price would need to come down for mean reversion as well.
From the broader universe of CEFs this premium to discount is an extreme outlier. If we consider all 448 CEFs which come up in CEFConnect’s Daily Pricing tool the average discount to NAV is -7.63% (data pulled on 9/29/2022). Standard deviation amongst the data set is 10.28%, which means CRF’s 52-week average premium of 36.49% is a full 4.29 standard deviations above the CEF mean.
For those of you that read “4.29 standard deviations above the mean” and understandably have no reaction let me help give some additional statistical context. One common method to define outliers in a data set is the three sigma rule of thumb. It’s a known heuristic which essentially means that nearly all values in a data set are within three standard deviations or sigmas of the mean. Empirically speaking “nearly all values” translates to 99.7% of all values.
So with CRF trading at 4.29 standard deviations above the CEF average that implies it is a statistical outlier in the 0.3% range of values. That’s exceptional. Especially considering empirically a three-sigma effect at 99.7% is taken to imply near certainty. In particle physics where the decimals move farther and farther to the left they often use a five-sigma heuristic to define a discovery. Five sigmas imply 99.99994% confidence just for reference of how little this really moves after three sigmas.
Trading at three standard deviations above a data set’s mean is remarkable. Trading at four is incredible. An argument could be made (and likely will be in the comments) that CRF is that remarkable. That this CEF amidst a universe of 448 CEF deserves its incredibly high average premium to NAV given the DRIP policy and opportunities to sell at market.
I’m not buying it though. Instead, I think it’s more likely that the fund will revert closer to the mean. Even a three sigma reversion would keep CRF trading at an exceptional 23.21% premium to NAV. This would still keep CRF above their five year average premium, too. If we apply that premium to NAV of $6.42 that would imply a CRF price of $7.91.
In Conclusion: Sell Cornerstone Total Return Fund
The nature of the fund has ensured long-term net asset value destruction over the last twenty years. Management has achieved this through a strategy of setting an annual 21% distribution based on NAV and paying it out largely as returns of capital. Returns with CRF can be materially improved simply by adopting the fund’s DRIP policy which allows owners to reinvest distributions to purchase shares at NAV. With the fund on average trading significantly above NAV this is a real benefit and really the only way to make this fund investable.
Despite this benefit I think the only money being made here is speculative. While total investment return leveraging the DRIP function outperformed the S&P 500 according to an average of 5-year annual returns, the decade ahead looks nothing like the decade just past. One of the longest bull runs in market history is likely capitulating to a sideways market at the least. At worst we are in the early innings of a bear market.
I’m not a market predictor so I certainly can be wrong. But in either of those cases NAV destruction may be accelerated by the markets. And distributions will continue to be a return of your own capital.
Amidst the macro uncertainty we are pretty much guaranteed to see a 2023 distribution cut announced in November. This cut could be in the range of ~30% which is sizable for those looking to invest here. For those who still remain interested in CRF long term I think a prudent approach is to sell now and buy back in after the distribution cut.
But ultimately I would recommend investors to stay away from these funds as long-term investments. We are fortunate to have a number of loyal Cornerstone fund fans on Seeking Alpha who diligently explain through comments how a more active approach can improve investment returns even beyond the DRIP at NAV feature. But even with DRIP the average annual returns of 23% do not look appealing to me based on the reality that NAV destruction is part of what you’re paying for as well.
Over the long term it’s impossible to maintain returns at this level while NAV is declining. The trend is already clearly in place and further evidenced by accelerated return of capital in the last five years. Owners of today or even next year may not have to face that problem, but it is an inevitability given the current trend. That beyond anything is the greatest reason to sell.
Be the first to comment