

imagedepotpro
September is historically the worst month for stocks, and this one was certainly a September to remember.
YCharts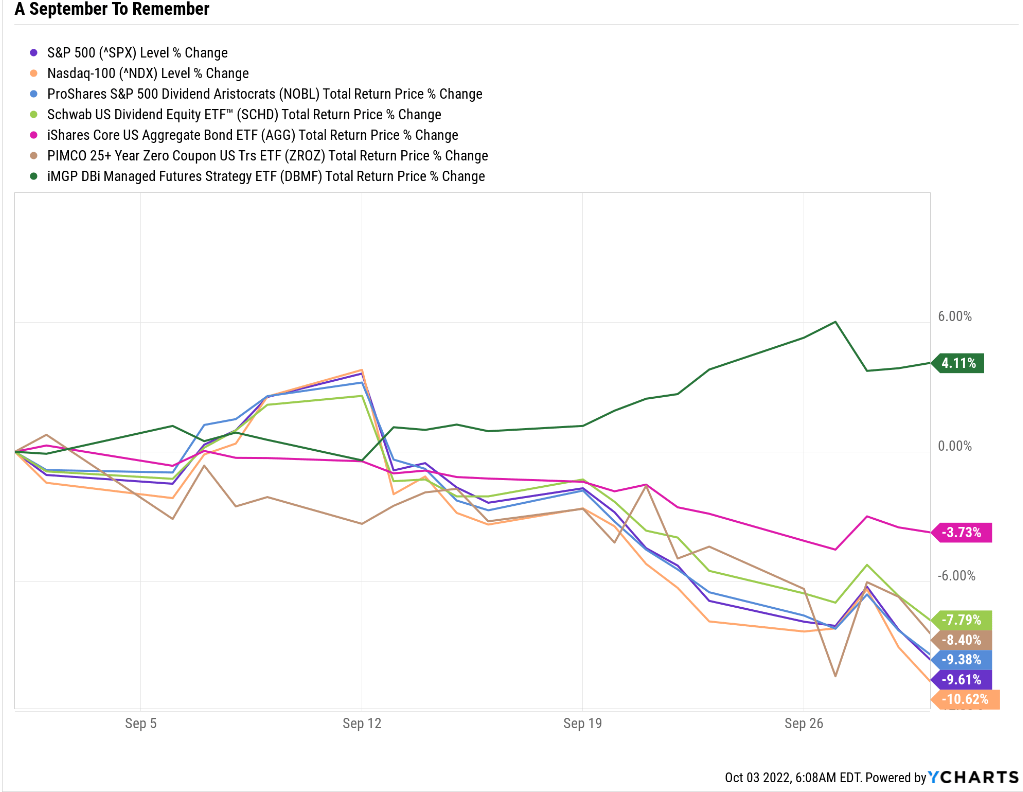
Everything is falling, whether it be tech, value, high-yield, or even bonds aren’t offering a place to hide. Only managed futures, the big winner in this bear market so far, continue to offer a safe haven for now.
The market is now down five consecutive weeks and has posted negative returns for three straight quarters.
- the worst quarterly losing streak since 2009
YCharts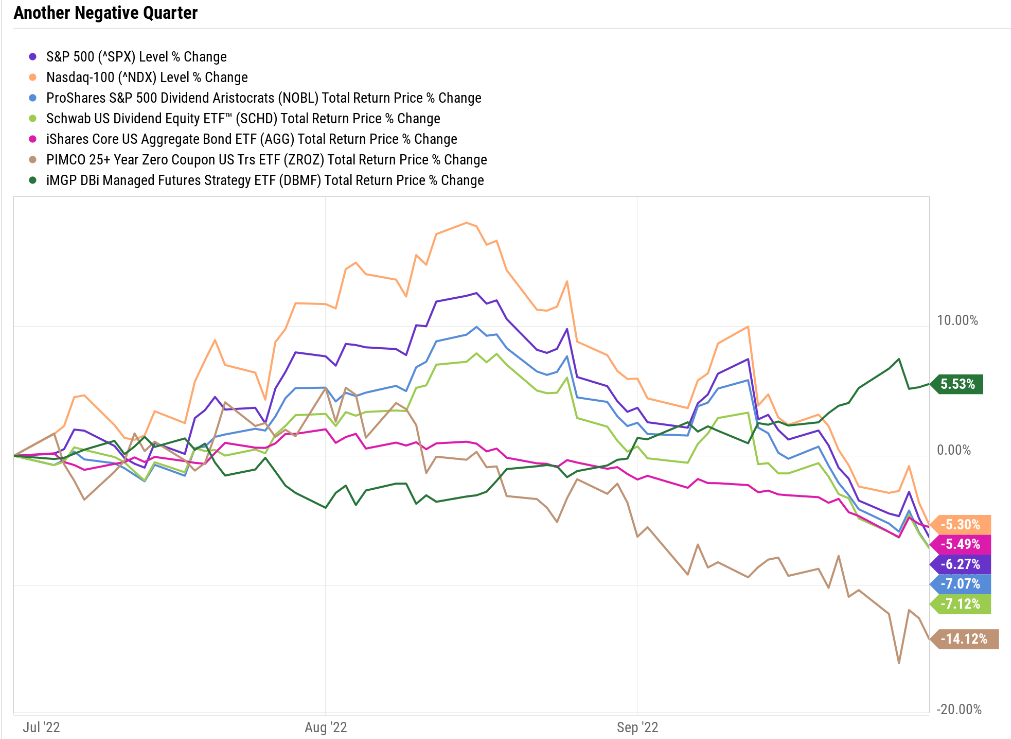
And, of course, for the full year, things look bad, really bad, for most investors.
YCharts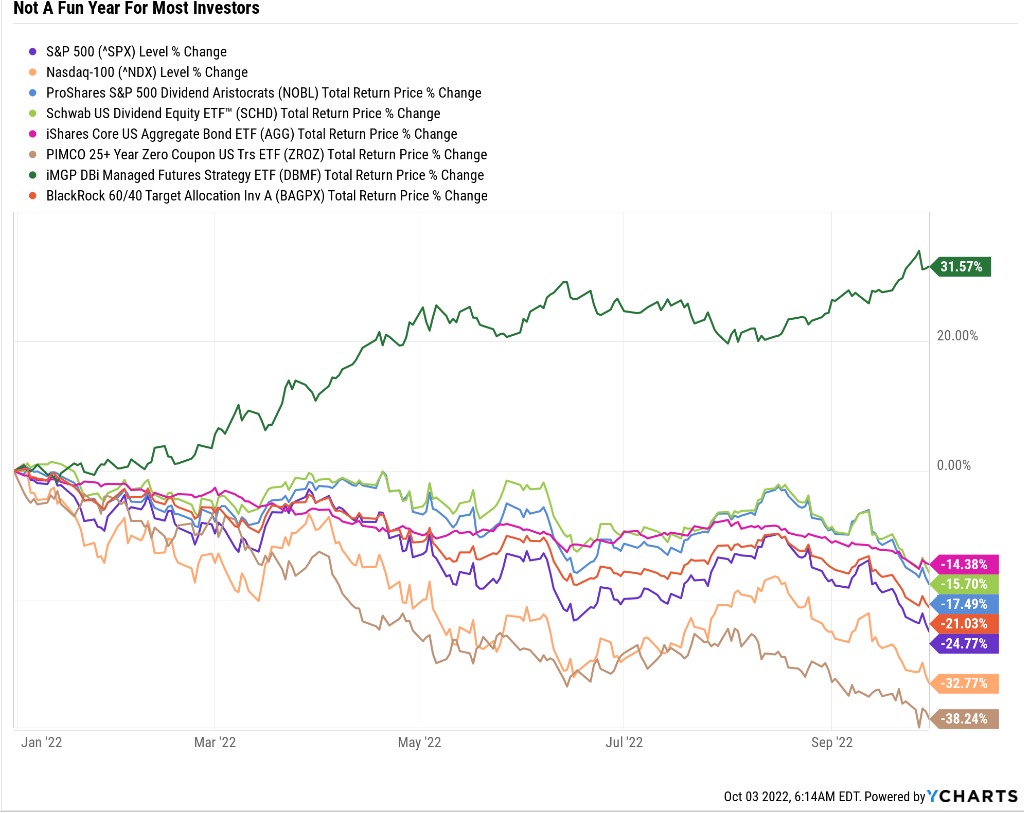
YTD there is nothing but pain other than managed futures.
- Avoid These 2 Stocks And Buy This 11% Yielding World-Beater Instead
- 3 Amazing Dividend Blue-Chips Beating This Bear Market
Thus far, soaring interest rates, courtesy of the worst inflation in 41 years and the most hawkish fed in four decades, have been the major culprit.
Daily Shot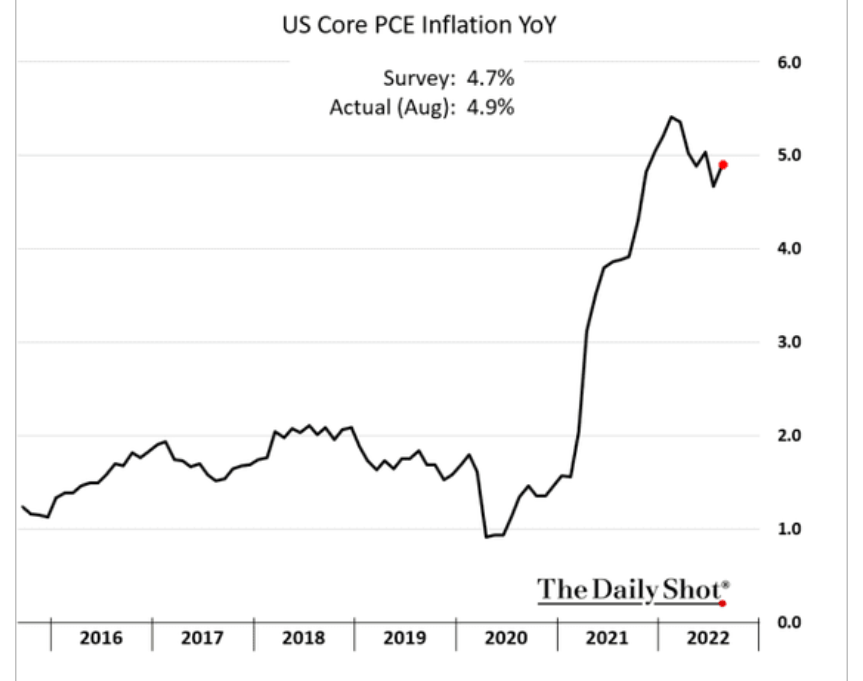
Jerome Powell said at the most recent Fed press conference that the FOMC plans to take interest rates above core inflation and keep them there until core inflation falls “at least 1%” below the Fed funds rate.
Core PCE, the Fed’s official inflation metric, peaked at 5.2% back in March and has been falling pretty steadily, but has now started climbing again.
- housing is 40% of core inflation
- and housing inflation peaks about 12 months after housing costs do
- due to the timing of rental lease renewals, most are 12-month leases
According to UBS rent inflation peaked in June (housing prices too), so that means housing inflation as measured by the government might not peak until January to June 2023.
- Morgan Stanley thinks housing inflation peaks in January
- Moody’s February or March
- UBS possibly as long as June
Cleveland Fed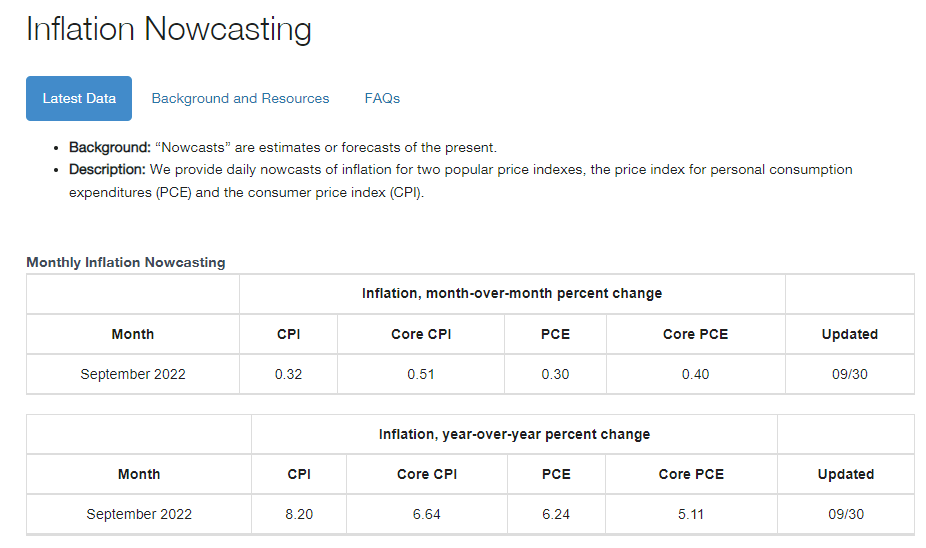
The Cleveland Fed’s inflation model, which is updated daily, expects core PCE to rise another 0.2% for the next report, and in the next day or two, we’ll get their first estimate for the November report.
If we are to take Jerome Powell at his word, the Fed has much more hiking left to do.
- 5.25% peak rate (at least) if the Cleveland Fed is right
The Cleveland Fed’s president last Thursday said that not even recession will cause the Fed to lose its nerve in its war with inflation.
Previously, Mester told Bloomberg (at Jackson Hole) that the Fed is willing to go as high as 6% for two years if that’s what it takes to beat inflation.
Fed Fund Futures Expectations
CME Group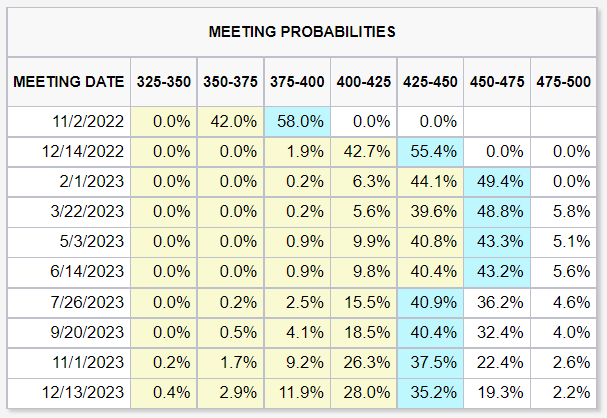
The bond market is now pricing in the dot plot median 4.5% peak terminal rate and possibly no rate hikes until September.
- Fed says none until possibly October 2024
What does this mean for investors in the short-term?
Short-term yields are mainly driven by what the Fed is doing, and so the short end of the curve (2 years and shorter) isn’t expected to stop rising until the Fed peaks and pauses.
Economic and inflation expectations determine long yields.
YCharts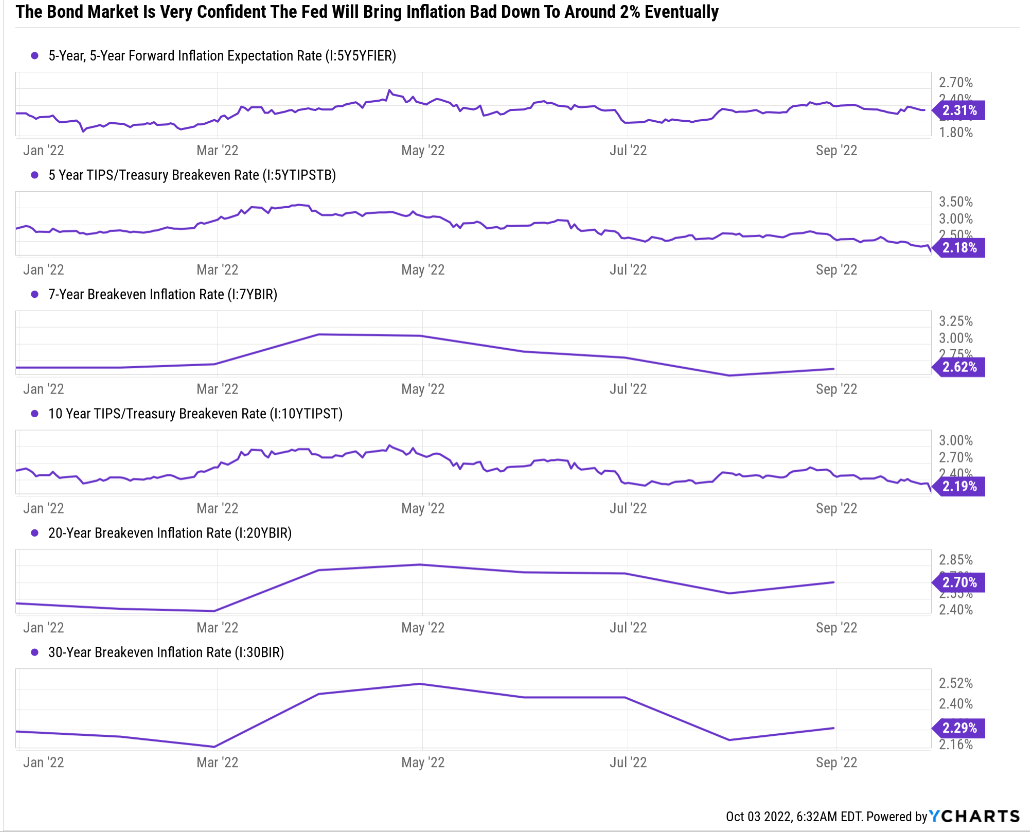
The bond market remains confident the Fed will beat inflation. How long might it take? The Fed now thinks around 2% inflation can be achieved by the end of 2025.
So what does this mean for bond investors?
- short end pain likely ends in the first half of 2023
- Deutsche Bank thinks the Fed will go as high as 4.75% or 5%
Long-end bond pain might not end until the economy shows signs of weakness, which probably won’t be this year.
- 9 to 12-month lag between rate hikes and when the data starts to show the effects
- Fed started hiking in March 2022
For example, the unstoppable US job market is a major concern for the Fed due to sticky wage pressure.
- The median consensus for Friday’s job report +280K, down from 308K last month
The FactSet consensus expects 5.2% YOY wage growth and 3.7% unemployment, and we could potentially see another month of 300K job creation.
Morgan Stanley and Moody’s both still think a soft landing is most likely, expecting around 1.4% GDP growth next year (so no recession).
Dividend Kings S&P 500 Valuation Tool, NY Fed, CNBC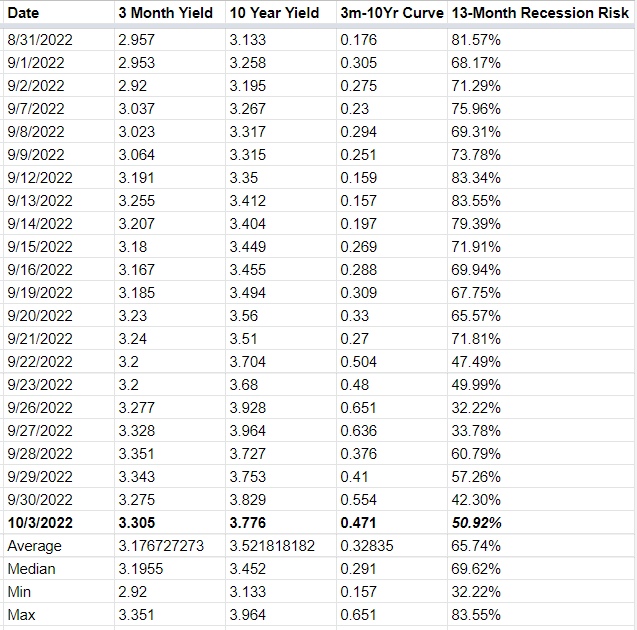
The bond market currently has a recession within 13 months as a coin-flip, a 51% probability.
The economic data does support that, though leading indicators say a recession might begin as early as April 2023.
What does all this mean for the market?
- Morgan Stanley thinks the final bottom arrives within 6 to 12 months.
- 3,000 to 3,400 on the S&P 500 depending on whether or not we get a recession
Per the request of several Dividend Kings members, today I wanted to highlight two high-yield blue-chips that represent potentially attractive long-term opportunities for anyone who is willing to look beyond the next year of what could be more stock market volatility.
Let me show you why OneMain Holdings (OMF) and LyondellBasell (LYB) are crazy, stupid, cheap blue-chip bargains. While they are not for everyone, for anyone comfortable with their risk profiles, today could be a potentially glorious long-term buying opportunity for anyone willing to take the bullish view that we might avoid a recession in 2023.
OneMain Holdings: One Of The Best Speculative Ultra-Yield Opportunities You’ve Never Heard Of
Further Reading
Investment Thesis
OneMain is the largest non-prime lender in America, meaning it makes loans to people with a FICO credit score of between 601 and 660.
investor presentation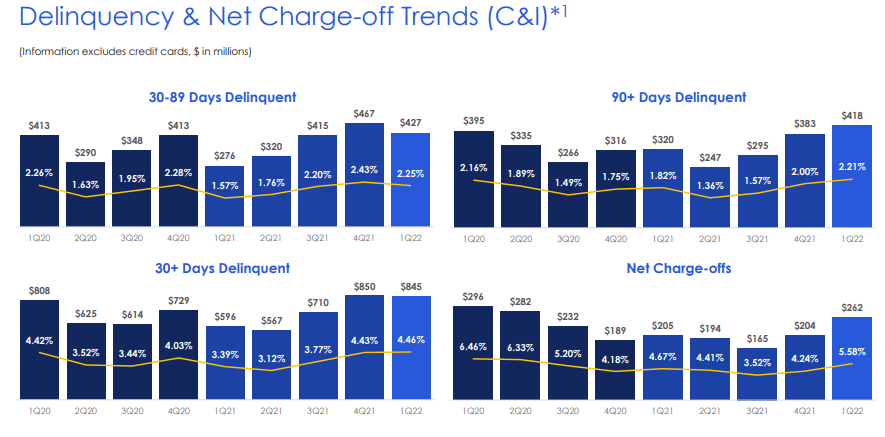
In Q1 2022, OMF reported 5.6% net charge-offs, meaning it was booking 5.6% loan losses.
- it then sells these loans to debt collectors
Federal Reserve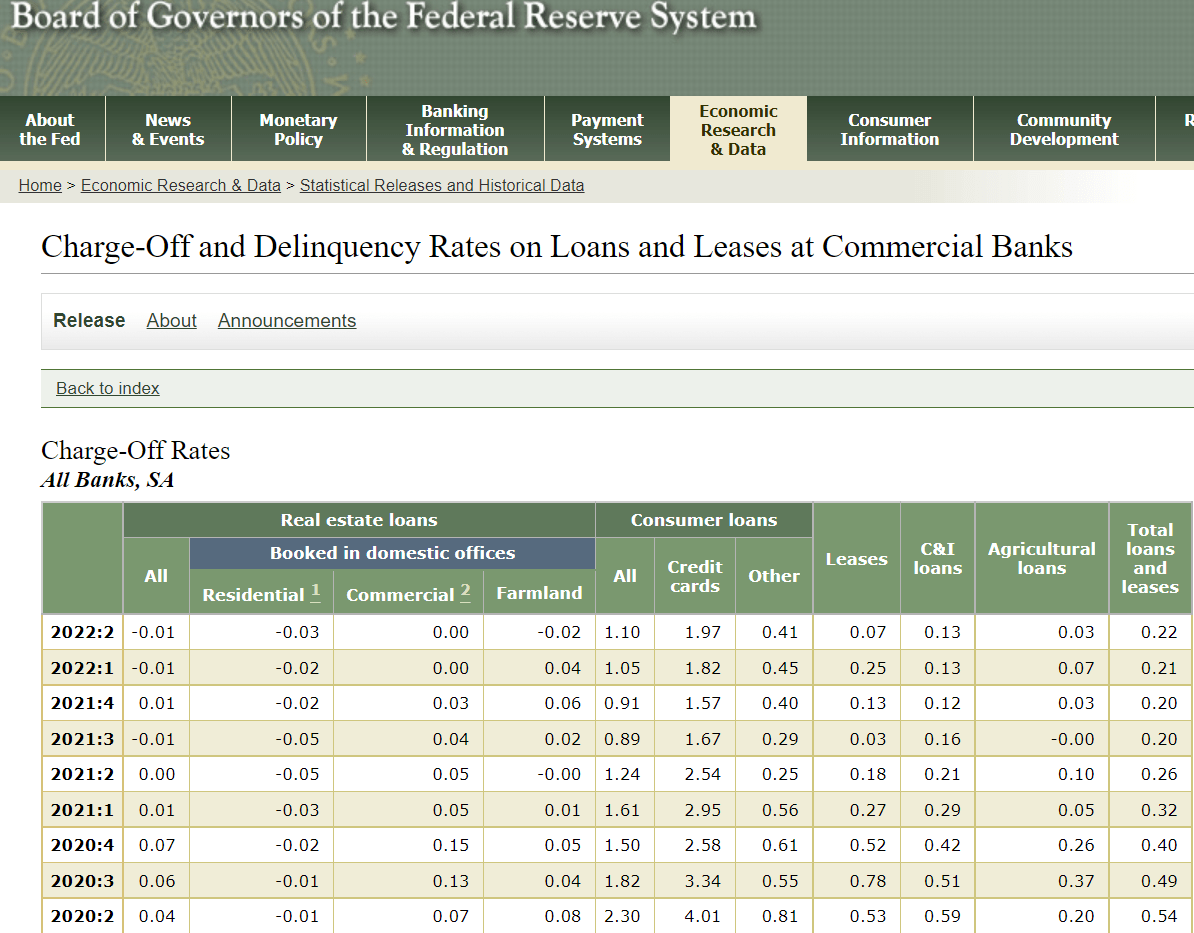
For context, the net charge-off rate for the banking system in Q1 2022 was 0.21%, with 1.05% for consumer loans.
In other words, non-prime lending involves a significantly higher risk of loan losses, which is why S&P rates OMF BB stable.
- a 17% 30-year bankruptcy risk
This is also why OMF tends to be a hyper-volatile name in bear markets, especially if recession risks rise.
YCharts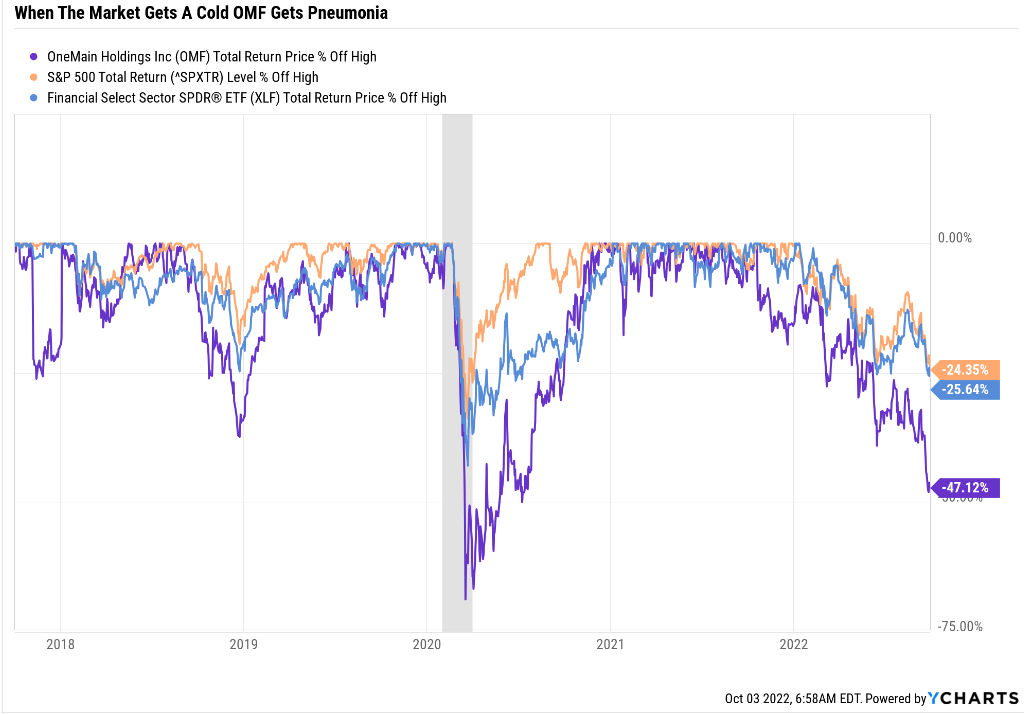
OMF is not a SWAN (sleep well at night) company but a speculative blue-chip that tends to crash hard during bear markets.
OMF’s yield hit almost 13% at the end of September, which is something you generally only see from unsafe BDCs or speculative CEFs specializing in things like leveraged loans.
FactSet Research Terminal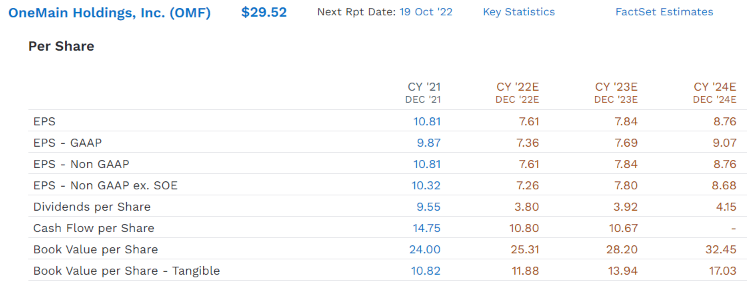
OMF paid two special dividends in 2021, and the regular dividend of $3.80 is expected to keep growing in the coming years.
- 2024 yield on today’s cost is 14.1%
So basically, OMF is a great alternative to BDC investing, in terms of ultra-yield that appears sustainable AND as an added benefit from a very rapid growth rate.
FactSet Research Terminal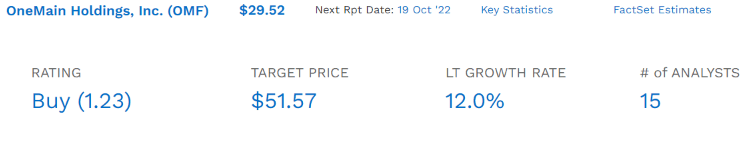
What BDC or CEF is growing at 12%? For that matter, what ultra-yield blue-chip is? None that I know of, which creates the potential for life-changing return potential for anyone comfortable with its speculative and higher-risk business model.
| Investment Strategy | Yield | LT Consensus Growth | LT Consensus Total Return Potential | Long-Term Risk-Adjusted Expected Return | Long-Term Inflation And Risk-Adjusted Expected Returns | Years To Double Your Inflation & Risk-Adjusted Wealth |
10-Year Inflation And Risk-Adjusted Expected Return |
| OneMain Holdings | 12.9% | 12.0% | 24.9% | 17.4% | 15.1% | 4.8 | 4.10 |
| Safe Midstream | 6.3% | 6.4% | 12.7% | 8.9% | 6.6% | 10.9 | 1.89 |
| REITs | 3.9% | 6.0% | 9.9% | 6.9% | 4.6% | 15.5 | 1.57 |
| Schwab US Dividend Equity ETF | 3.6% | 8.80% | 12.4% | 8.7% | 6.4% | 11.3 | 1.86 |
| Dividend Aristocrats | 2.8% | 8.7% | 11.5% | 8.1% | 5.8% | 12.5 | 1.75 |
| S&P 500 | 1.9% | 8.5% | 10.4% | 7.3% | 5.0% | 14.4 | 1.63 |
| Nasdaq | 0.9% | 11.8% | 12.7% | 8.9% | 6.6% | 10.9 | 1.89 |
(Source: DK Research Terminal, FactSet, Morningstar, YCharts)
OMF has a 50% payout ratio for 2022’s consensus earnings, so the dividend is sustainable even if earnings get cut in half in a severe recession.
And if this company, which historically has grown at 14.8% CAGR, grows as expected, it could deliver Buffett-like 25% annual returns for years or even decades to come.
OMF Is Crazy, Stupid, Cheap
FactSet Research Terminal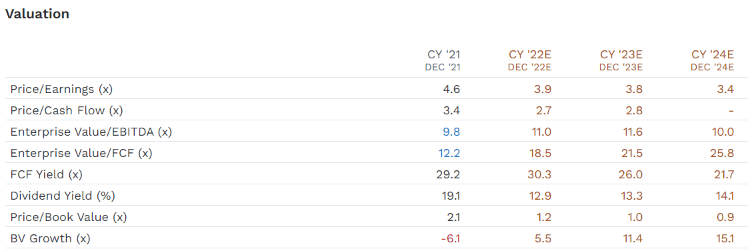
OMF is trading at less than 4X earnings right now and 1X book value for a company that’s growing at a very solid pace.
- Yet priced for -9.4% CAGR growth
I recommend a 2.5% or less max risk cap position sizing for this speculative blue-chip because of return potential like this.
OneMain 2024 Consensus Total Return Potential
(Source: FAST Graphs, FactSet)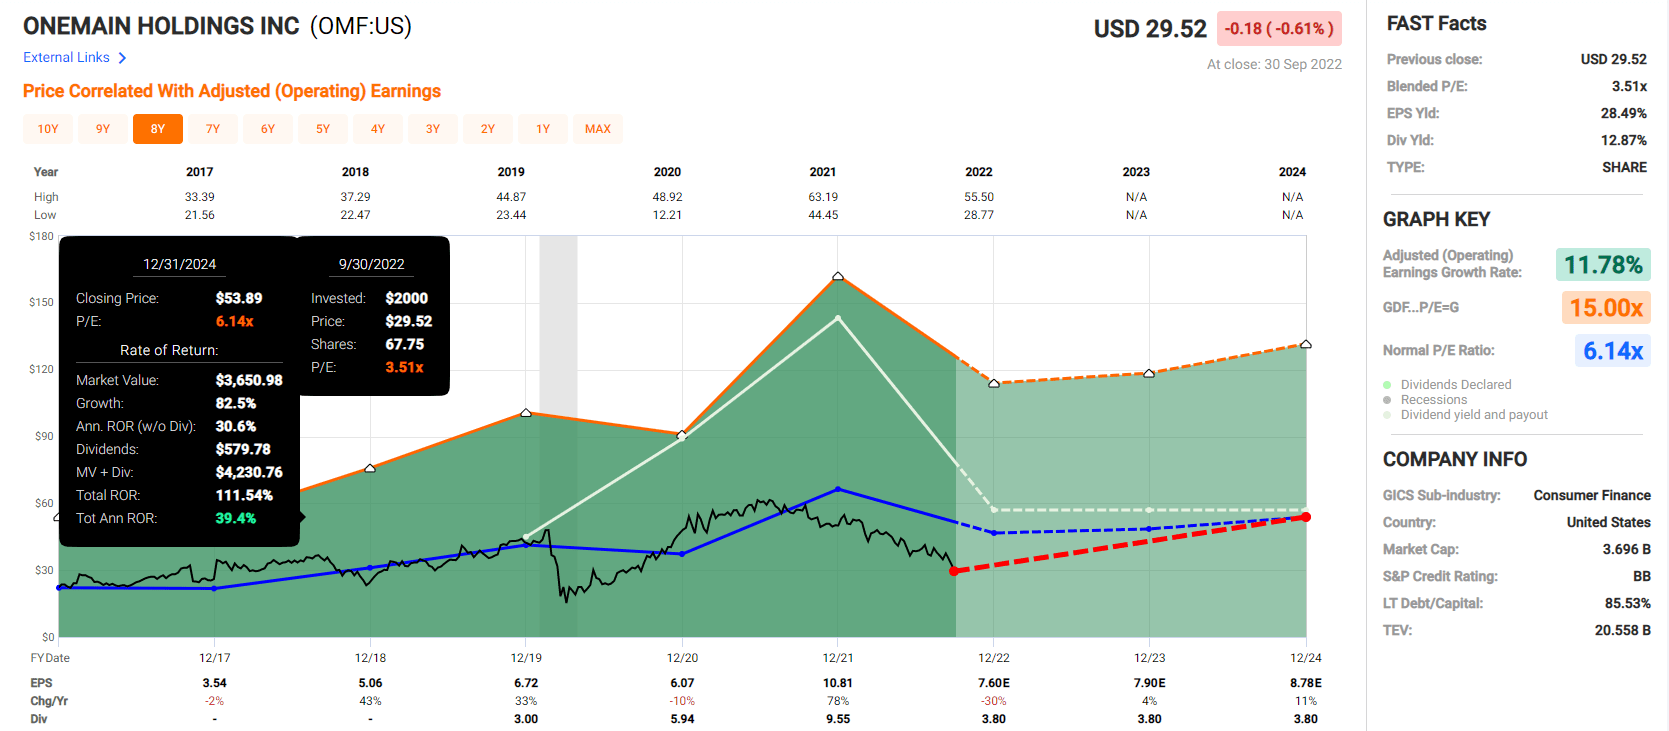
If OMF grows as expected and returns to its historically low fair value of just over 6X earnings, it could more than double by the end of 2024, delivering a Buffett-like 39% CAGR total return.
OneMain 2027 Consensus Total Return Potential
(Source: FAST Graphs, FactSet)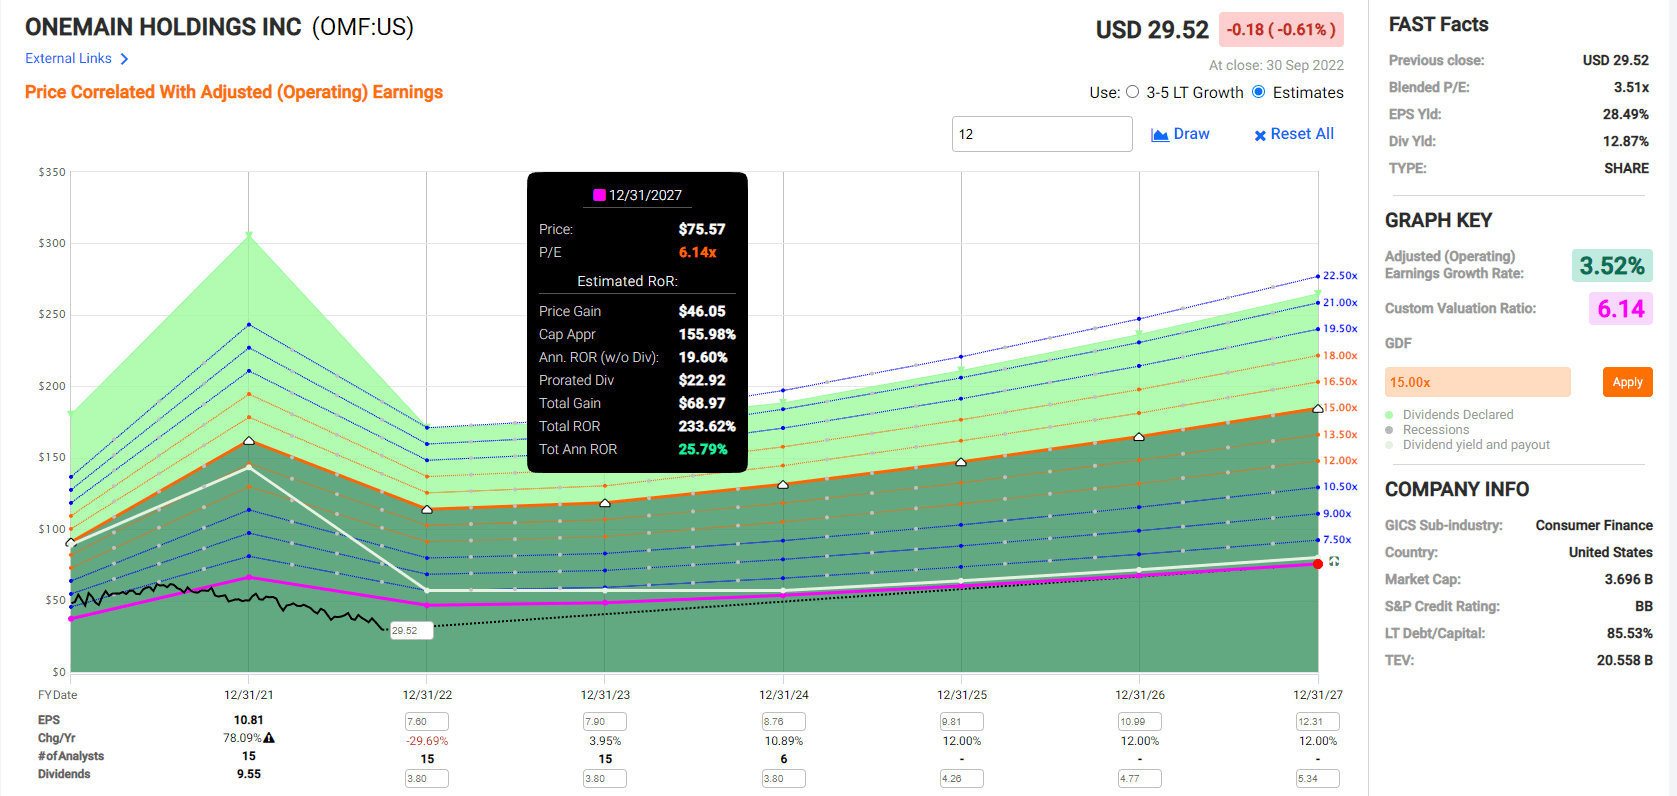
If OMF grows as expected and returns to historical fair value, then it could potentially deliver 233% total returns, or 26% annually over the next five years.
Now compare that to the 10% undervalued and 1.9% yielding S&P 500.
S&P 500 2024 Consensus Total Return Potential
(Source: FAST Graphs, FactSet)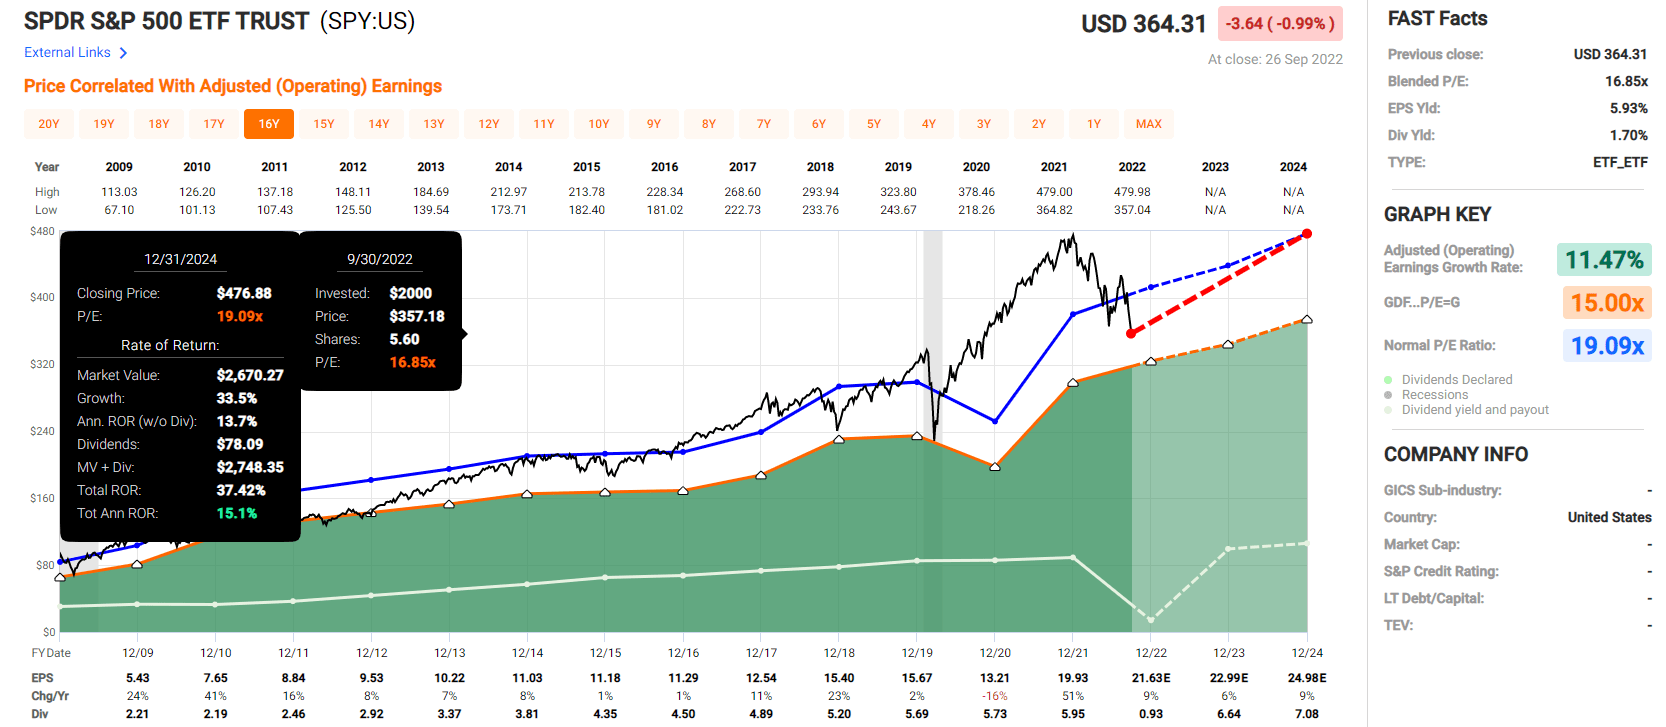
- analysts expect about 15% annual returns from the market in the coming years, totaling a 37% return
- OMF offers 2.5X the return potential of the S&P 500 over the next few years
S&P 500 2027 Consensus Total Return Potential
| Year | Upside Potential By End of That Year | Consensus CAGR Return Potential By End of That Year | Probability-Weighted Return (Annualized) |
Inflation And Risk-Adjusted Expected Returns |
| 2027 | 64.89% | 10.53% | 7.90% | 5.59% |
(Source: DK S&P 500 Valuation & Total Return Tool)
Over the next five years, analysts expect 10.5% annual returns from the S&P 500.
- OMF offers 4X the return potential of the S&P 500
OMF Corp Investment Decision Tool
DK (Source: Dividend Kings Automated Investment Decision Tool)
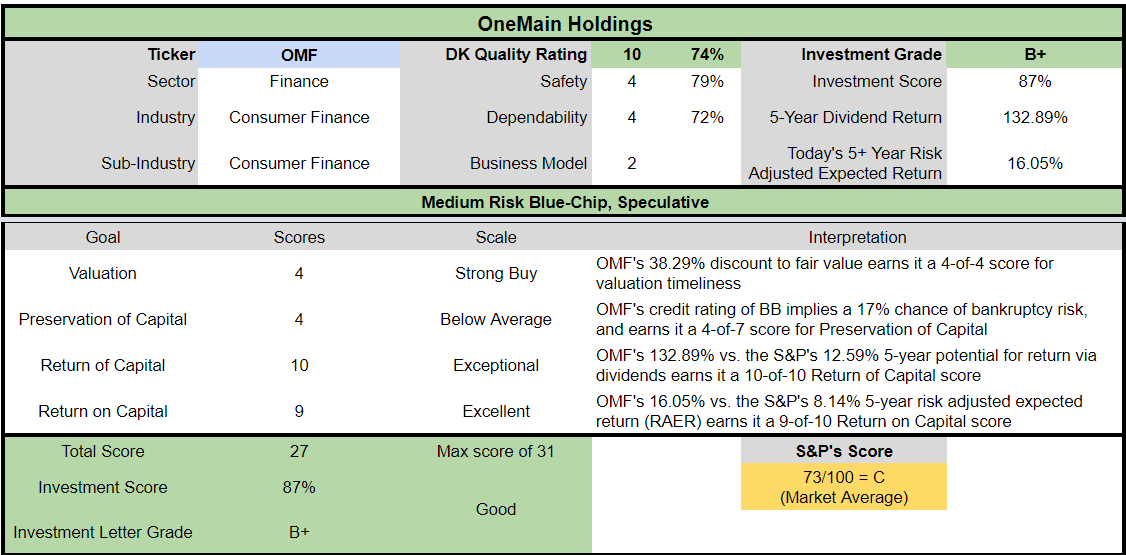
OMF is a potentially good speculative ultra-yield blue-chip option for anyone comfortable with its speculative risk profile.
- 38% discount to fair value Vs. 10% S&P = 28% better valuation
- 12.8% safe yield vs. 1.9% S&P (6.7X higher yield)
- 150% higher annual long-term return potential
- 2X higher risk-adjusted expected returns
- 10X the consensus 5-year income
LyondellBasell: This Petrochemical Giant Could Already Be Pricing In A Global Recession
Further Reading
Investment Thesis
LyondellBasell Industries NV is a petrochemical producer with operations in the U.S. and Europe. It operates in six segments: Olefins and Polyolefins-Americas (O&P-Americas), Olefins and Polyolefins-Europe, Asia, International (O&P-EAI), Intermediates and Derivatives (I&D), Advanced Polymer Solutions (APS), Refining and Technology. The company is a major producer of polyethylene, the world’s largest producer of polypropylene, and the second-largest producer of propylene oxide. Its chemicals are used in various consumer and industrial end products. Substantially, all of the company’s revenue is derived from product sales. – Morningstar
LYB is the 2nd largest petrochemical company on earth, headquartered in the UK for tax purposes (though technically a Dutch company).
- so no dividend tax withholdings
YCharts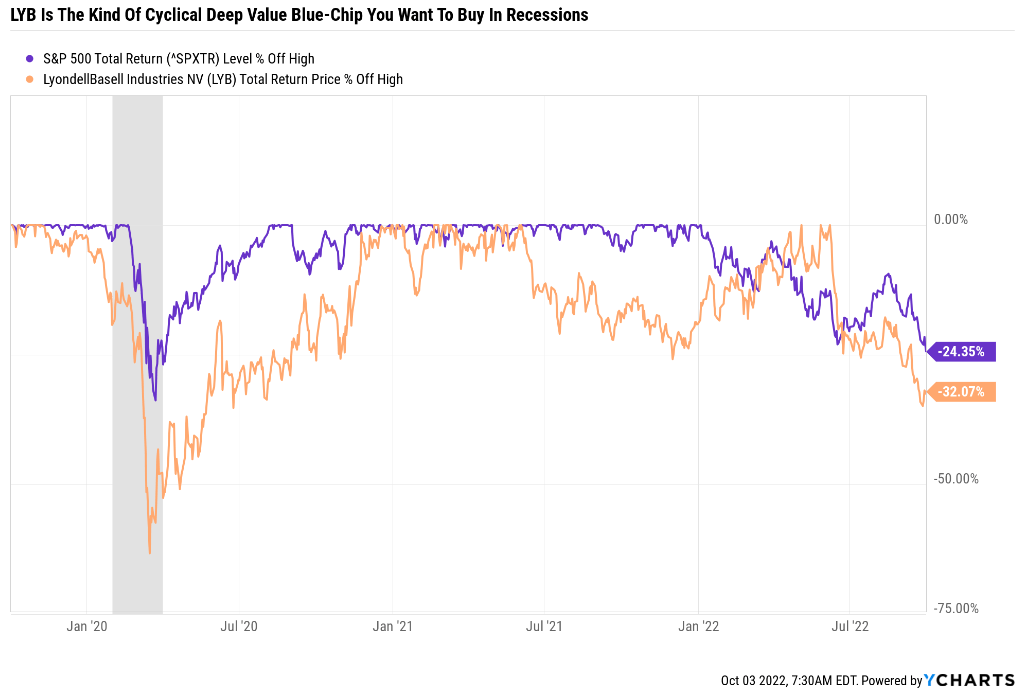
Is LYB a defensive blue-chip? No, it’s a highly cyclical business. One that tends to fall hard and fast in bear markets, and thus the bargain hunting opportunity today.
FactSet Research Terminal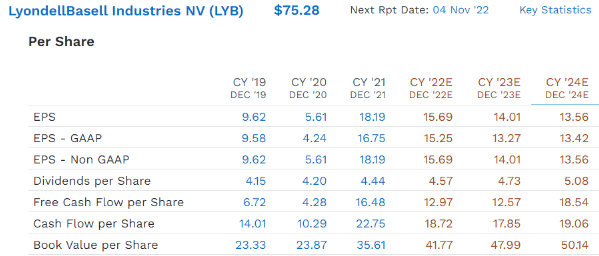
LYB’s earnings are expected to decline in the coming years, though its free cash flow is expected to grow modestly (due to cutting spending).
The generous 6.3% yield is well covered by free cash flow, with a peak FCF payout ratio of 37% expected in 2023.
- according to rating agencies 40% or less FCF payout ratio is considered safe for this industry
The dividend is expected to keep growing at a modest pace in the coming years, right through the global recession.
S&P rates LYB BBB stable, implying a 7.5% 30-year bankruptcy risk.
FactSet Research Terminal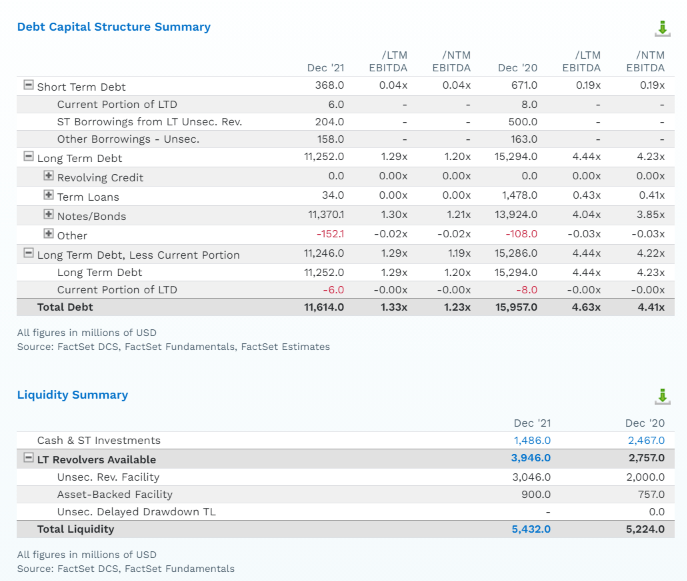
2.5X or less debt/EBITDA is considered safe for this industry according to rating agencies, and LYB’s leverage is 1.3X.
It has $5.4 billion in liquidity and well-staggered bond maturities.
FactSet Research Terminal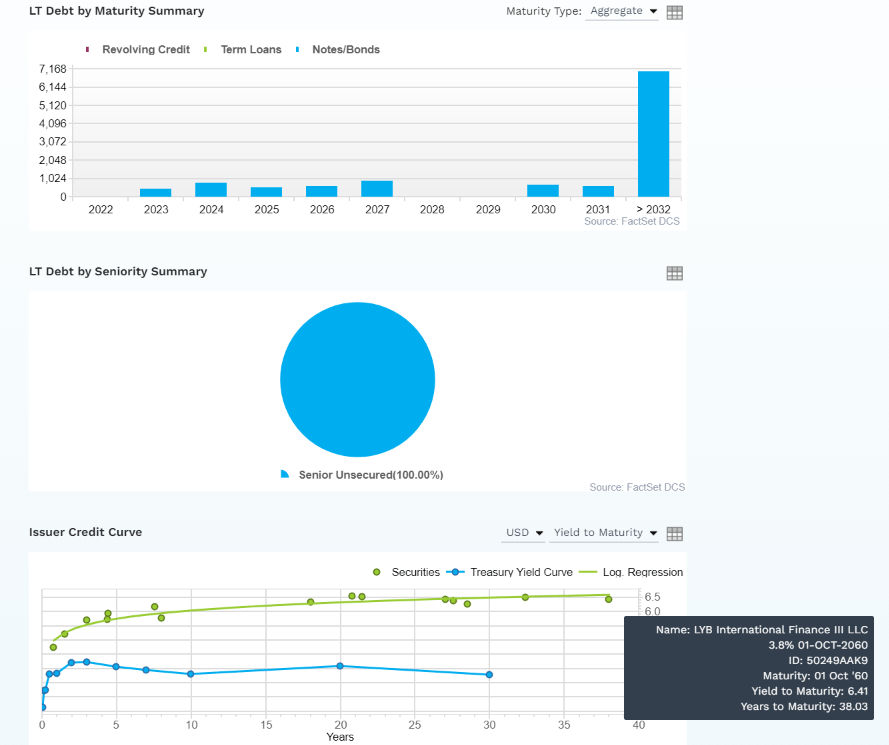
All of its debt is unsecured for maximum financial flexibility, and the bond market is willing to lend to them for almost 40 years at reasonable interest rates.
| Investment Strategy | Yield | LT Consensus Growth | LT Consensus Total Return Potential | Long-Term Risk-Adjusted Expected Return | Long-Term Inflation And Risk-Adjusted Expected Returns | Years To Double Your Inflation & Risk-Adjusted Wealth |
10-Year Inflation And Risk-Adjusted Expected Return |
| LyondellBasell Industries | 6.3% | 9.1% | 15.4% | 10.8% | 8.5% | 8.5 | 2.26 |
| Safe Midstream | 6.3% | 6.4% | 12.7% | 8.9% | 6.6% | 10.9 | 1.89 |
| REITs | 3.9% | 6.0% | 9.9% | 6.9% | 4.6% | 15.5 | 1.57 |
| Schwab US Dividend Equity ETF | 3.6% | 8.80% | 12.4% | 8.7% | 6.4% | 11.3 | 1.86 |
| Dividend Aristocrats | 2.8% | 8.7% | 11.5% | 8.1% | 5.8% | 12.5 | 1.75 |
| S&P 500 | 1.9% | 8.5% | 10.4% | 7.3% | 5.0% | 14.4 | 1.63 |
| Nasdaq | 0.9% | 11.8% | 12.7% | 8.9% | 6.6% | 10.9 | 1.89 |
(Source: DK Research Terminal, FactSet, Morningstar, YCharts)
LYB offers the potential for a yield that’s far higher than most other options, with growth potential superior to the S&P 500.
That means potentially long-term returns that can run circle’s around almost any popular investment strategy, including the Nasdaq.
FactSet Research Terminal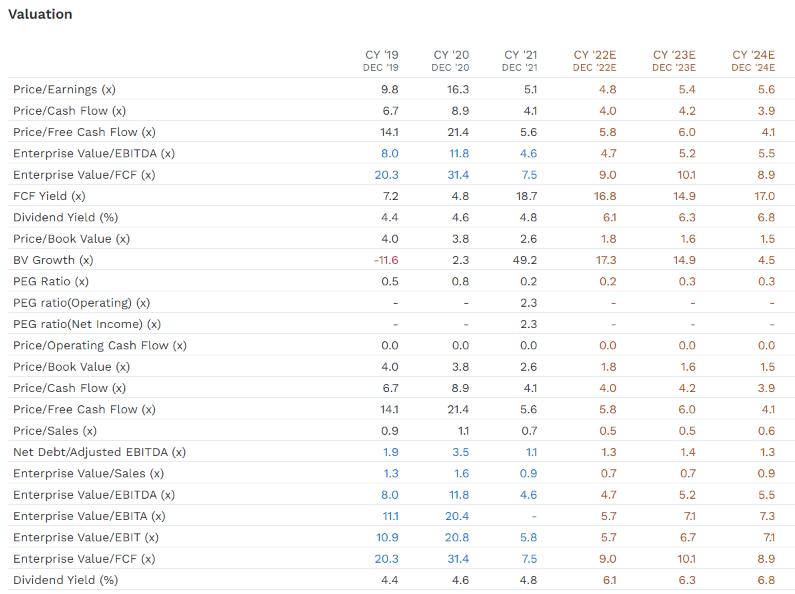
Using trough valuations, we can see that LYB is a screaming potential buy for anyone comfortable with its risk profile.
- 5.6X trough PE
- 5.5X trough cash-adjusted earnings
- 6X trough free cash flow
- a 2024 yield on today’s cost of 6.8%
LYB is an anti-bubble blue-chip priced for -5.8% CAGR growth that’s actually expected to grow 9.1%, according to analysts.
- 12.4% CAGR historical growth rate since 2010
LYB 2024 Consensus Total Return Potential
(Source: FAST Graphs, FactSet)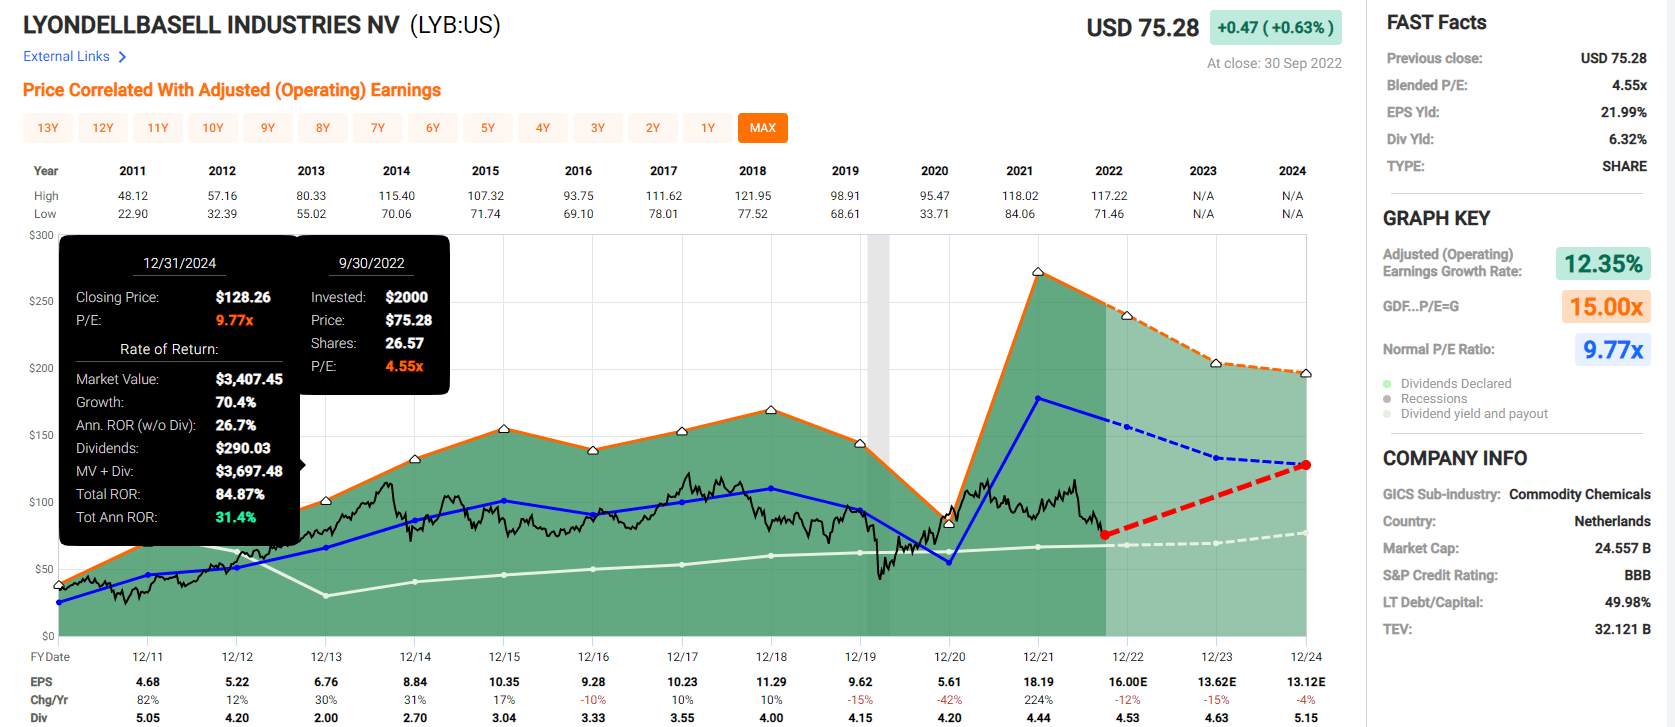
LYB could potentially almost double by 2024 and deliver Buffett-like 31% annual returns.
LYB 2027 Consensus Total Return Potential
(Source: FAST Graphs, FactSet)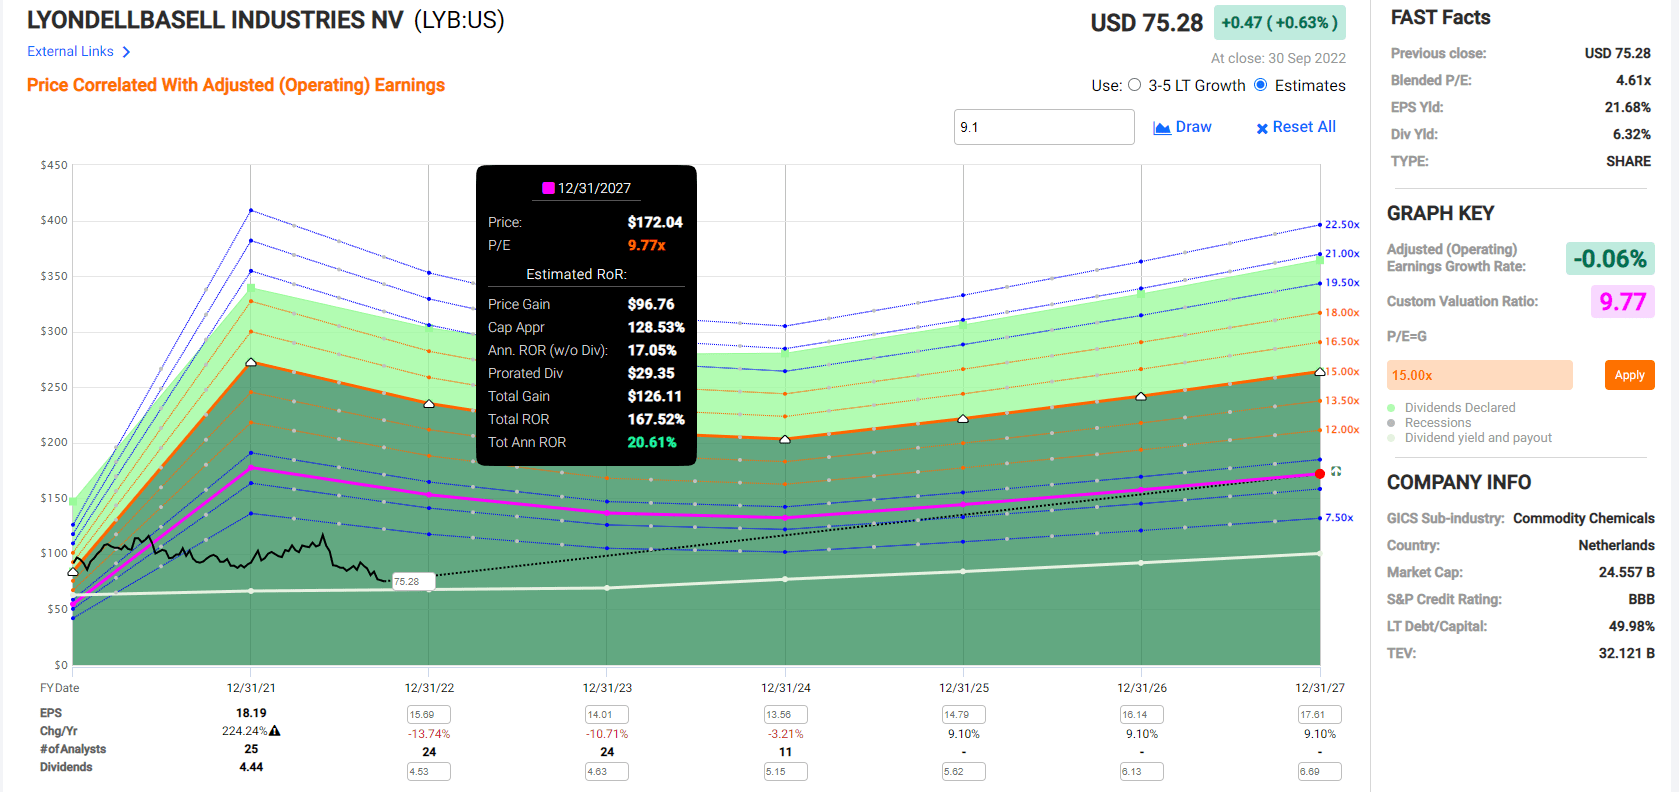
The global recession is expected to hurt LYB’s earnings hard enough that even after the recovery, analysts expect basically no earnings growth through 2027.
Yet it’s so undervalued that it could still deliver 168% total returns, or almost 21% annually, over the next five years.
That’s the power of deep value blue-chip investing in a bear market.
LYB Corp Investment Decision Tool
DK (Source: Dividend Kings Automated Investment Decision Tool)
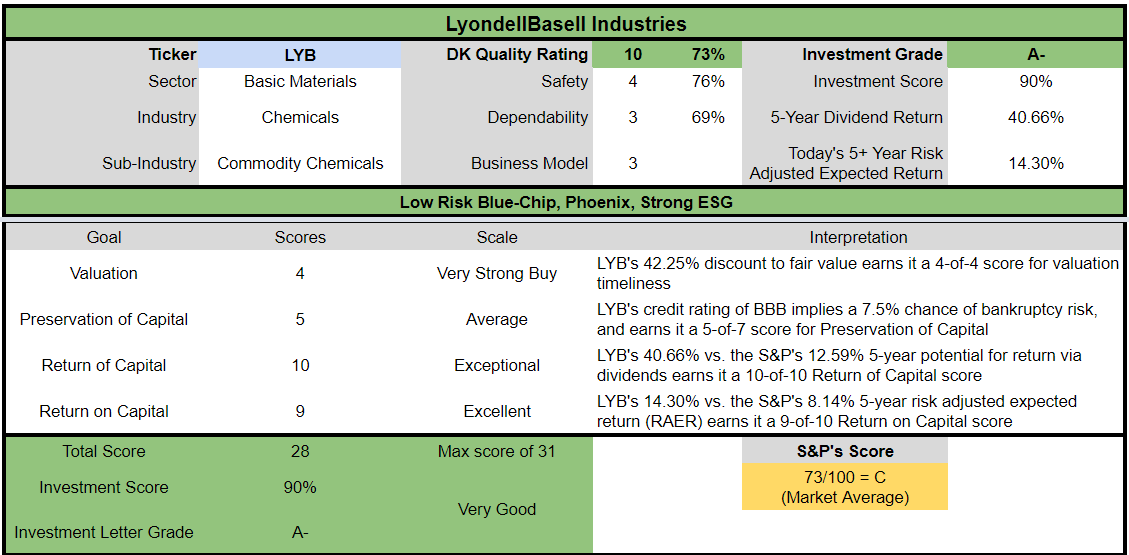
LYB is a potentially very good ultra-yield blue-chip option for anyone comfortable with its risk profile.
- 42% discount to fair value Vs. 10% S&P = 32% better valuation
- 6.3% safe yield vs. 1.9% S&P (3.3X higher yield)
- 50% higher annual long-term return potential
- 2X higher risk-adjusted expected returns
- 3.5X the consensus 5-year income
Bottom Line: These 2 High-Yield Blue-Chips Are Crazy, Stupid, Cheap
No one knows when the recession will arrive or if we’ll have a recession. All we have is various probabilities and scenarios. Smart investors are ready for anything.
- over 30+ years, 97% of stock returns are a function of pure fundamentals, not luck
- in the short-term; luck is 33X as powerful as fundamentals
- in the long-term, fundamentals are 33X as powerful as luck
So why I can’t tell you whether OMF or LYB have bottomed yet, what I can tell you is for any high-yield investor comfortable with their risk profiles, they are screaming bargains today.
- 12.8% safe yield in speculative OMF growing at 12%
- 6.3% safe yield in BBB-rated LYB growing at 9.1%
Both are currently pricing in negative growth, anti-bubble blue-chip bargains that could literally deliver 20% to 26% Buffett-like annual returns over the next five years. And through 2024? Annual returns as high as 40% are on offer.
That’s what happens when you buy blue-chips at 4X to 5.5X trough earnings, with margins of safety that are so high, it doesn’t even matter how fast they grow in the coming years.
The nature of anti-bubble stocks is that you are paying such a low valuation that as long as they grow faster than 0% long-term, it’s not possible to lose money.
- Assuming you avoid becoming a forced seller for emotional or financial reasons
So for anyone looking for ultra-yield, combined with strong growth, and a crazy, stupid, cheap valuation, OMF and LYB are two solid names worth considering.
Be the first to comment