

da-kuk/iStock via Getty Images
Written by Nick Ackerman, co-produced by Stanford Chemist. This article was originally published to members of the CEF/ETF Income Laboratory on March 20th, 2022.
RiverNorth Flexible Municipal Income Fund (NYSE:RFM) is an offering from RiverNorth that has a more unique approach than most other municipal bond-focused funds. In this case, their strategy is to manage the portfolio with a tactical weighting depending on the environment. RiverNorth manages the municipal closed-end fund sleeve of the portfolio. MacKay Shields takes over the other sleeve of individual muni bond holdings.
RiverNorth often has a fund of fund approach to many of their investments. They aren’t necessarily activists, in my opinion. They are more like accomplices to activist activities. Saba and Bulldog are notable activists in the CEF space. RiverNorth often isn’t too far behind when they start accumulating a position.
MacKay Shields was founded in 1938 and had $164 billion in managed funds. They have a “boutique approach” to “utilize their own philosophy, processes and expertise to add value across capital markets while supported by a single operating platform.”
I’m not very familiar with them, but they seem to operate investment strategies across muni investments, high yield, equity, convertible and everything in between.
RFM Strategic Weightings (RiverNorth)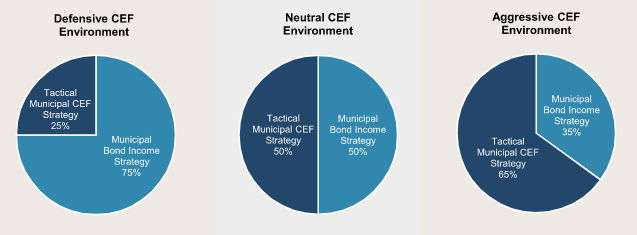
Muni bonds and funds are longer-duration assets, and they have been getting hit lately as interest rates are expected to go higher. In fact, we recently received our first-rate hike in several years when the Fed announced last Wednesday. They also announced that they might raise more aggressively than they first believed. That should continue to keep pressure on muni investments.
However, for a longer-term investor, it isn’t all bad news. Valuations are now better than they were several months ago, even with the risk that they could continue to remain pressured. For RFM, the discount has widened out over the last six months or so. Eventually, it could mean higher yields too for shareholders. If one believes that rates will be high enough, for long enough, as they turn over their portfolio to potentially higher-yielding muni offerings.
The Basics
- 1-Year Z-score: -1.31
- Discount: 6.59%
- Distribution Yield: 6.66%
- Expense Ratio: 2.06%
- Leverage: 35%
- Managed Assets: $192.8 million
- Structure: Term (anticipated liquidation date on March 26th, 2035)
RFM’s objective is to “provide current income exempt from regular U.S. federal income taxes with a secondary objective of total return.” They do this by investing in a hybrid approach with MacKay, as we touched on above. RiverNorth selects municipal CEFs to invest in. MacKay operates the individual muni selection sleeve of the portfolio.
The fund is relatively small, with less than $200 million in assets. That’s with a high amount of leverage being employed on top of it as well. This can cause issues for larger investors if they want to get out of the fund quickly. However, the leverage itself isn’t unexpected as they invest in what should be some of the safest assets to invest in. We have to consider here that when they are holding other CEFs, though, they are also leveraged. So one is getting leverage on leverage in some cases.
When holding other CEFs, that also means fees on fees. The fund’s expense ratio comes to a lofty 2.06%, which increases to 2.39% if we include the leverage expenses. Their leverage expenses will also increase as rates rise due to being floating rates.
With expenses being so high, I think it could be pretty challenging to achieve attractive returns. The underlying assets themselves aren’t yielding much since they are munis. The net investment income ratio to average net assets comes to just 2.72%. It would seem that they will be relying on gains from CEFs to provide returns potentially.
The fund has a term structure and should terminate around March 26th, 2035. However, this fund also leaves the usual chance to switch to a perpetual structure. This is through the standard terms of having a tender offer for 100% of outstanding shares at 100% of NAV. If the fund still has $100 million in total net assets after such an offering, it may terminate its term structure.
Performance – Strong Start, Weaker Lately
When the fund first launched, it was during March 2020. Just about anything, they invested in would have paid off significantly. That played out, and now the gains are going to be much harder to come by. Although, it isn’t all bad news as some of the “declines” if we just look at a chart came from an abnormally large year-end special. At the end of 2021, they paid out $1.0488 on top of their regular distributions throughout the year.
That’s why the below would show that the total returns have been materially stronger over the last six months relative to price and NAV levels alone. We see in the chart below that the purple line is the total price return, orange is the total NAV return. That is accounting for if the distribution was reinvested.
The blue line is the price change only, and the green is the NAV only.
Ycharts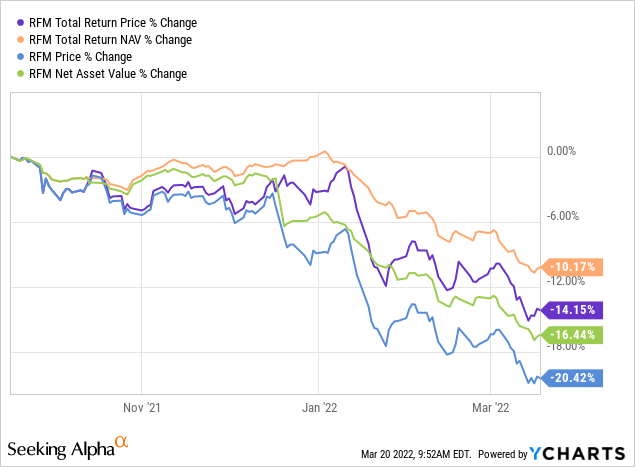
We can also see how much the share price has fallen relative to the NAV in these charts. That creates an opportunity for CEFs. They enjoyed another thing in their fund, tightening discounts across the board in the CEF space. Some of that is unraveling now, so we are getting discounts on discounts. It can make the fees on fees a bit more tolerable if they select the right funds and can capitalize on discount contractions.
Below is the discount of the fund over the last six months.
Ycharts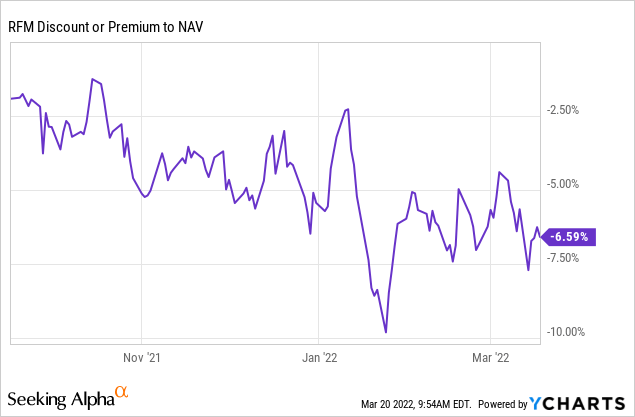
However, this hasn’t been the only time this fund has traded at a wider discount. Throughout most of 2020, shortly after they launched, the fund traded at quite a substantial discount. If we take a look at a chart of the fund’s discount going back to its launch, we can get a better idea of where this fund has traded historically. A shorter history gives us less context but can still be helpful.
Ycharts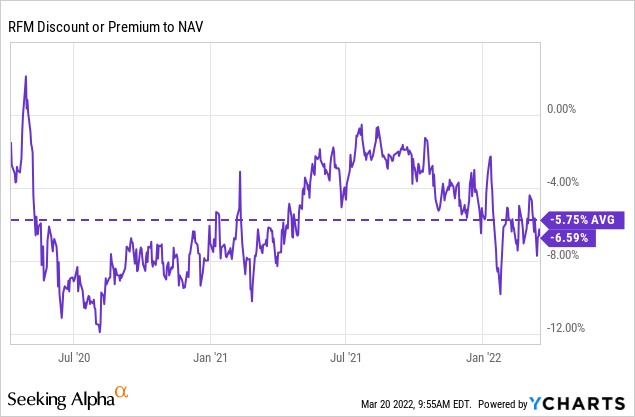
Distribution – Large Year-End Special
As we touched on above, the fund had a sizeable year-end special. After that special, they had bumped up the monthly distribution to $0.1062 from $0.1042. Even after all this, the fund is still trading above its IPO NAV price as they were able to participate in all of those gains from a rebounding market.
The fund has a 5.50% annual distribution rate that they target. It is calculated by the final trading day of the preceding calendar year. That’s why investors received a slight bump up in the distribution. After the latest declines, if it were recalculated at today’s NAV, the distribution would be adjusted to $0.0939 per month.
RFM Distribution History (CEFConnect)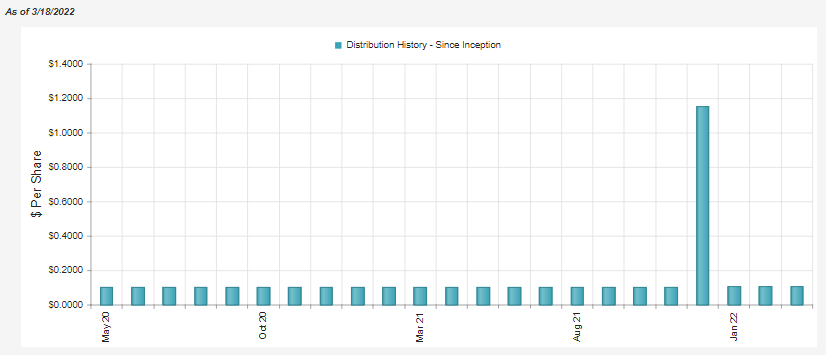
At the current level, the distribution rate works out to 6.66% for shareholders. It works out to 6.22% on a NAV basis, which is why a trim would happen if it were calculated today. I don’t mind the managed distribution plans, though. In fact, I’m starting to warm up to them more as it adds predictability. Even if it means it gets adjusted annually.
Looking at the last available report, the Semi-Annual Report, we can see that NII coverage is quite low. This makes sense as the fund’s higher expense ratio will consume a meaningful portion of the total investment income. For example, from this report, they showed TII of $3,576,542 – the expenses for the fund came to $1,788,518. Interestingly enough, that works out to about half of the fund’s income. We see NII come in where we do in the snapshot below.
RFM Annual Report (RiverNorth)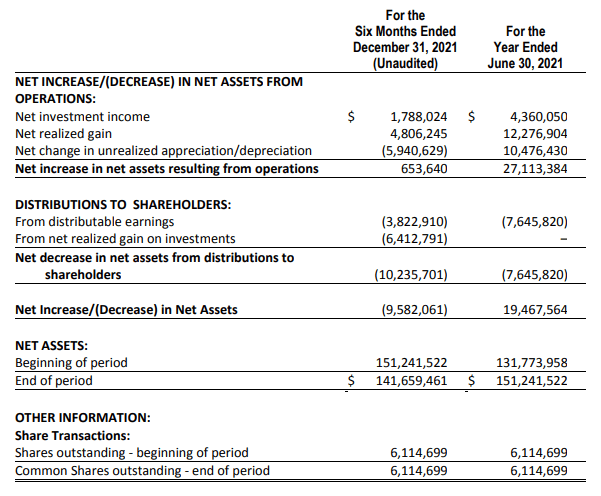
This is why it is crucial that this fund is successfully managing its portfolio for gains, despite being a muni fund. That being said, the year-end distribution is also being lumped into the total distributions to shareholders. Therefore, NII coverage could improve over the next year if NII stays flat and makes the presumption that they don’t pay another year-end.
For tax purposes, a large portion is classified as exempt-interest dividends (tax-free.) That is mostly what we would expect. However, an even more significant portion of the distribution was non-qualified dividends. From my assumption here, I would have to believe that this is due to a lot of short-term capital gains in the fund.
That indicates that it is probably NOT appropriate for a taxable account, despite being a muni fund.
RFM Tax Classifications (RiverNorth)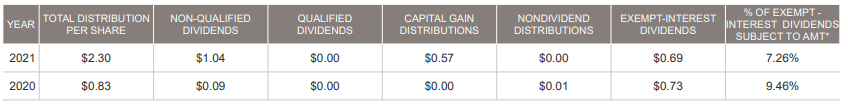
RFM’s Portfolio
The portfolio’s turnover for the last six months was 20%. In the previous fiscal year, it came to 37%. So they aren’t overly active, in my opinion. They estimate that the hedged duration for their portfolio is 6.3 years. They estimate that the unhedged duration would come to 8.91 years. That is quite substantial, but for a muni-focused fund isn’t all that surprising.
This indicates that for every 1% in interest rate change, the fund’s underlying holdings should decline between 6.3% and 8.91%. If rates are bumped up to 2%, as some suggest over the next twelve months, that could indicate further losses are coming.
The latest strategy weightings come in with MacKay managing the bulk of the fund at this time. According to their breakdowns at the start of the article, that would indicate that they are between the defensive CEF environment and neutral CEF environment. That would seem to be an appropriate place to be, given the volatility we have seen more broadly in the markets. The weightings were as of January 31st, 2022.
RFM Strategy Weights (RiverNorth)
From their last Fact Sheet available, we can see that their portfolio hadn’t changed too dramatically since we covered the fund. The below is from the end of December 2021.
RFM Portfolio Detail (RiverNorth)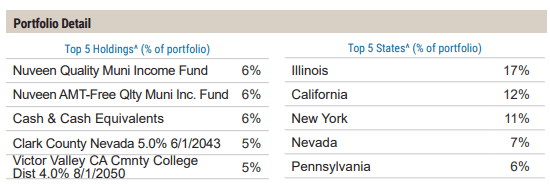
Illinois and California exposure come in as the largest allocations. New York exposure has bumped up from the previous 8% weighting it had previously.
Nuveen Quality Muni Income Fund (NAD) and Nuveen AMT-Free Quality Muni Income Fund (NEA) still make up the two most significant positions but have flipped places. Their weightings are so close that any small moves could make this happen. Additionally, “cash and cash equivalents” is the third-largest position as it was last time as well.
For NAD and NEA, we see a similar trajectory in their total returns over the last six months.
Ycharts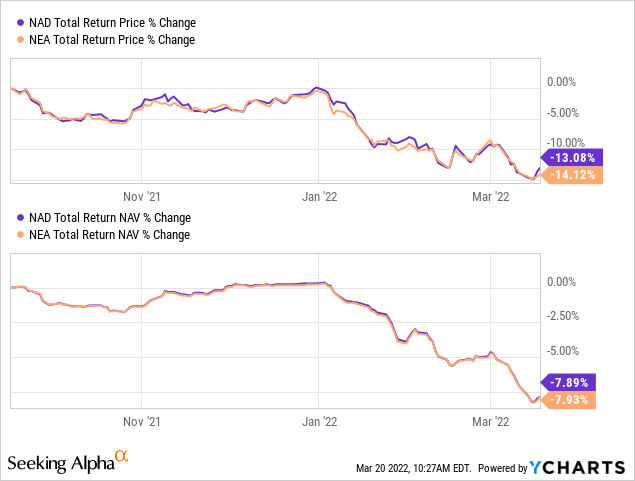
Similarly, the takeaway from above is that their underlying discounts are also expanding quite materially as well over this same period.
Ycharts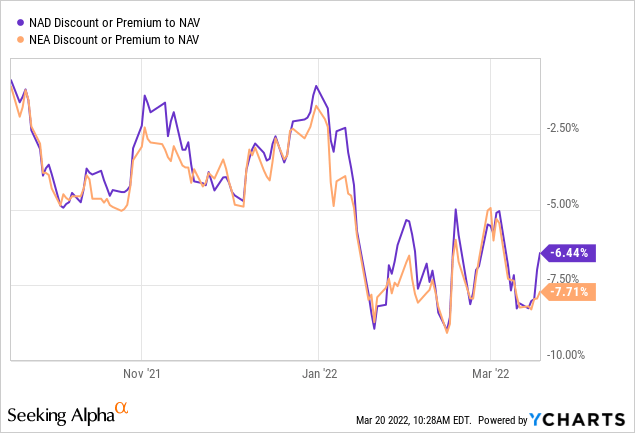
NAD has effective leverage of 38.97% and comes in at roughly $5.645 billion in total managed assets, according to CEFConnect. NEA would also be considered quite large in the CEF space, it comes in with total managed assets of over $7.084 billion. A significant portion of this is through leverage with effective leverage of 39.39%. That’s where leverage at first might not seem so bad for RFM due to underlying holdings being safer. This leverage on leverage compounding can be more meaningful the more they allocate to CEFs.
Conclusion
Municipal bonds have been taking a massive hit lately as they are often longer-duration assets due to long maturities. That has translated into poor muni CEF performances over the last six months to a year. With rates expected to continue to rise, they will remain under pressure. However, it doesn’t hurt to start looking in the sector for better values than what we had a few months ago. On top of this, with CEFs, you are also getting widening discounts which can often present opportunities.
As for RFM specifically, I’m not so sure it is a great fit. The idea behind a muni fund would be targeting tax-free income; at least, I believe that would be the number one reason to own one. However, for RFM, it doesn’t seem that they will consistently deliver that – as is the case with their sister funds that are similar too. That includes RiverNorth Managed Duration Municipal Income Fund (RMM) and RiverNorth Flexible Municipal Income Fund II (RFMZ), just to name a couple.
If you want an actively managed portfolio and believe that RiverNorth and MacKay can deliver results despite their higher expenses, that is a different story. Then this possibly could be a good fit for those types of investors. With the CEF sleeve, you get discounts on discounts, leverage on leverage and fees on fees. These are all things to be aware of before investing in this type of fund.
Be the first to comment