

olaser/E+ via Getty Images
Thesis
My current proposition is that The Hackett Group (NASDAQ:HCKT) currently presents as a long-term value position for investors who want to broaden their portfolios into the consulting industry as it is trading near its fair value including a reasonable margin of safety. I also theorize that Accenture PLC (NYSE:ACN) is a tremendous historical performer but is currently trading at excessive market prices for indeterminate reasons which poses as a risk for long term investors looking to establish a position. I theorize that short-term economic pressures will correct over-valuations and my analysis leads to developing a long position in HCKT and shorting ACN.
Introduction
ACN and HCKT are both global consulting firms that offer a wide variety of services to their customers. ACN currently trades around a market capitalization of $180 billion which dwarfs over the HCKT market capitalization of approximately $600 million. The analysis performed in this article is utilized to help highlight certain trends and derive input variables for multiple valuation methods. I deduce through this analysis that both companies are good firms based on the metrics discussed, and that an overvaluation has taken place for ACN while the market is presenting an opportunity for HCKT.
Industry Overview
The global consulting market is directly correlated to the developments of the global economy. The consulting service market is expected to grow at a CAGR of 4.3% through 2026 while certain sub-niches are estimated to grow at faster rates. North America is established as the current largest market while Asia possess the largest growth rate potential. The main drivers of global consulting include factors such as globalization and new business model development augmented by evolving technology. Organizations typically have higher revenues during economic growth and can afford to spend more on consulting firms. During economic downturns, organizations typically contract their spending which would place pressure on consulting firms’ revenue growth. Consulting firms attempt to mitigate their variance in revenue by offering services and products that become integrated into the function of their clients. They also attempt to incorporate technology and leaner business practices to improve their margins. The current recession fears, high inflation environment, and high interest rates may put pressure on consulting industry clients which could affect consulting firms’ revenue exposing weaknesses across the industry. These pressures may present purchase opportunities to establish long-term positions at reasonable valuations and instill short term fear on the stock price of overvalued companies in the industry throughout 2022 and 2023.
Methodology
The goal of this analysis is to determine the valuation of each firm. A graphical observation approach using JMP software and historical data was utilized to analyze trends in each firm. The analysis will be broken into multiple components to gain an understanding of significant trends augmented by relevant statistics. Observing the graphical representations can highlight discrepancies and provide insights that are useful for investors to understand relationships. The trends can then be utilized to derive inputs for the valuation models.
The variables this analysis primarily focuses on are revenue, free cash flow (FCF), return on equity (ROE), price to earnings ratios (P/E), revenue growth rates, free cash flow margins, and stock price .The formulas utilized for desired variables are derived by performing linear regression models through the software JMP.
Statistically, we are looking for higher r2 values and significant p values less than 0.05. The r2 is known as the coefficient of determination which measures how well a statistical model predicts an outcome on a scale of 0 to 1. The higher values closer to one signifies a more predictable outcome. The p value is the probability value and represents the likelihood of a data point resulting from randomness. Having a lower p value represents data results that are significant and less likely occurring from random chance. A p value less than 0.05 and an r2 value closer to 1 are sought to analyze significant historical trends.
When observing the graphical representations in this article, the dark line is the trend mean, the dark faded coloring represents one standard deviation, and the lighter faded outer colored line represents two standard deviations. The data points may lie at different distances from the mean representing variances from the trend. The standard deviation is the value of how far away from the mean a data point is located.
Analyzing ACN
Quarterly Revenue Growth, ROE, P/E ratio, and Quarterly Revenue Growth Rates
The quarterly revenue has increased with a small variance over the past 50 quarters (blue line, r2 = 0.911, p < 0.05). The ROE for ACN has shown a consistent decrease over the same period (red line, r2 = 0.749, p < 0.05). The P/E ratio has shown a consistent increase from ~ 10 to 30 over the same period (green line, r2 = 0.854, p < 0.05). The quarterly revenue growth rate has shown inconsistent trends over the same period which could be attributed to a wide variety of random variables that affect the firm’s overall growth rate (purple line, r2 = .008, p = 0.5498 > 0.05).
Quarterly revenue growth, ROE, P/E ratio, and quarterly revenue growth rates (Author)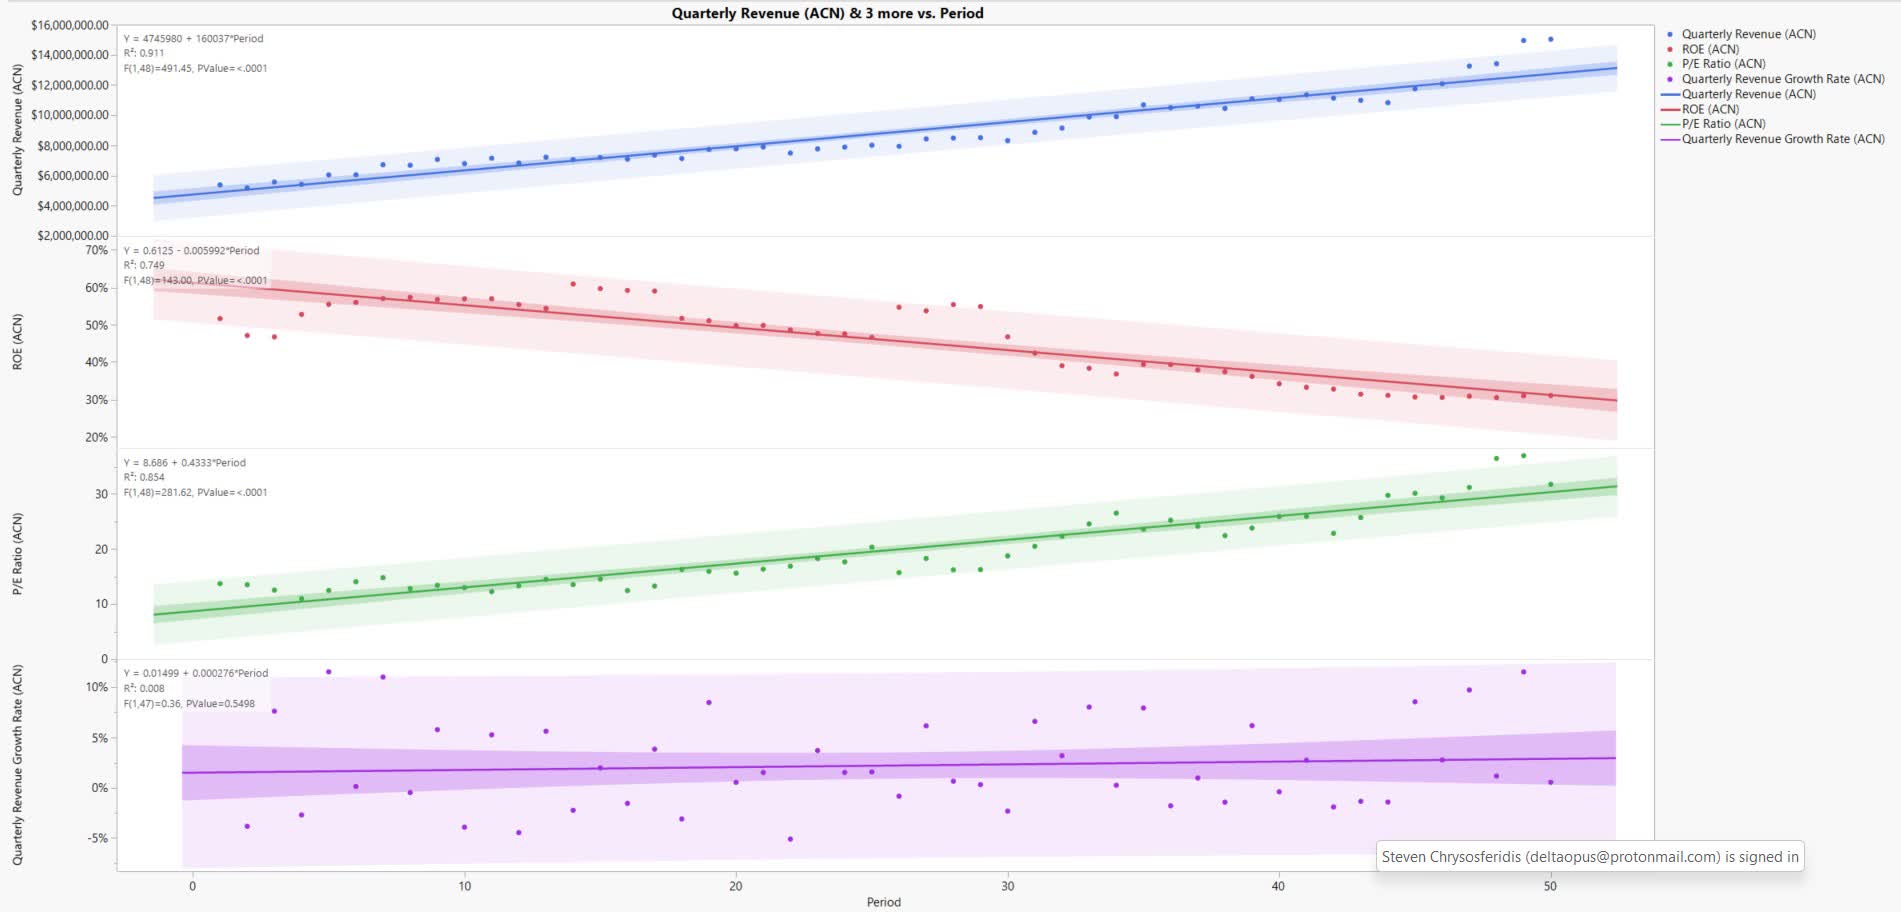
This data suggests that ACN had very predictable revenue over the past fifty quarters. They have historically been able to continue to increase their revenue stream. ACN has shown a trending decrease in profitability (ROE) and inconsistent revenue growth rates over that same period. This suggests ACN is becoming less efficient on their return for investors and lack a consistent revenue growth rate. It is important to note that a consistent revenue increase does not necessarily mean that the growth is at a consistent rate of change.
The common mantra of paying a premium for growth is contradictory for ACN. A decrease in return performance should lead to a stable or decreasing P/E since investors theoretically should not be willing to pay a higher price for a decreasing ROE. Investors also should not be willing to pay a premium for a firm that has inconsistent growth rates since it lacks predictability. This suggests that there are other variables that are swaying investors decisions into purchasing ACN shares at a higher premium in contradiction to their decreasing ROE and quarterly revenue growth inconsistencies.
Annual Revenue, Annual Free Cash Flow, and Annual Free Cash Flow Margins
The annual revenue, free cash flow, and free cashflow margins for ACN show statistically significant positive changes over annualized time-periods. This is ideal for investors because it allows for predicting the valuation of a company with a higher degree of confidence.
The annual revenue shows a strong trend over annualized periods that will be extrapolated for revenue inputs into the Discounted Cash Flow (DCF) model (blue line, r2 = 0.956, P < 0.05). Annual revenue can be extrapolated with the formula solving for revenue = 1.214X10⁷ + 1981416 x Period, with the period starting at 18 and being annualized from the year 2022.
Annual free cash flow also shows a strong trend over annualized period (red line, r2 = 0.823, p < 0.05). Free cash flow can be extrapolated with the formula for free cash flow = 884107 + 341809 * Period, with the period starting at 18 from the year 2022.
The free cash flow margin represents the ratio of revenue that produces free cash flow (green line, r2 = 0.310, p = 0.0202 < 0.05). ACN typically has a free cash flow margin ranging from ~ 10% to 17%. There is a slightly positive observable trend in the annual free cash flow margin over time. Observably, the last two time periods (years) were higher rates which could potentially represent an improvement in the firm’s ability to produce free cash flow.
Annual revenue, annual free cash flow, and annual free cash flow margins (Author)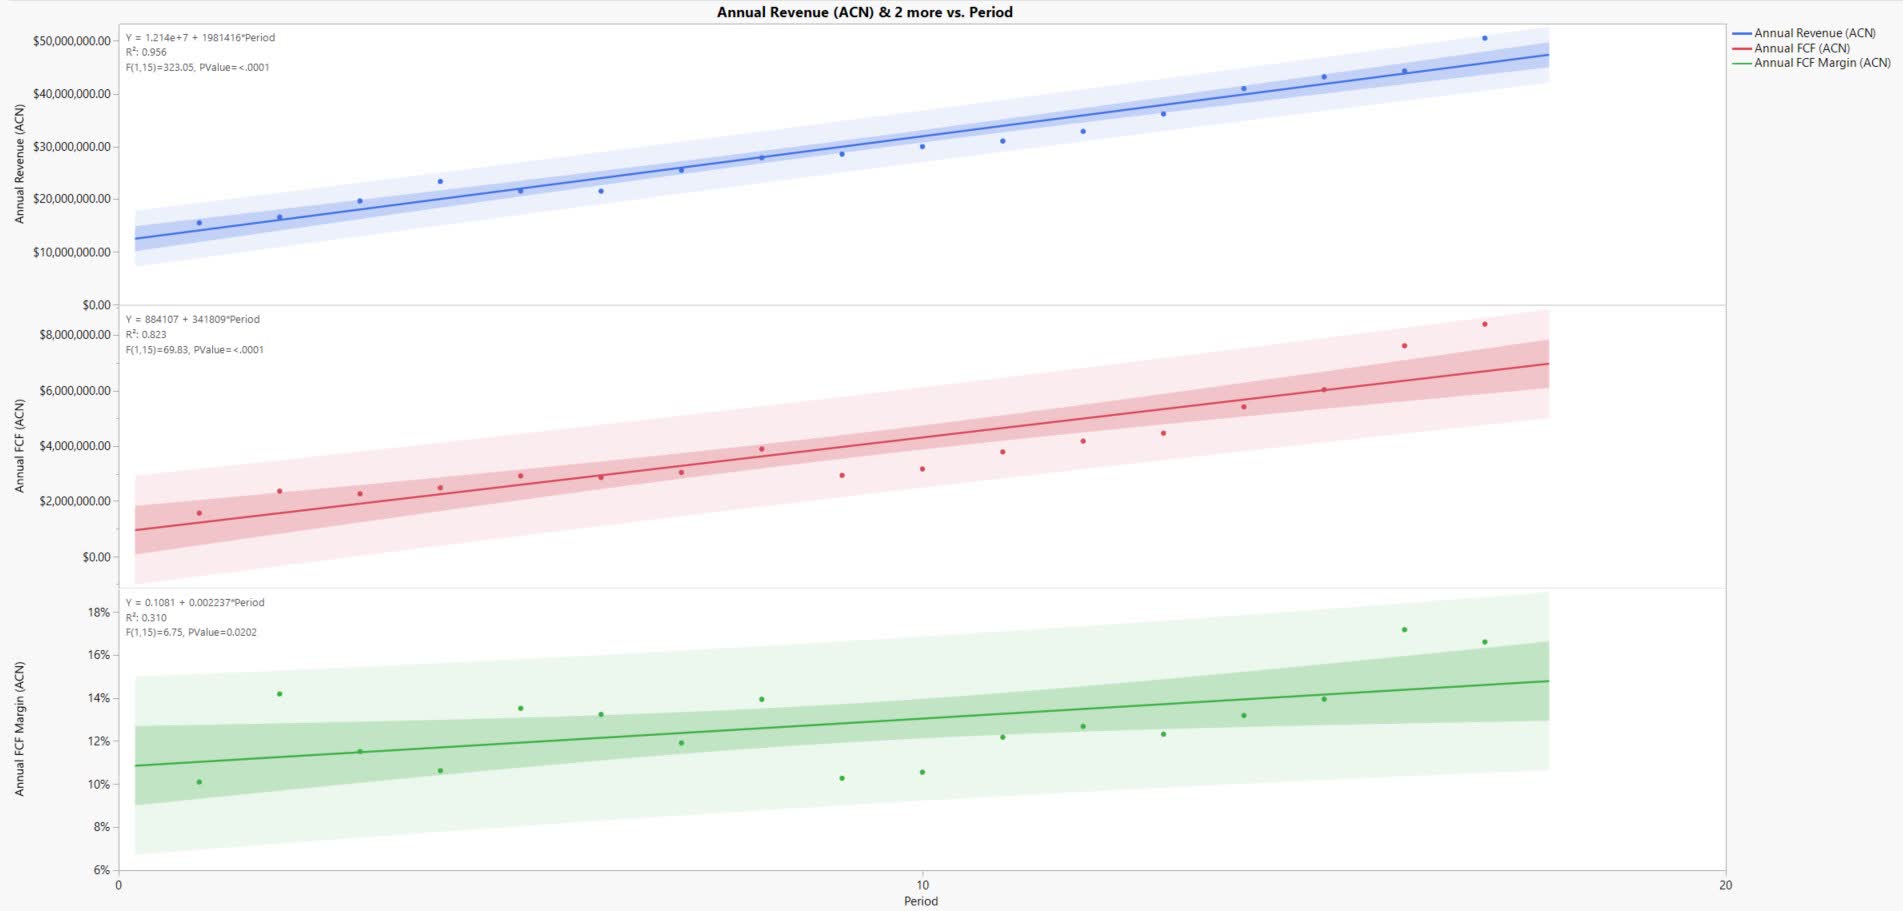
Analyzing HCKT
Quarterly Revenue Growth, ROE, P/E ratio, Quarterly Revenue Growth Rates
The quarterly revenue has grown with more variance over the past 50 quarters compared to ACN (blue line, r2 = 0.726, p < 0.05) but still shows a significant trend. The ROE for HCKT has shown a larger variance and trending growth over the same period as well (red line, r2 = 0.130, p = .0109 < 0.05). Since the r2 value is low, it is likely that HCKT’s ROE may be more unpredictable in the future. The P/E ratio has shown a steadier range that is unpredictable with a few large variances over the same period (green line, r2 = 0.193, p = .0016 < 0.05). The quarterly revenue growth has shown inconsistent trends over the same period which could be attributed to a wide variety of random variables that affect the firm’s overall growth rate (purple line, r2 = .001, p > 0.05).
Quarterly revenue growth, ROE, P/E ratio, and quarterly revenue growth rate (Author)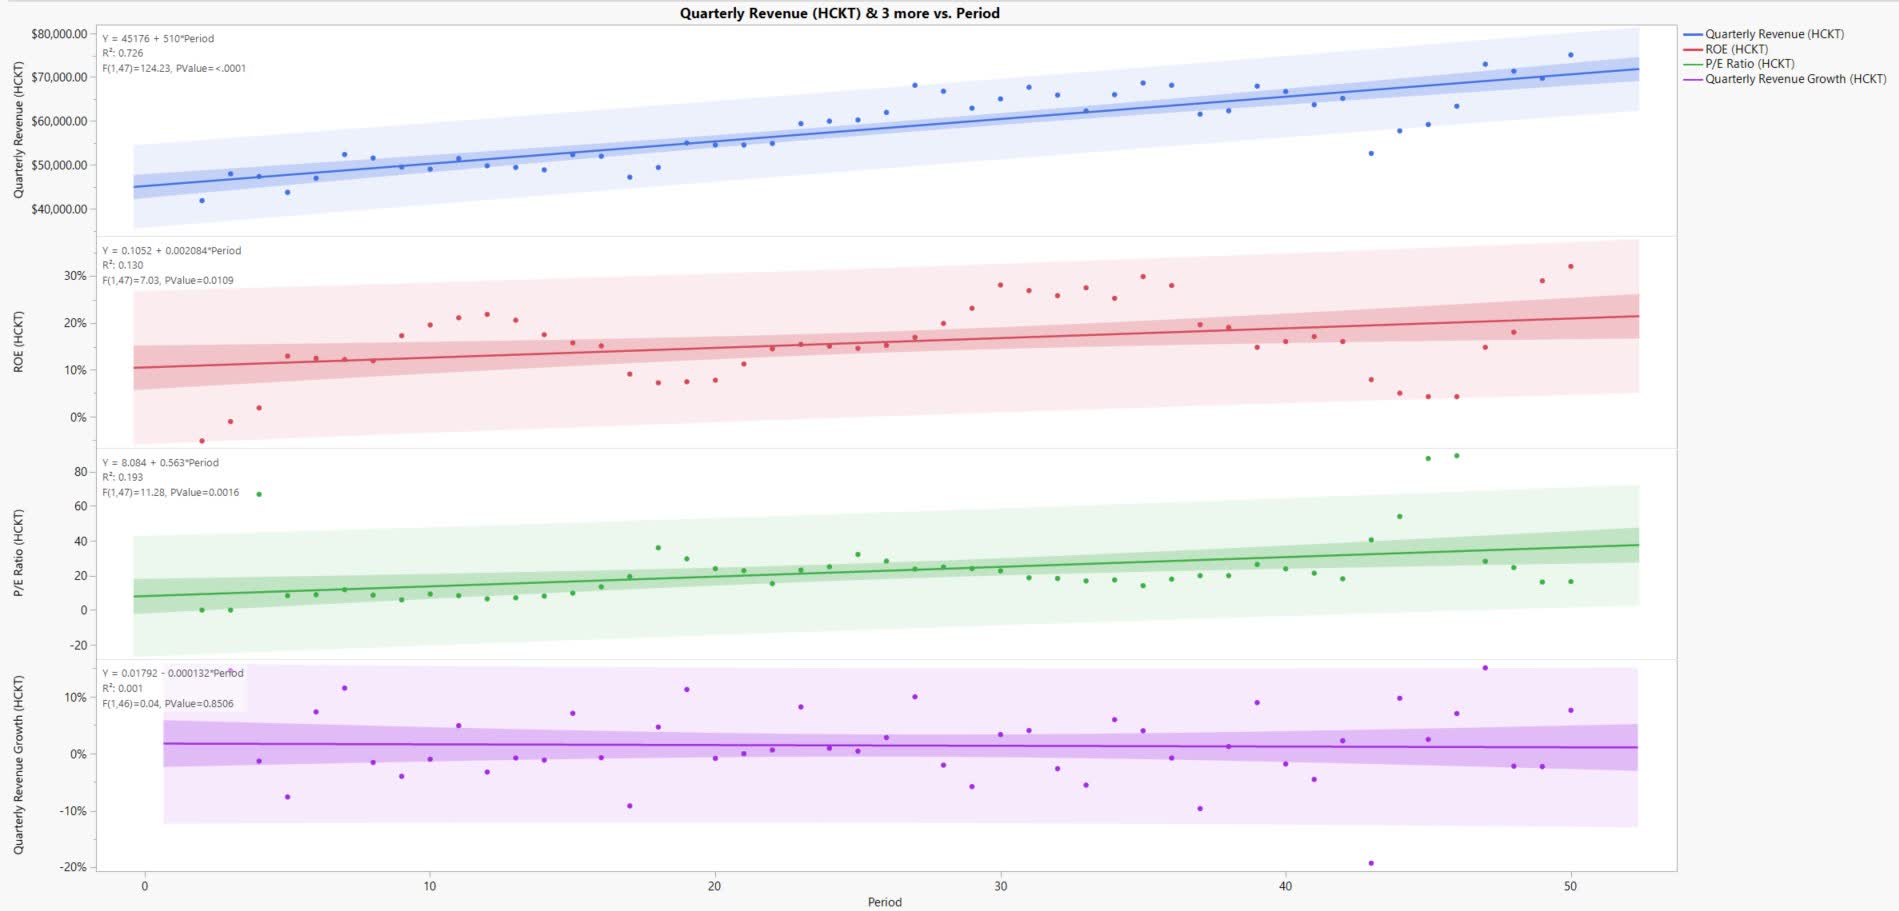
HCKT has had predictable revenue growth over the past fifty quarters while demonstrating a less consistent ROE though it does have acceptable ranges for investors. The P/E ratio had multiple high outliers that may correlate with the multiple low ROE quarters. These outliers affected the P/E trend and might demonstrate how quarters of poor earnings highlight variables that affect investors decisions and the stock price of a firm. The quarterly growth revenue demonstrates a non-linear or inconsistent growth rate which may be affected by a variety of factors such as cyclicality or macro-economic conditions.
Annual Revenue, Annual Free Cash Flow, and Annual Free Cash Flow Margins
The annual revenue shows a strong trend with a significant high coefficient of determination (blue line, r2=0.872, p < 0.05). Annual revenue can be extrapolated with the formula solving for revenue = 123116+ 8458 * Period, with the period starting at 18 and being annualized for the year 2022 onwards.
Annual free cash flow also shows a medium trend over annualized period (red line, r2 = 0.591, p < 0.05). Annual free cash flow can be extrapolated with the formula solving for free cash flow = -487.7 + 2152 * Period, with the period starting at 18 for the year 2022 onwards. The annual free cash flow shows a moderate coefficient of determination and statistical significance.
The free cash flow margin represents the ratio of revenue that produces free cash flow (green line, r2 = 0.302, p = .0224 < .05). HCKT has a larger variance in their free cash flow margin ranging historically from ~3% to 18% in comparison to ACN. There is a slightly positive observable trend in the annual free cash flow margin over time. Observably, HCKT does seem to be slowly improving their ability to produce free cash flow.
Annual revenue, annual free cash flow, and annual free cash flow margins (Author)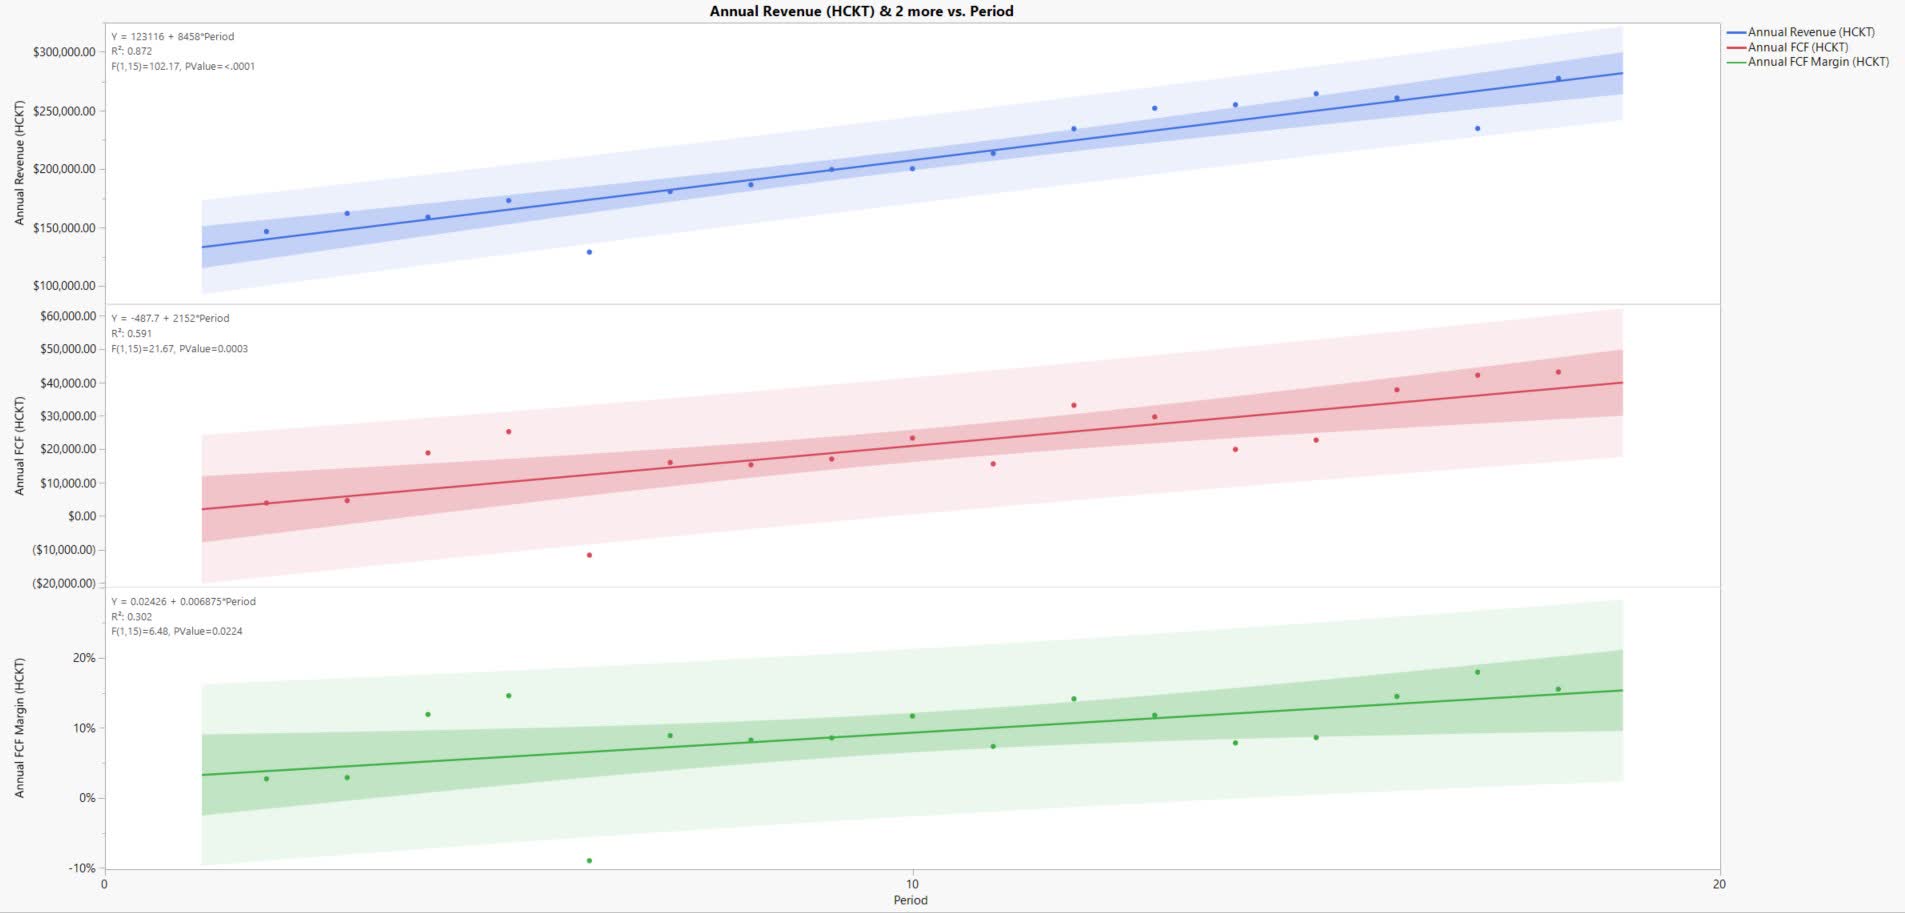
Valuation
Valuation will be derived utilizing two methods for determining value.
- Price Extrapolation: extrapolating forward price estimates based on historical data.
- Discounted Cash Flow Model. Extrapolating revenue and free cash flow inputs from the graphical analysis and determining an appropriate discount rate.
Price Extrapolation Valuation Method
The following valuation method attempts to extrapolate the next quarter price from historical price data collected over the past fifty quarters. As demonstrated earlier, ACN (r2 = 0.855, p < 0.05) has had less price movement and price variance than HCKT (r2 = 0.831, p < 0.05) though both show positive trends that are significant.
Price extrapolation for historical quarterly prices (Author)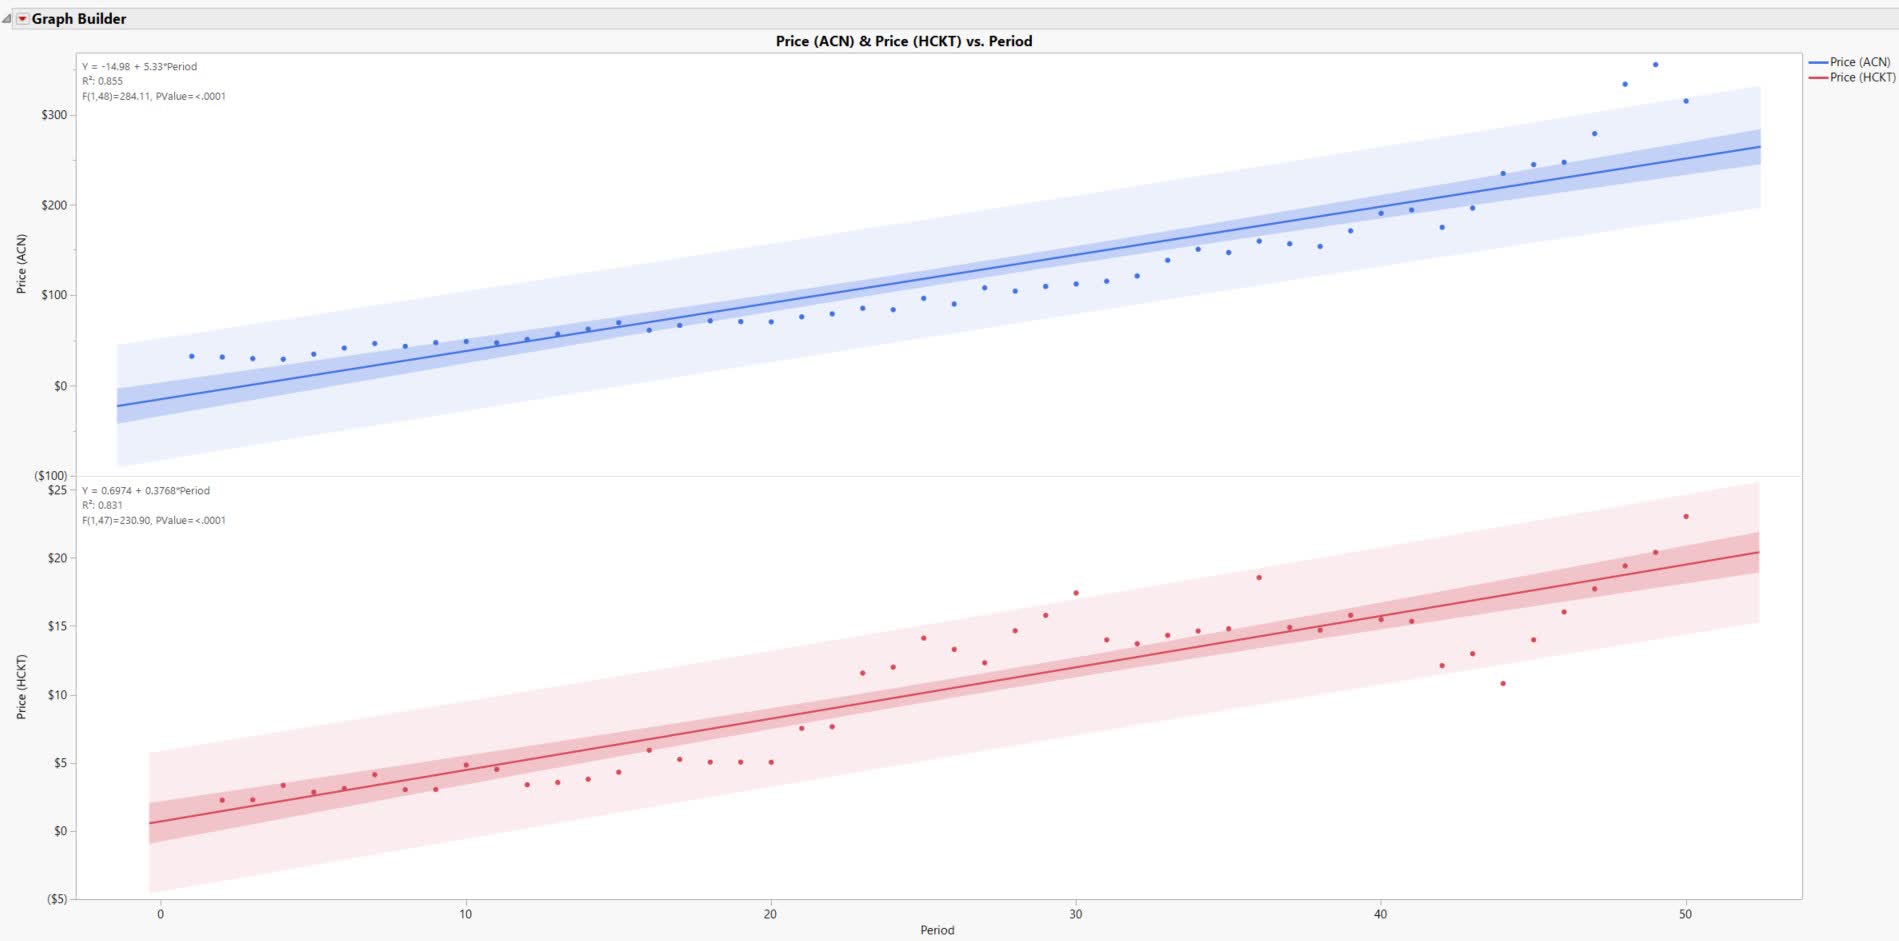
In extrapolating the price for ACN for the quarter (Q3 FY 2022), we will use the following formula: Price = -14.98 + 5.33 * Period, given a period value of 51 equates to an extrapolated price of $256.85 for ACN. In extrapolating the price for HCKT for the quarter (Q3 FY 2022), we will use the following formula: Price = 0.6974 + 0.3768 * Period, given a period value of 51 equates to an extrapolated price of $19.91 for HCKT.
Discounted Cash Flow Valuation Method
When using the DCF model, we utilize assumptions to determine the revenue and free cash flow inputs. This DCF will utilize the data set formulas presented earlier in the graphs to extrapolate revenue and free cash flow for the period between 2022 and 2030 for both HCKT and ACN. A terminal growth rate of 2.5% will be applied to both companies after 2030. A discount rate of 10% allows for a margin of safety and provides a more equalized assessment of the firms since it is greater than each individual firms’ WACC according to Finbox (ACN = 8.25%, HCKT = 7.75%). HCKT has historically shown more variance than ACN thus having a 10% discount rate also incorporates an extra margin of safety into HCKT.
The discounted terminal value and discounted future cash flow values will then be summed to produce an implied enterprise value. The implied enterprise value will then subtract the net debt (TIKR Terminal) of the firm to produce the implied equity value. The implied equity value is then divided by the most recent quarters shares outstanding (TIKR Terminal) to determine the implied fair value as a goal purchase price derived from the input assumptions.
ACN DCF Models
The formulas for the inputs are as follows:
ACN revenue formula
ACN revenue formula (Author)
ACN free cash flow formula
ACN free cash flow formula (Author) ACN DCF (Author)
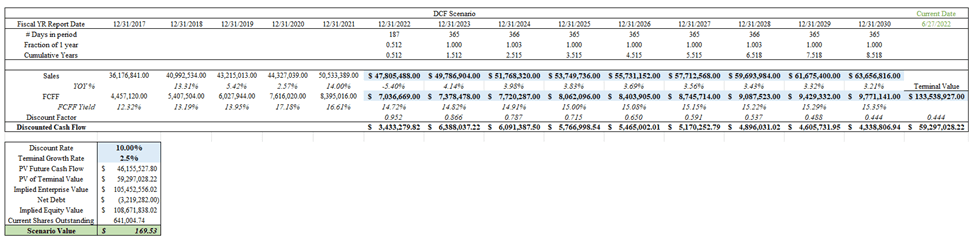
This ACN DCF model results in an implied purchase price of $169.53 per share.
The current ACN DCF does not capture the substantial 8.8% revenue growth estimates that analysts are expecting over the short term. To allow for an aggressive growth scenario to provide perspective, a DCF was performed for a higher revenue growth rate of 8.8% until 2030 and a free cash flow margin at the historical mean rate of 12.8%.
ACN aggressive DCF model (Author)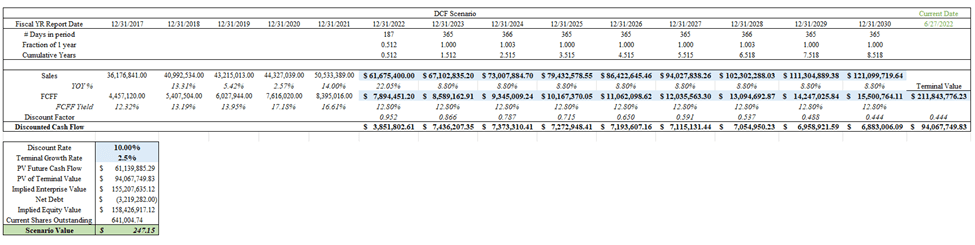
This aggressive DCF model gave an implied purchase price of $247.15 per share of ACN.
HCKT DCF Model
The formulas for the inputs are as follows:
HCKT revenue formula
HCKT revenue formula (Author)
HCKT free cash flow formula
HCKT free cash flow formula (Author) HCKT DCF model (Author)
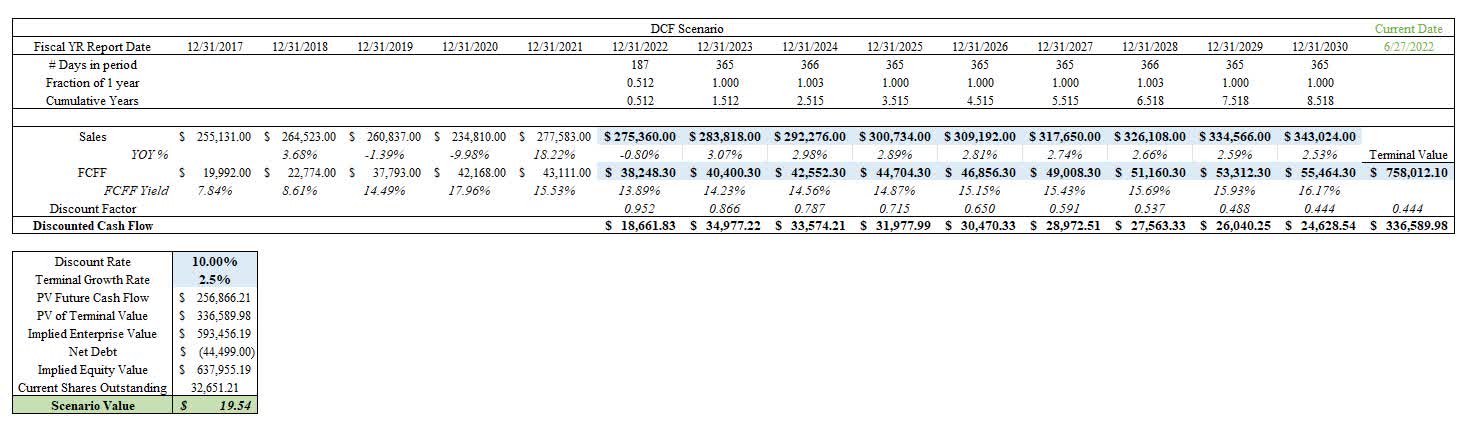
The HCKT DCF results in an implied purchase price of $19.54 per share.
Discussion
ACN shows more predictable revenue compared to HCKT while both firms show inconsistent growth rates. ACN has had a decreasing ROE while HCKT has had a more stable and desirable ROE for investors. Both firms have good free cash flow forecasts and margins. Unfortunately, the price and P/E ratios for ACN have risen well above reasonable levels. The valuation summary portray the overvaluation of ACN and fair valuation of HCKT during the current prices at the time the analysis was performed.
Valuation Summary (Author)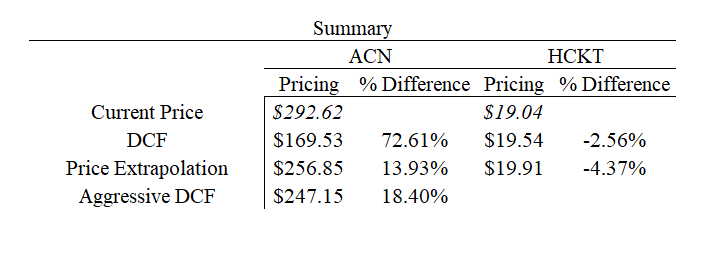
The current price of ACN, approximately $292 per share, is well above all three valuations performed which included an aggressive growth DCF that matched analysts short term revenue expectations and expanded it over a long-term period. For investors who have the expectation of higher performance, the Aggressive DCF and Price Extrapolation values of $247.15 and $256.85 per share respectively could be a fair purchase price for a desired 10% return assuming the growth can be maintained which seems unlikely considering the current macro-environment. The current stock price is trading ~14-19% above these valuations at the time of this writing. Conservative investors might be interested in the purchase price closer to the $170 per share range which the current stock price trades ~ 73% above.
The current price of HCKT, ~ $19 per share trades within the fair value range for both the DCF and extrapolated price. Factoring in the margin of safety within the discount rate, HCKT could be a firm to start adding to investors’ portfolios. I theorize that slowly building a position throughout the year into HCKT to a desired allocation amount could allow for strong returns over the long-term and make a good addition to a diversified portfolio.
Risks
The current macro-environment poses substantial systemic risk to firms across the consulting industry. The consulting industry is also extremely competitive and market share is fragmented among an assortment of firms. There are potential legal, reputational, and financial risks and each independent firm must continue to develop their services and create client demand which could be changed dramatically from a variety of factors. Shorting ACN specifically could have risks associated with stronger than anticipated revenue growth or improving margins while initiating long positions in HCKT could face setbacks specific to their firm that could deteriorate the stock price.
Conclusion
HCKT and ACN are both great consulting firms with long term potential based off the data analyzed. They have reasonable growth prospects and historically predictable returns. They are competing at different scales and have different niches within the industry. I support that HCKT is a long term buy given the growth prospect along with a margin of safety. ACN is a strong firm and could potentially become a purchase for investors if its price moves substantially lower to match its more conservative valuations. I theorize that shorting ACN could be a short term position since it seems to be currently trading at an excessive premium and may continue to experience a price correction from systemic pressures.
Be the first to comment