


niphon/iStock via Getty Images
Investment Thesis
In September, I discussed the potential ramifications of the latest reconstitution for the Index that tracks the VictoryShares US EQ Income Enhanced Volatility Weighted ETF (NASDAQ:CDC). Recall how the Index added several Financial Services stocks like PNC Financial Services Group (PNC) and Bank of New York Mellon (BK) in place of safer names like PepsiCo (PEP) and Coca-Cola (KO). These changes made CDC more volatile but at least satisfied one important investment objective: a high dividend yield. Unfortunately, my analysis shows how the 25 deleted stocks outperformed the additions by 2.97% since October, with 53% higher volatility. This article provides reasons why, and looks at the path forward for this once one-of-a-kind dividend ETF.
ETF Overview
Strategy
I was the first Seeking Alpha analyst to cover CDC in June 2021, and this will be my fourth time covering it this year alone. You’re welcome to read these articles if you want to dive into how the strategy works a little more, but in the interest of your time, here is a brief summary:
- The selection process begins with the 500 largest U.S. securities, except REITs, and eliminates those without four consecutive profitable quarters.
- The 100 highest-yielding securities are inversely weighted by their 180-day standard deviation of price returns.
- Sector exposures are capped at 25%, and reconstitutions occur semi-annually in March and September.
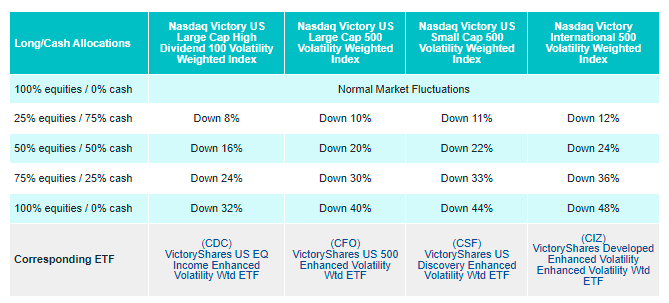
- CDC tracks a Long/Cash Index that reallocates to U.S. Treasuries according to a specific set of rules evaluated monthly, summarized below.
VictoryShares
Sector Exposures and Top Ten Holdings
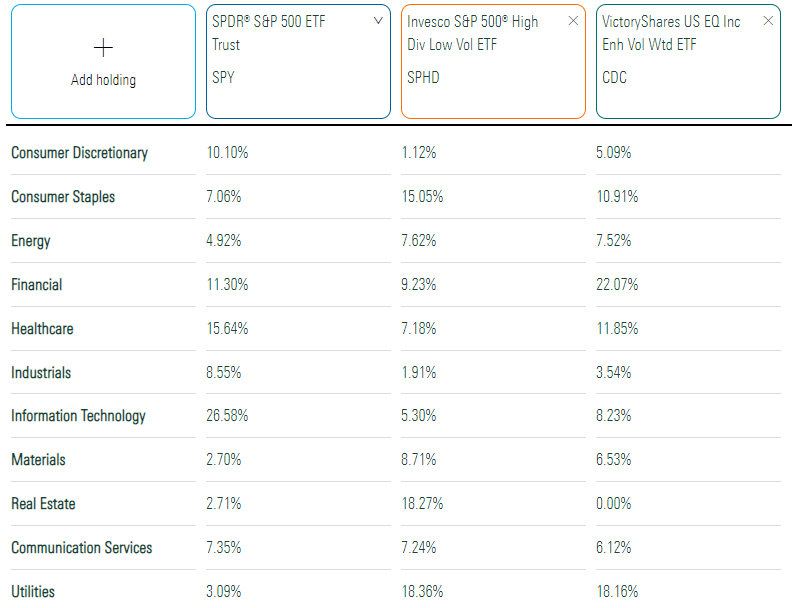
The following table highlights CDC’s sector exposures alongside the SPDR S&P 500 ETF (SPY) and the Invesco S&P 500 High Dividend Low Volatility ETF (SPHD). SPHD and CDC have similar investment objectives, and I will compare their fundamentals later.
Morningstar
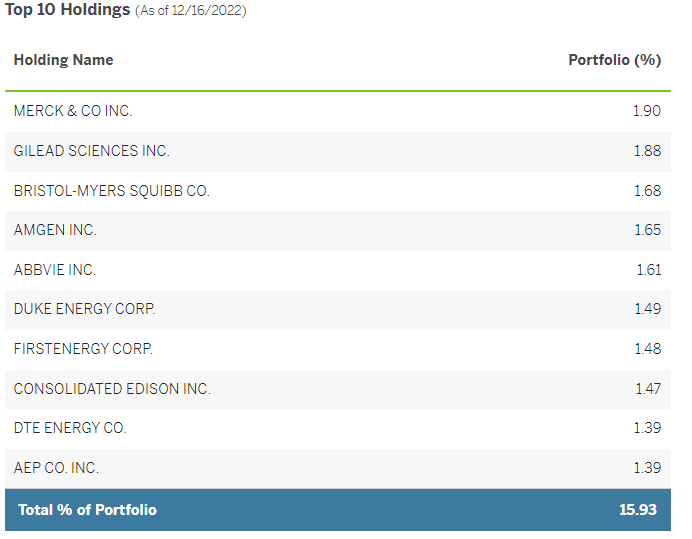
Financials, Utilities, Health Care, and Consumer Staples total over 60% of the entire portfolio vs. 37% and 50% in SPY and SPHD, suggesting a more defensive portfolio. However, as discussed in September, the reconstitution aggressively favored dividend yield over low volatility. Twenty of the 25 additions have five-year betas above one. In contrast, 18 of the 25 deletions had five-year betas below one. Most readers wouldn’t have noticed these changes since none of the additions are in the fund’s top ten holdings. Below is the current list, led by Merck & Co. (MRK), Gilead Sciences (GILD), and Bristol-Myers Squibb (BMY).
VictoryShares
Summary of Latest Changes
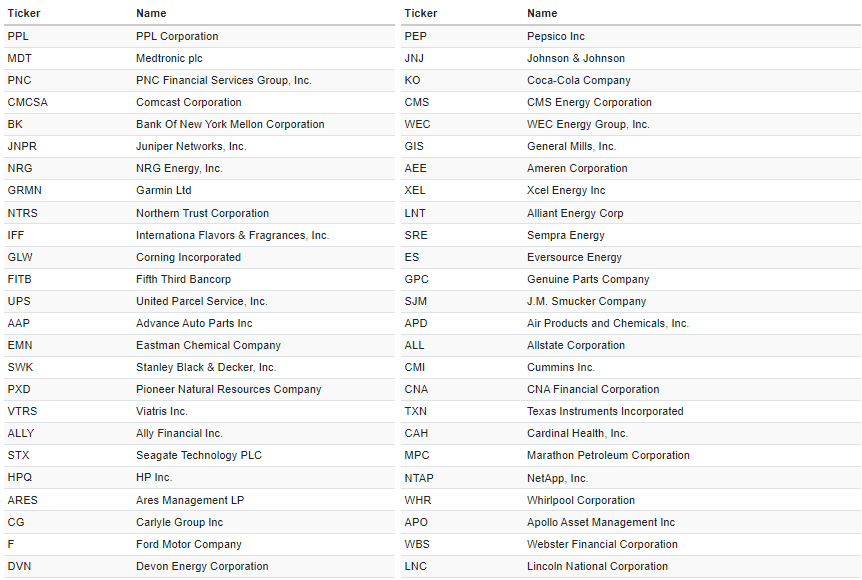
As mentioned, 25 securities were substituted effective the third Friday of September. I’ve summarized these below, with the additions on the left and the deletions on the right.
Portfolio Visualizer
Performance Analysis
Additions vs. Deletions
September’s adjustments made me feel slightly uneasy, as I was not too fond of giving up on safe stocks like PepsiCo (PEP) and Coca-Cola (KO) based on yield alone. It’s how it goes with any rules-based ETF, but it reminded me how sensitive the Index screens are. The Index often selects stocks whose recent performance hasn’t been strong (hence, the high dividend yield). However, the changes are only helpful if other good reasons exist to sell top performers (e.g., excessive valuation, downward-trending sentiment).
It brings me back to a debate I sometimes have regarding if investors should “trust the strategy” or focus on what an ETF currently holds. The answer is somewhere in the middle, and for support, I did a weight-adjusted performance analysis of the “additions” and the “deletions” portfolios. Here are the results from October 1 through December 15, meaning about one week of data in September is excluded.
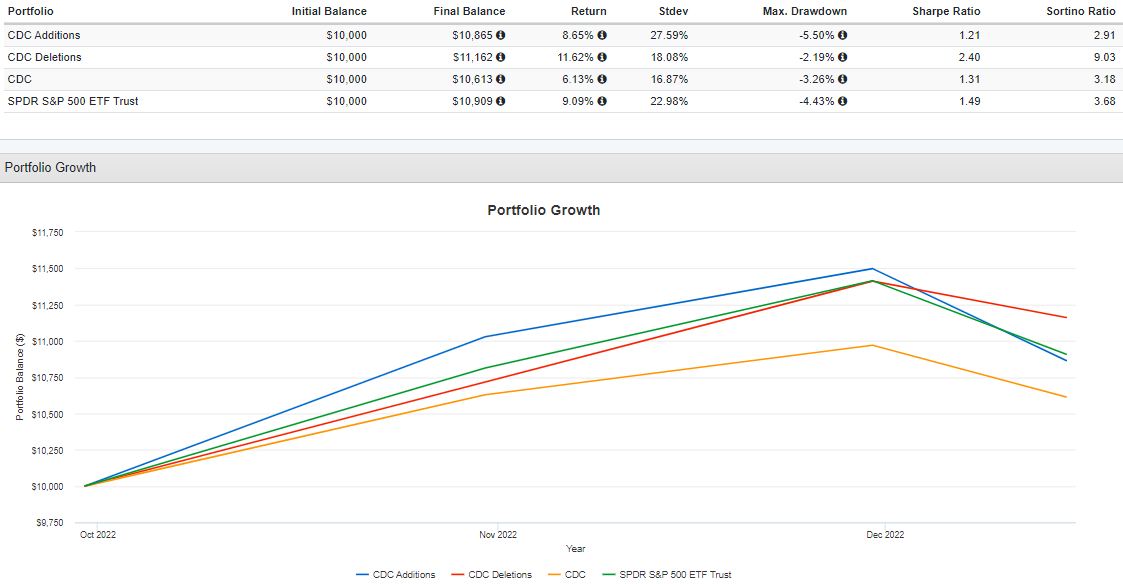
Portfolio Visualizer
In October, the additions took the lead, gaining 10.29% compared to 7.17% for the deletions and 8.13% for SPY. However, the deletions outperformed by 2.23% in November and 3.31% MTD in December. This month, SPY is down 4.43%, and the additions are down 5.50%, so we’re beginning to see some potential issues with high-beta additions in down markets. CDC’s net 0.90 five-year beta is no longer unique among dividend ETFs.
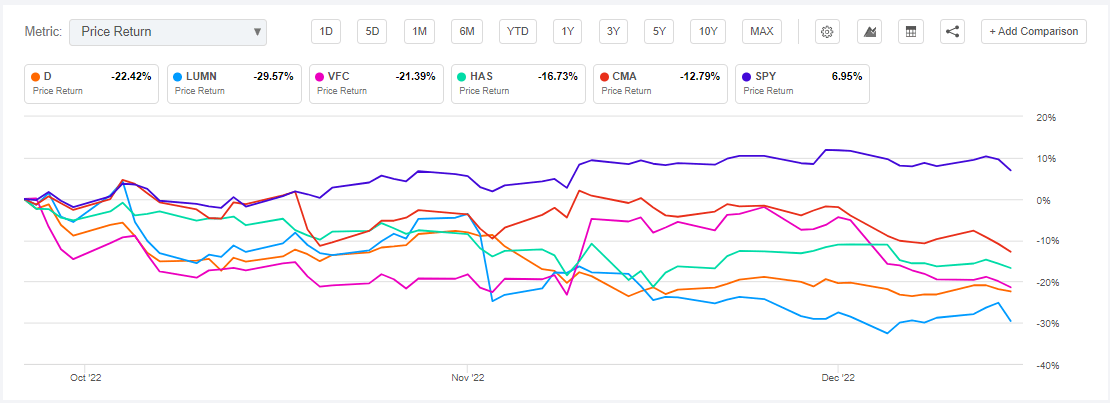
The graph above also reveals that CDC’s 6.13% total return since October trailed both the additions and deletions portfolio, implying that the rest of the portfolio was responsible for the relatively poor performance. While most of the market is still up for the quarter, the following five holdings had a substantially negative impact on CDC’s performance this quarter: Dominion Energy (D), Lumen Technologies (LUMN), V.F. Corp. (VFC), Hasbro (HAS), and Comerica (CMA). Each is down more than 10% since my last article was published, and Dominion, down 22.42%, was previously CDC’s fourth-largest holding. Investors can read this cleverly-titled article for more information on the company’s renewable energy plan.
Seeking Alpha
Performance Since Inception
The following graph compares CDC’s performance with SPHD and SPY, with the results being overwhelmingly positive. Its 10.71% annualized growth rate was superior to SPY’s 10.69%, the ETF experienced less volatility, as measured by standard deviation (12.95% vs. 15.83%), and its 16.45% drawdown was over 7% better. This last figure was due to the Index switching to 75% U.S. Treasuries as markets bottomed in March 2020. Therefore, it may be a little unfair to include it, especially since I’ve concluded that the strategy only “works” 50% of the time. Still, that’s from a total returns perspective. If you define “works” as protecting your capital, that number is much higher.
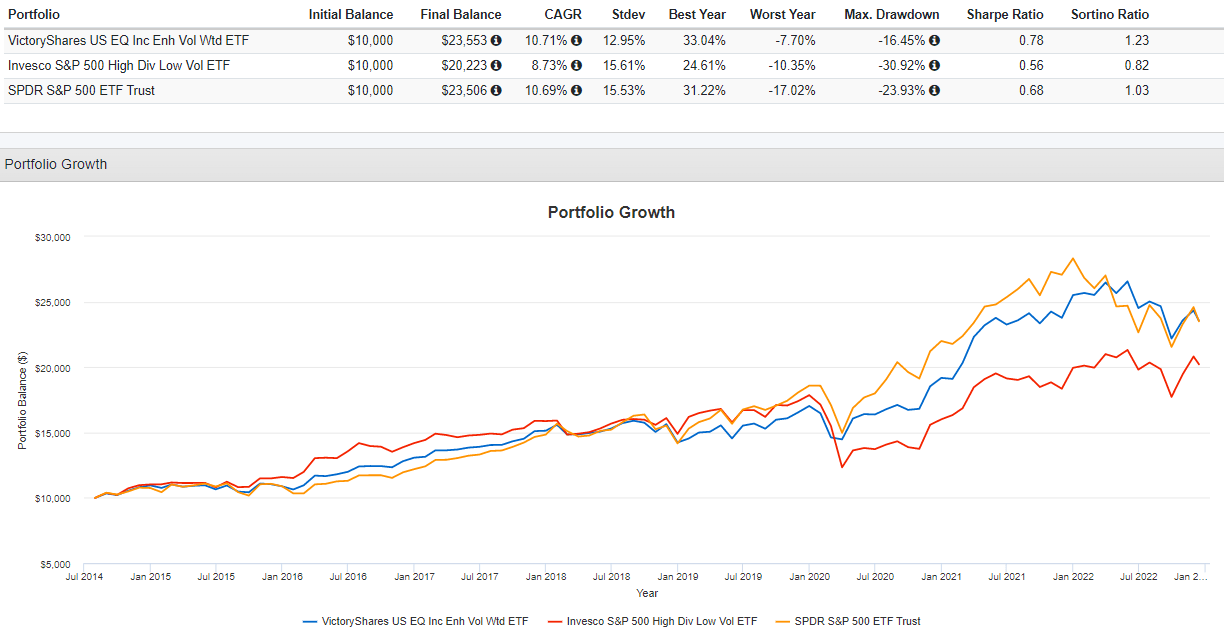
Portfolio Visualizer
SPHD is another high-dividend low-volatility ETF I’ve covered numerous times, though mostly negatively. As shown, the returns aren’t there, but it may be worth a second look now that CDC is a more volatile portfolio. SPHD is one of the few ETFs that combine dividend and low-volatility factors, but it comes with sacrifices. To highlight these tradeoffs, let’s look at the fundamentals of both ETFs next.
ETF Analysis
Industry Snapshot
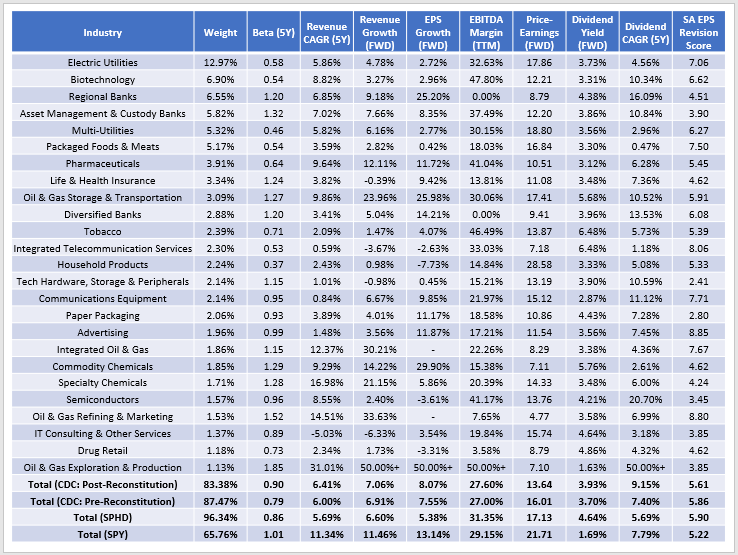
The following table summarizes selected fundamental metrics for CDC’s top 25 industries, both pre- and post-reconstitution. I’ve also included summary metrics for the entire fund and SPHD and SPY in the bottom rows.
The Sunday Investor
These metrics demonstrate how CDC’s five-year beta increased from 0.79 to 0.90 after the September reconstitution. Before, I felt CDC was a bit of a unicorn in the high-dividend and low-volatility space, especially considering how SPHD’s beta is only slightly lower at 0.86. However, 0.90 is about the average for large-cap dividend ETFs. The Schwab U.S. Dividend Equity ETF (SCHD) also has a 0.90 five-year beta and offers a competitive dividend yield with superior growth.
Previously, I reported how CDC’s estimated earnings growth improved. On September 27, 2022, that figure was 10.15%, but it’s since dropped to 8.07%. While not unique to CDC, these downward trends indicate it’s still prudent to be defensive. Ten companies have seen their estimated earnings growth decline by more than 10% in Q4.
- International Paper (IP): 3.95% vs. 16.34%
- Dow (DOW): 37.37% vs. 52.85%
- Hewlett Packard Enterprise (HPE): 3.36% vs. 16.22%
- Franklin Resources (BEN): -10.02% vs. 4.57%
- LyondellBassell Industries (LYB): 20.86% vs. 35.92%
- HP (HPQ): -1.11% vs. 18.31%
- Stanley Black & Decker (SWK): -18.37% vs. -7.88%
- Seagate Technology Holdings (STX): -2.78% vs. 9.96%
- V.F. Corp (VFC): 24.37% vs. 40.09%
- Ally Financial (ALLY): 13.08% vs. 30.28%
Furthermore, they all have five-year betas near or above one, Seeking Alpha EPS Revision Grades of “C” or worse, and one-month price declines of 6.39% compared to 2.34% for the fund average. Again, adding more volatile stocks was not beneficial to shareholders.
Still, CDC may work for you because of its ultra-low 13.63x forward earnings valuation. That’s better than the 16.01x valuation for CDC pre-reconstitution, SPHD’s 17.13x, and of course, SPY’s 21.71x. No one will be surprised that CDC has less growth potential than SPY, but it’s interesting to see the growth/valuation variances. CDC trades at an eight-point discount on forward earnings for 5% less earnings growth. Even though SPY holds higher-quality companies, the tradeoff is still reasonable.
Dividends
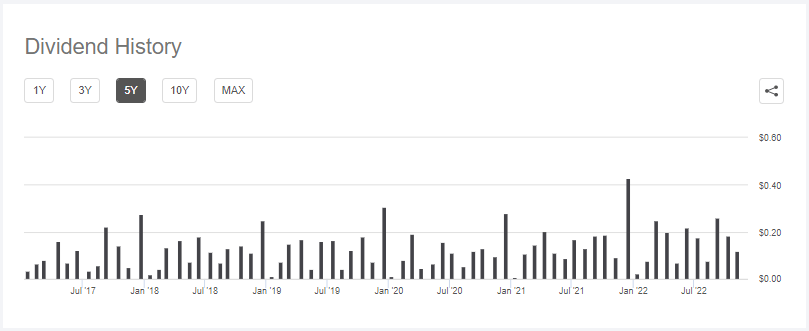
Finally, I want to touch on dividends because CDC’s last two payments weren’t very significant. Here is a chart of the most recent distributions.
Seeking Alpha
The last three distributions per share were $0.2585, $0.1834, and $0.1177, setting the stage for what should be a much higher December distribution. I’ve calculated a 3.93% annualized gross dividend yield based on current holdings, or about 3.58% after fees. It’s lower than SPHD’s 4.64% (4.34% net), but historical dividend growth is much more substantial. To illustrate, consider the following income growth assuming these yield and growth rates held.
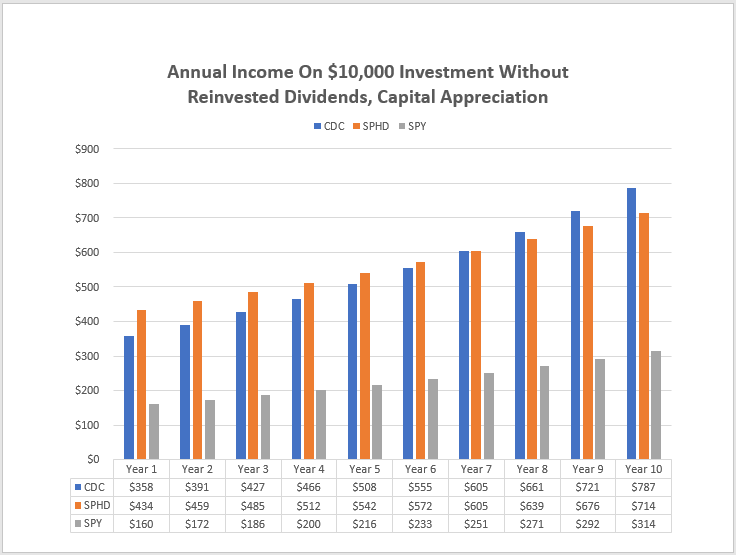
The Sunday Investor
By Year 7, CDC and SPHD are expected to generate the same $605 annual income on a $10,000 initial investment. You can boost those numbers by reinvesting the monthly payments, and actual figures will likely be higher, given how I’ve assumed no capital appreciation.
Investment Recommendation
CDC is less of a unicorn ETF than it once was, diminishing its appeal. My “hold” rating is because, in recent months, I’ve determined that its long/cash strategy only works about 50% of the time and that the screens used are pretty sensitive. With rules-based ETFs, I don’t expect holdings to stay consistent each time the Index reconstitutes. However, I want predictable investment characteristics like volatility, valuation, dividends, growth, and profitability. That way, I’ll be able to “trust the strategy” a little more and focus less on the semi-annual changes.
While September’s added volatility was not beneficial to shareholders, CDC trades at just 13.64x forward earnings and has a decent built-in profitability screen requiring four consecutive quarters of positive earnings. Compared with SPHD, the result is a higher-quality, cheaper ETF that’s still competitive on dividend yield. I hope this information was helpful and gives you confidence that CDC is still worth holding onto, and as always, I look forward to continuing the discussion in the comments section below.
Be the first to comment