

PytyCzech
Constellation Energy’s (NASDAQ:CEG) stock price increased by more than 30% in the past three months as the Inflation Reduction Act of 2022 (IRA) was signed into law by President Biden. IRA creates a tax credit for the production of carbon-free nuclear energy resources and clean hydrogen. CEG is the largest producer of carbon-free electricity in the United States, which produces 10% of carbon-free electricity in the country. Thus, the company’s contracted revenues will increase in the next following quarters. The company’s 160 MW agreement with Bank of America and 78 MW agreements with PNC Bank will bring CEG significant revenues in the following years. The stock is a buy.
Quarterly highlights
In its 2Q 2022 financial results, CEG reported operating revenues of $5465 million, compared with 2Q 2021 total revenues of $4153 million. The company’s operating expenses increased from $4469 million in 2Q 2021 to $5191 million in 2Q 2022. CEG’s net loss attributable to common shareholders increased from ($61) million in 2Q 2021 to ($111) million in 2Q 2022. Also, CEG’s adjusted EBITDA decreased from $656 million in 2Q 2021 to $603 million in 2Q 2022. The company’s total nuclear generation decreased from 43072 GWh in 2Q 2021 to 42522 GWh in 2Q 2022. Also, its total natural gas oil and renewables decreased from 5820 GWh in 2Q 2021 to 5684 GWh in 2Q 2022. In the second quarter of 2022, CEG reported a total purchased power of 16903 GWh, compared with a total purchased power of 16835 GWh in 2Q 2021. The company’s total supply/sales decreased from 65727 GWh in 2Q 2021 to 65105 GWh in 2Q 2022. CEG’s total outage days increased from 73 days in 2Q 2021 to 81 days in 2Q 2022, driven by increased non-refueling outage days. The company announced agreements with Bank of America and PNC Bank to procure carbon-free energy and RECs to reduce their carbon footprints through Constellation’s CORe retail power product. “The landmark climate legislation currently under consideration in Congress is a clear affirmation of the value of our carbon-free nuclear fleet and its indispensable role as part of the clean energy infrastructure needed to achieve our nation’s ambitious climate goals,” the CEO stated. “We delivered solid financial results during the quarter, earning $603 million in adjusted EBITDA backed by higher realized energy prices and lower nuclear fuel costs,” the CFO commented.
The market outlook
Due to the Inflation Reduction Act of 2022, a nine-year production tax credit to support carbon-free nuclear energy resources produced. It also created a tax credit for the production of clean hydrogen which can be made with nuclear and other carbon-free energy resources. The IRA includes about $369 billion in incentives for clean energy and climate-related programs spending. With a nuclear capacity factor of 94.2%, CEG generated 40.9 TWh of carbon-free electricity in the second quarter of 2022 (see Figure 1).
Figure 1 – CEG’s historical capacity factor
2Q 2022 earnings conference call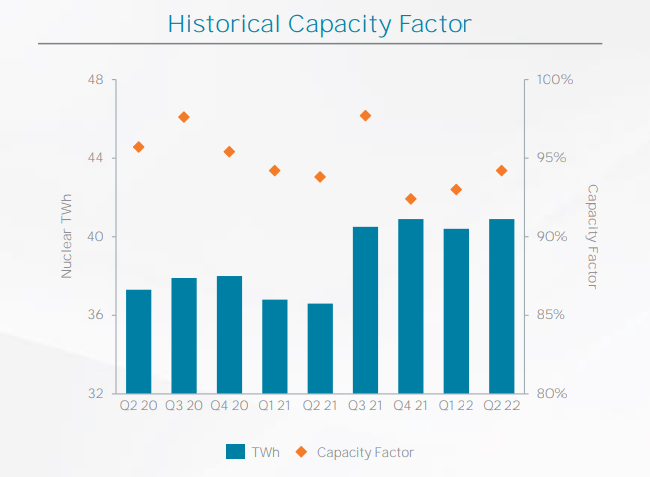
The company expects its contracted revenues to increase from $2450 million on 30 June 2022 to $2800 million on 30 June 2023. Also, it expects its total gross margin to increase from $7300 million on 30 June 2022 to $8150 million on 30 June 2023. Figure 2 shows that the company expects its cleared volumes to increase from 13625 MW in 2021/2022 to 13900 MW in 2022/2023, driven by higher PJM non-nuclear capacity. However, the company expects its cleared volumes to increase from 13900 MW in 2022/2023 to 18775 MW in 2023/2024, driven by significantly higher PJM nuclear capacity. The company’s PJM nuclear cleared volumes will increase by 50% YoY to 16175 MW in 2023/2024. The company’s expectations are on the same path as EIA’s projections. Figure 3 shows that nuclear electric capacity in the United States is projected to increase from 95.5 GW in 2021 to 97.0 GW in 2022 and 97.1 GW in 2023. However, after 2023, EIA expects that nuclear electric capacity in the United States to drop.
Figure 2 – PJM capacity market
2Q 2022 earnings conference call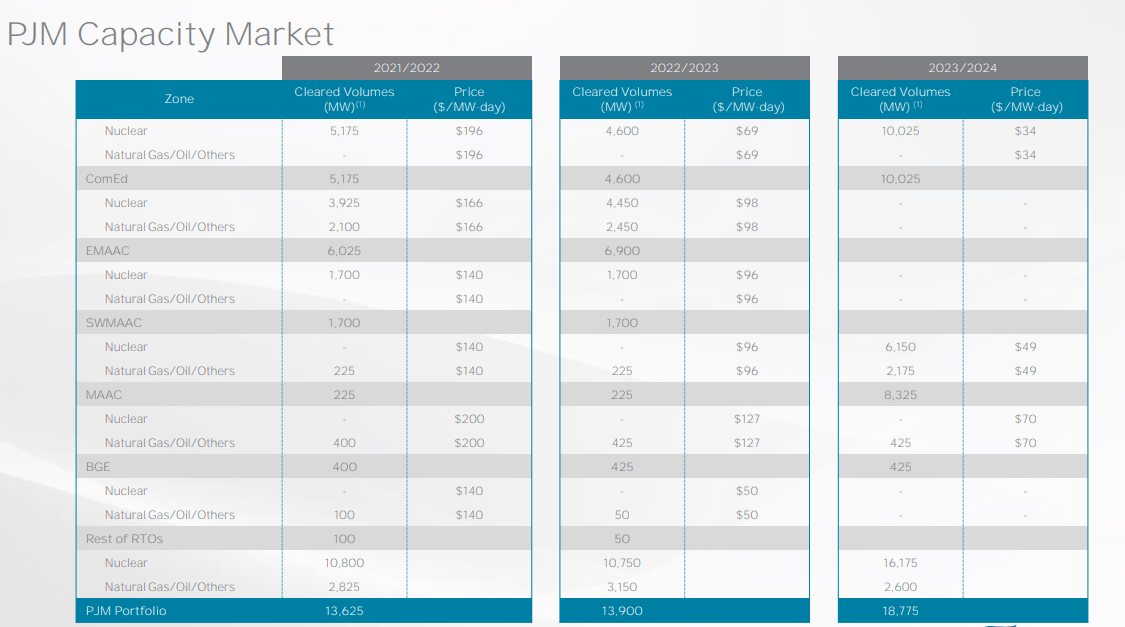
Figure 3 – U.S. nuclear electric capacity
eia
Figure 4 shows that in the first half of the year, the nuclear capacity factor in the United States was 91.7%. CEG’s nuclear capacity factor is more than 94%. Also, it is worth noting that CEG is the largest producer of carbon-free electricity in the United States, which produces 1 of every 10 MWh of carbon-free electricity (see Figure 5). Thus, the company will benefit more from the increasing nuclear electricity capacity in the United States than other companies.
Figure 4 – U.S. nuclear energy overview
eia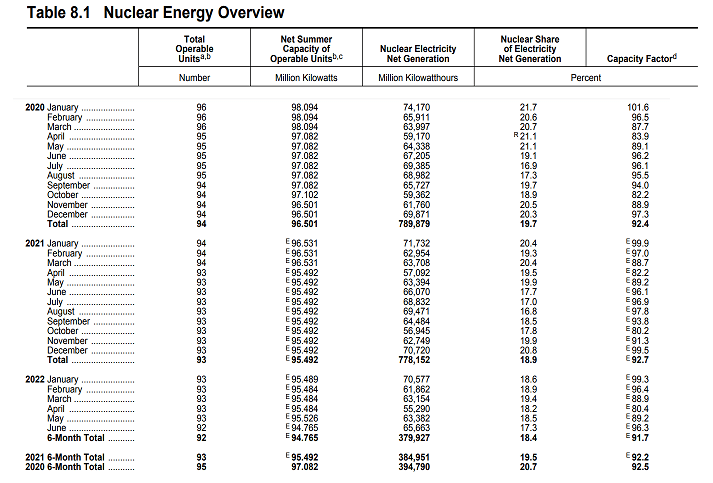
Figure 5 – Largest producers of carbon-free generation
2Q 2022 presentation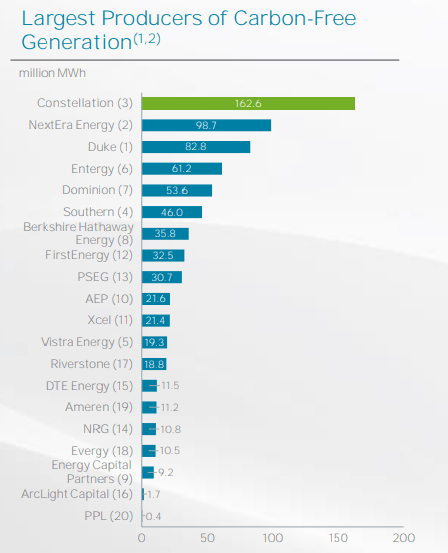
CEG performance outlook
In this detailed analysis, I have investigated Constellation Energy Corporation’s performance across the board of leverage and coverage ratios. Leverage ratios could be insightful to show how the company is financing its assets and business operations. In other words, does it use debt or equity financing for most of its operations? In this analysis, I used some common leverage ratios that have significant comparability to its debt. The ratios are calculated in comparison with previous years to be more helpful.
The debt-to-assets ratio is one of the significant calculations that measures the company’s debt capacity. This ratio indicates the proportion of assets that are being financed with debt. Thereby, the higher the ratio, the greater the degree of leverage and financial risks. After a slightly increase to 0.19 in 2021 from 0.17 in 2020, its debt-to-asset ratio considerably decreased to 0.11 in TTM. Similarly, CEG’s debt-to-EBITDA increased to 2.36 in 2021, which was 24% higher than its previous level of 1.89 in 2020. However, its debt-to-EBITDA amount, which determines the probability of defaulting on debt, decreased back by 38% to 1.44 in TTM.
Finally, like other mentioned ratios, Constellation Energy’s asset-to-equity ratio decreased and sat at 3.98 in TTM compared with its level of 4.14 at the end of 2021. The decreasing assets-to-equity ratio indicates that the company uses lower debt to finance its assets. As a result, the leverage ratios of Constellation Energy Corporation indicate solvency and its ability to meet its current and future obligations (see Figure 6).
Figure 6 – CEG’s leverage ratios
Author (based on SA data)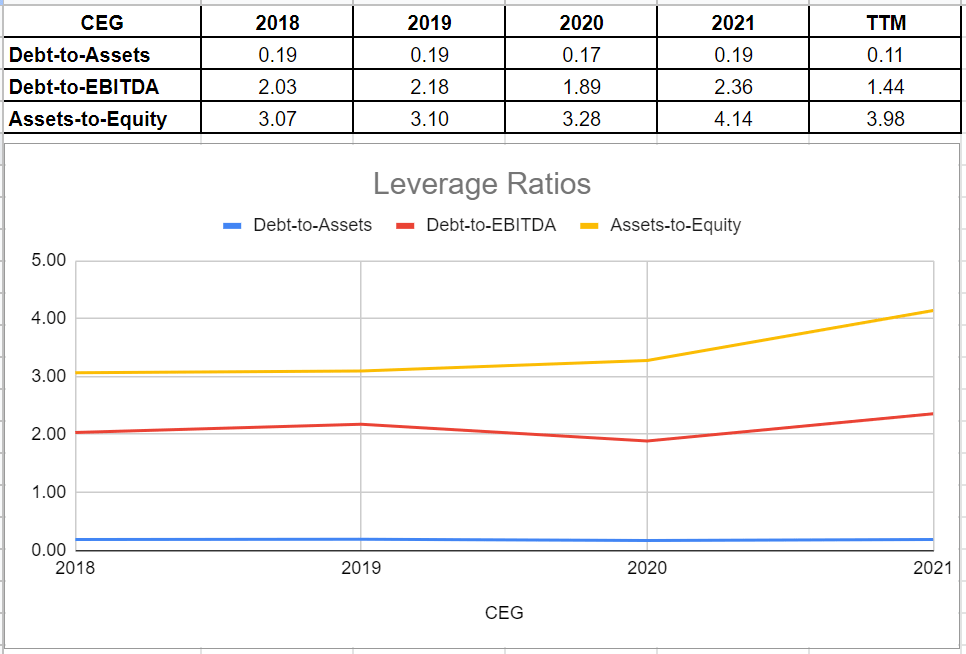
Besides the mentioned ratios, I investigated the coverage ratios of Constellation Energy to measure the company’s ability to pay its financial obligations. Generally, it is observable that the coverage ratios of CEG have improved during recent years. CEG’s ICR has developed impressively in recent years. This ratio indicates the number of times a company can pay its interest expenses on its debt with its operating income. The interest coverage ratio of CEG has improved impressively and sat at 5.96 in TTM versus its previous amount of 4.96 in 2021. Furthermore, as a conservative metric, the cash coverage ratio compares the company’s cash generation with its interest expenses. CEG’s cash coverage ratio increased to 2.87 in TTM versus its previous level of 1.02 at the end of 2021. Thus, Constellation Energy Corporation’s coverage ratios indicate its capability of meeting its financial obligations and providing returns for its investors (see Figure 7).
Figure 7 – CEG’s coverage ratios
Author (based on SA data)
Summary
In the past three quarters, CEG’s capacity factor has been increasing. Due to higher realized energy prices in the second quarter of 2022 (compared with 2Q 2021), the company’s adjusted EBITDA was positively affected. However, lower cleared capacity volumes and capacity prices and nuclear outages caused CEG’s adjusted EBITDA to decrease by 8%. I expect CEG’s cleared capacity to increase significantly in the following quarters. The stock is a buy.
Be the first to comment